ROSATEA – Boston, 10-11 July 2007
Benchmark and Performance Analysis
of a
Large Centralized Tax Processing
Solution
Vijay Jain
Venkata Sai Jayanti Murty
2 ROSATEA – Boston, 10-11 July 2007
Oracle Forms 4.5
Oracle Reports 2.5
Oracle 8i database
RCC City A
RCC City B
RCC City C
RCC – Regional Computing Centre
Total 36 RCC
Client server
architecture
Each RCC works in isolation
Oracle Forms 4.5 becoming obsolete
Customer needed consolidation as business strategy
Replace with one single centralized
system for the country
3 ROSATEA – Boston, 10-11 July 2007 Oracle HTTP
server Oracle 10g AS Oracle 9i NCC -National Computing Centre
RCC City C RCC City A RCC City B LBS’s LBS’s Forms & Report server
Background
Benchmark to determine if this is technically feasible.
(Proposed Architecture)
4 ROSATEA – Boston, 10-11 July 2007
Profile
• 52 million returns to be processed in 4 months
• 10000 assessing officers across 750 locations
• Floated a RFP for System Integration
• Application Benchmarking a pre-condition in RFP
• Benchmark to be done on one business transaction “Processing of
Income-Tax Returns”
• TCSL led consortium responded to the RFP
• Carried out benchmark in HP Labs, China
5 ROSATEA – Boston, 10-11 July 2007
Objectives of the Benchmark
• To verify server side performance
• To evaluate scalability targets
• Apply modeling techniques to measured parameters
• Recommend hardware configuration for the application.
6 ROSATEA – Boston, 10-11 July 2007
Rules of the Benchmark
• Server Partition, Disk and Volume size frozen by customer
• Application/Database/Load Runner scripts frozen
• Think Time fixed at 3 seconds
• Deterministic Think Time
• No reorganization of tablespaces structure and database
permitted
• No application optimization permitted
• Configuration parameter tuning of web, app, DB servers
permitted
• Tests to be executed: 1000, 2000 users for 1 million
transactions and 4000 users for 1, 2, 4 million transactions
7 ROSATEA – Boston, 10-11 July 2007
Logical Diagram
LoadController Load Load Controller Controller Load Generator #1 Load Load Generator Generator #1 #1 Load Generator #3 Load Load Generator Generator #3 #3 Load Generator #2 Load Load Generator Generator #2 #2 Load Generator #4 Load Load Generator Generator #4 #4 Load Generator #10 Load Load Generator Generator #10 #10 Load Balancer Load Balancer Load Balancer Web Server #1 Web Server Web Server #1 #1 Web Server#3 Web Server Web Server #3 #3 Web Server #2 Web Server Web Server #2 #2 Web Server#4 Web Server Web Server #4 #4 Web Server#6 Web Server Web Server #6 #6 Application Server #1 Application Application Server Server #1 #1 Application Server #3 Application Application Server Server #3 #3 Application Server #2 Application Application Server Server #2 #2 Application Server #4 Application Application Server Server #4 #4 Database Server #2 (NCC) Database Database Server Server #2 (NCC) #2 (NCC) Database Server #1 (RCC) Database Database Server Server #1 (RCC) #1 (RCC) Mercury LoadRunner 8.0 Xeon 2 CPU/4GB DL480 Win2K rp8420 8CPU/32GB partition PA8900 1.1GHz Superdome 32CPU/128GB partition PA8800 1Ghz Oracle 9.2.0.4 Superdome 32CPU/128GB partition PA8800 1Ghz Oracle 9.2.0.4 Radware WSD 3.0 Oracle 10gAS 9.0.4.0 1 8 1 4 146 GB 10K rpm XP12000 32GB Cache App & DB server partitioning as per RFP 8 ROSATEA – Boston, 10-11 July 2007
(T
0+) T
1+ T
2+ T
3+ T
4+ T
5+ T
6+ T
7+ T
8+ T
9+ I = 3 sec
R
i< 1 sec for i = 0,..,9
Think Time Response Time Inter-iteration Time LoginMain Screen Adjustment/Demand
Save Comp-uted Records
Open Refund Details
Open Print Results Save Refund Details Close Print Results T0 R1 R2 R3 R4 R0 R5 R6 R7 R8 R9 T1 T2 T3 T4 T5 T6 T7 T8 T9 I Logout R1 12.5%
Observed cycle time of 120 sec in reality
Business Transaction Benchmarked
9 ROSATEA – Boston, 10-11 July 2007
Test Configuration
16 CPU
32GB
RCC
8 CPU
32 GB
8 CPU
32 GB
2 CPU
4 GB
2 CPU
4 GB
Database Server Application Server Web Server1000 Users
1 Million Returns
16 CPU
32GB
NCC
10 ROSATEA – Boston, 10-11 July 2007Initial Glitches
• With 3 sec think time response time target surpassed
at 500 users itself
• Heavy buffer busy, row lock waits
• Tuning and adding resources were of little help
• Raised the issue with customer
11 ROSATEA – Boston, 10-11 July 2007
(T
0+) T
1+ T
2+ T
3+ T
4+ T
5+ T
6+ T
7+ T
8+ T
9+ I = 3 sec
Ri < 1 sec for i = 0,..,9 Think Time Response Time Inter-iteration Time LoginMain Screen Adjustment/Demand
Save Comp-uted Records
Open Refund Details
Open Print Results Save Refund Details Close Print Results T0 R1 R2 R3 R4 R0 R5 R6 R7 R8 R9 T1 T2 T3 T4 T5 T6 T7 T8 T9 I Logout R1 12.5%
39 sec
Observed cycle time of 120 sec in reality
Business Transaction Benchmarked
12 ROSATEA – Boston, 10-11 July 2007
Test Configuration
8 CPU
32 GB
8 CPU
32 GB
2 CPU
4 GB
2 CPU
4 GB
32 CPU
128 GB
RCC
8 CPU
32 GB
8 CPU
32 GB
2 CPU
4 GB
2 CPU
4 GB
Database Server Application Server Web Server2000 Users 1 Million Returns
32 CPU
128 GB
13 ROSATEA – Boston, 10-11 July 2007
Test Results: 1000 & 2000 users
Throughput 32 16 CPU Used (RCC) 1 M 1 M Returns processed Utilization
Response Times sec
< 10% ~15% Web CPU % ~40% ~40% Apps CPU % ~50% ~45% DB CPU % User Exit Print Result Refund Details Compute Main Screen 1.1 0.4 0.3 0.3 0.4 0.5 1.1 0.3 0.2 0.1 0.3 0.4 User Login 05:43 11:09 Completion Time (Hrs) 48 25 Business TPS 2000/ 1 million 1000/ 1million Test Type à 1.2 0.3 0.2 0.1 0.4 0.5 Avg 95th pct 1.0 0.4 0.2 0.2 0.3 0.4 Meets RFP Criteria Throughput scales almost linearly – no apparent bottleneck 15 ROSATEA – Boston, 10-11 July 2007
4000 user test
Results on App/DB configuration used for 2000 users
Results on higher number of CPUs
Scalability limiting analysis
Further analysis of response time
2 CPU
4 GB
2 CPU
4 GB
2 CPU
4 GB
2 CPU
4 GB
Database Server Application Server Web Server8 CPU
32 GB
8 CPU
32 GB
8 CPU
32 GB
8 CPU
32 GB
32 CPU
128 GB
RCC
32 CPU
128 GB
NCC
2 CPU
4 GB
2 CPU
4 GB
Base Configuration
16 ROSATEA – Boston, 10-11 July 2007
4000 user results: 32CPU App, 32 CPU RCC
32 1 M < 10% ~40% ~50% 05:43 48 2000/ 1 million 1.0 0.4 0.2 0.2 0.3 0.4 32 CPU Used (RCC) 1 M Returns processed ~5% Web CPU % ~45% Apps CPU % ~50% DB CPU % User Exit Print Result Refund Details Compute Main Screen 1.2 29.3 4.5 17.1 2.1 1.6 User Login 06:03 Completion Time (Hrs) 47 Business TPS 4000/ 1 million Test Type à 1.1 24.0 2.1 13.7 0.7 0.6 Throughput
Response TimeAvg 95pctth
Utilization
X*
17 ROSATEA – Boston, 10-11 July 2007
4000 user test: Impact of adding DB CPUs
5 47 tps 5 47 tps 4 47 tps 4 48 tps No. of App Server
Business Throughput
Utilization
Response Times (seconds)
~40% ~40% ~45% ~40% Apps CPU % ~40% ~45% ~50% ~50% DB CPU % 1 1 User Exit 29 0.4 Print Result 5 0. 3 Refund Details 32 CPUs 32 CPUs 17 0. 3 Compute same as for same as for 2 0.4 Main Screen 2 0.5 User Login 56 48 32 32 No. of RCC CPU 4000 4000 4000 2000 No. of Users
19 ROSATEA – Boston, 10-11 July 2007
4000 user test: Network, Disk, Memory on DB server
Nothing to be alarmed
about
No disk, memory,
network bottlenecks
Database does not scale
with CPUs
Are there any bad SQLs, contention problems, wait events?
< 192Kbps on 1 Gbps lan
< 45%
Constant at 45%
20 ROSATEA – Boston, 10-11 July 2007
SQL processing contribution
SQL ordered by Gets for DB: RCC Instance: RCC
CPU Elapsd
Buffer Gets Executions Gets per Exec %Total Time (s) Time (s) Hash Value --- --- --- --- --- --- ---454,871,006 87,688 5,187.4 46.8 2778.07 20102.85 3184176672 Module: f90runm@rp84201 (TNS V1-V3)
SELECT ROWID,SEQ_NO,IND_STAT,BNDL_AREA_CD,BNDL_AO_TYP,BNDL_RANGE _CD,BNDL_AO_NO,BNDL_FIN_YR,BNDL_CNTR_NO,BNDL_SEQ_NO,ACK_NO,AST_Y R,PAN,DT_FILED,NAME,RET_INC FROM SS_RETURN WHERE (SEQ_NO IN (SEL ECT a.SEQ_NO FROM ss_return a WHERE A.RANGE_CD = :1 AND A.AO_NO = :2 AND A.AO_TYP = :3 AND A.area_cd = :4)) and (AST_YR=:5) and
SQL ordered by Reads for DB: RCC Instance: RCC
CPU Elapsd
Physical Reads Executions Reads per Exec %Total Time (s) Time (s) Hash Value --- --- --- --- --- ---
---14,416,210 87,688 164.4 83.6 2778.07 20102.85 3184176672 Module: f90runm@rp84201 (TNS V1-V3)
SELECT ROWID,SEQ_NO,IND_STAT,BNDL_AREA_CD,BNDL_AO_TYP,BNDL_RANGE _CD,BNDL_AO_NO,BNDL_FIN_YR,BNDL_CNTR_NO,BNDL_SEQ_NO,ACK_NO,AST_Y R,PAN,DT_FILED,NAME,RET_INC FROM SS_RETURN WHERE (SEQ_NO IN (SEL ECT a.SEQ_NO FROM ss_return a WHERE A.RANGE_CD = :1 AND A.AO_NO = :2 AND A.AO_TYP = :3 AND A.area_cd = :4)) and (AST_YR=:5) and
Y
Extract of Oracle Statspack report for 4000 user test
High
physical
and logical
reads
Avg. Response time/Execution= 20102.85/87688 =0.23 sec
Avg Rsp Time for bus txn = 40.5 sec
0.23 sec due to this SQL
Is it worth tuning?
24.0 Print Result 2.1 Refund Details 13.7 Compute 0.7 Main Screen Avg.21 ROSATEA – Boston, 10-11 July 2007
What is a latch in Oracle DB
• Simple, low-level serialization mechanism to protect shared data structures
in the system global area (SGA)
• Provide only exclusive access to protected data structures needed briefly
Observed excessively high Latch contention
Latches are
applied in
these stages
Latches are
applied in
these stages
Syntax Check Syntax Check Semantic Analysis Semantic AnalysisWas the statement already parsed by another session?
Was the statement already parsed by another session? Hard Parse Hard Parse Soft Parse Soft Parse No Yes 22 ROSATEA – Boston, 10-11 July 2007
Database Wait Event Analysis
STATSPACK report for
Snap Id Snap Time Sessions Curs/Sess Comment
--- --- --- --- ---Begin Snap: 2 31-Oct-05 18:36:38 4,009 118.7
End Snap: 3 31-Oct-05 19:06:39 4,006 120.7 Elapsed: 30.02 (mins)
Top 5 Timed Events
~~~~~~~~~~~~~~~~~~~~~ % Total
Event Waits Time (s) Ela Time --- --- --- ---latch free 1,539,663 3,587,743 98.96 CPU time 28,487 .79 db file sequential read 17,221,454 7,500 .21 log file sync 46,102 773 .02 enqueue 5,299 680 .02
---Wait Events for DB: RCC Instance: RCC
Avg.
Total Wait wait Waits Event Waits Timeouts Time (s) (ms) /txn --- --- --- --- --- ---latch free 1,539,663 0 3,587,743 2330 5.4 db file sequential read 17,221,454 0 7,500 0 60.6 log file sync 246,102 0 773 3 0.9 enqueue 5,299 8 680 128 0.0
Excessively
high Latch
contention
(99% of total
wait time)
Y
Extract of Oracle Statspack report for 4000 user test: 30 min
5.1
Latch Free wait during 2000 user test was 8.31% and Avg. wait time was 2 ms
Average Wait / DB txn
= 2.3 * 5.1 = 11.73 sec
23 ROSATEA – Boston, 10-11 July 2007
157.70 DB txns/sec
for 47 business
txns/sec
Þ
157.7/47 =
3.36 db txn/bus txn
Latch Wait’s Contribution to Response Time
Snap Id Snap Time Sessions Curs/Sess Comment
--- ---- --- --- ---Begin Snap: 2 31-Oct-05 18:36:38 4,009 118.7
End Snap: 3 31-Oct-05 19:06:39 4,006 120.7 Elapsed: 30.02 (mins)
Load Profile
~~~~~~~~~~~~ Per Second Per Transaction --- ---Redo size: 1,537,284.62 9,748.08 Logical reads: 539,210.76 3,419.19 Block changes: 8,615.05 54.63 Physical reads: 9,570.96 60.69 Physical writes: 982.97 6.23 User calls: 22,725.02 144.10 Parses: 14,450.63 91.63 Hard parses: 0.00 0.00 Sorts: 3,699.62 23.46 Logons: 0.00 0.00 Executes: 38,242.79 242.50 Transactions: 157.70
Contribution of Latch Wait Time to Response Time
= Avg Wait Time/DB txn * No. of DB txn/Business Txn = 11.73 * 3.36
= 39.41 seconds
Average Response Time for 4000 users
= 0.7 + 13.7 + 2.1 + 24.0 = 40.5 seconds 24.0 Print Result 2.1 Refund Details 13.7 Compute 0.7 Main Screen Avg.
X*
24 ROSATEA – Boston, 10-11 July 2007Parsing Analysis
SQL ordered by Parse Calls for DB: RCC Instance: RCC
% Total
Parse Calls Executions Parses Hash Value --- --- --- ---14,285,993 14,286,265 54.89 2588670467 Module: f90runm@rp84201 (TNS V1-V3)
declare p varchar2(32767); begin p := GF_GLOBAL_POLICY(:sn, :on); :v1 := substr(p,1,4000); :v2 := substr(p,4001,4000); :v3 := substr(p,8001,4000); :v4 := substr(p,12001,4000); :v5 := substr(p,16001,4000); :v6 := substr(p,20001,4000);
2,939,514 2,939,618 11.29 2294365478 Module: f90runm@rp84201 (TNS V1-V3)
declare p varchar2(32767); begin p := GF_MASTER_POLICY(:sn, :on); :v1 := substr(p,1,4000); :v2 := substr(p,4001,4000); :v3 := substr(p,8001,4000); :v4 := substr(p,12001,4000); :v5 := substr(p,16001,4000); :v6 := substr(p,20001,4000);
349,887 2,988,725 1.34 3106935379 Module: f90runm@rp84201 (TNS V1-V3)
SELECT RCC_NUM From GS_EMP_RCC WHERE ORAUSER = USER
Y
Extract of Oracle Statspack report for 4000 user test
Nearly 66% of total parse calls are for two functions :
GF_GLOBAL_POLICY & GF_MASTER_POLICY
Nearly 66% of total parse calls are for two functions :
GF_GLOBAL_POLICY & GF_MASTER_POLICY
25 ROSATEA – Boston, 10-11 July 2007
declare p varchar2(32767); begin p :=
GF_GLOBAL_POLICY(:sn, :on); :v1 := substr(p,1,4000); :v2 := substr(p,4001,4000); :v3 := substr(p,8001,4000); call count cpu elapsed disk query current rows --- --- -- -- -- -- ---Parse 207 0.01 0.02 0 0 0 0 Execute 207 0.03 0.04 0 420 0 207 Fetch 0 0.00 0.00 0 0 0 0 --- --- --- - - - - ---total 414 0.04 0.07 0 420 0 207 declare p varchar2(32767); begin p :=
GF_MASTER_POLICY(:sn, :on); :v1 := substr(p,1,4000);
:v2 := substr(p,4001,4000); :v3 := substr(p,8001,4000);
call count cpu elapsed disk query current rows --- --- -- -- -- -- ---Parse 40 0.01 0.00 0 0 0 0 Execute 40 0.01 0.01 0 54 0 40 Fetch 0 0.00 0.00 0 0 0 0 --- --- --- ---total 80 0.02 0.02 0 54 0 40
Function Call Analysis
Y
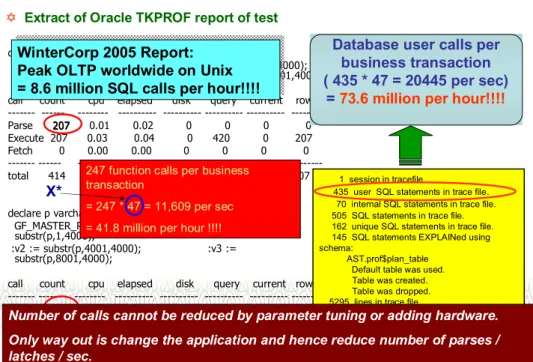
Extract of Oracle TKPROF report of test
1 session in tracefile.
435 user SQL statements in trace file.
70 internal SQL statements in trace file. 505 SQL statements in trace file. 162 unique SQL statements in trace file. 145 SQL statements EXPLAINed using schema:
AST.prof$plan_table Default table was used. Table was created. Table was dropped. 5295 lines in trace file. 247 function calls per business
transaction
= 247 * 47 = 11,609 per sec = 41.8 million per hour !!!!
WinterCorp 2005 Report:
Peak OLTP worldwide on Unix
= 8.6 million SQL calls per hour!!!!
WinterCorp 2005 Report:
Peak OLTP worldwide on Unix
= 8.6 million SQL calls per hour!!!!
Database user calls per
business transaction
( 435 * 47 = 20445 per sec)
=
73.6 million per hour!!!!
X*
20740
Number of calls cannot be reduced by parameter tuning or adding hardware.
Only way out is change the application and hence reduce number of parses /
latches / sec.
26 ROSATEA – Boston, 10-11 July 2007
2000 to 4000 user analysis:
39 sec Think Time
2,330 ms
2 ms
Average Latch Wait Time
47/sec
48/sec
Business Throughput
40.5 sec
1.1 sec
Average Rsp Time of
Entire Business Txn
4000 user
2000 user
N = 2000, R = 1.1, Z = 39 ÞDmax= 20 ms N = 4000, Z = 39, Dmax= 20 ms ÞR = 4000 * 20ms – 39 = 41 secIf business throughput is not changing why does response time and wait time increase so drastically by doubling the number of users ?
Queueing Theory : Closed System under saturation R = N * Dmax– Z
where R = average response time of business txn N = number of users
Z = think time
Dmax= demand at bottleneck resource
= visit count at bottleneck resource/business txn x average service time at bottleneck resource
27 ROSATEA – Boston, 10-11 July 2007
Application
Tuning
Infrastructure
Workload
Think Time
in Transactions
Time Spent in
Components
Resource
Consumption
Config parameters well
tuned
Adding more in one box
does not help
Determinants of Performance
No changes
allowed during
benchmark. Main
bottlenecks
identified.
Is 39 sec
meaningful?
28 ROSATEA – Boston, 10-11 July 2007Think Time Analysis
• Considering :
No. of hours/day = 5
Throughput required to process 52 Million returns
=
36.11 TXNs/Sec
• Applying Little’s Law :
N = (R+Z) * X
4000 4 ? 36.11
• Avg. Think Time = (4000/36.11) – 4 =
106.77 Sec
With 39 sec think time :
52 Million returns can be processed in mere 1.6 months
Though production target is 4 months
29 ROSATEA – Boston, 10-11 July 2007
Test Results: 95 sec Think Time
½ M 1 M 1 M 1 M Returns processed Throughput Utilization
Response Times sec – 95thpercentile
~5% ~5% ~10% ~15% Web CPU % ~35% ~45% ~45% ~40% Apps CPU % ~45% ~50% ~50% ~45% DB CPU % 1.0 1 1.1 1.2 User Exit 0.4 29 0.4 0.3 Print Result 0.2 5 0.3 0.2 Refund Details 0.2 17 0.3 0.1 Compute 0.4 2 0.4 0.4 Main Screen 0.5 2 0.5 0.5 User Login 03:36 06:03 05:43 11:09 Completion Time (Hrs) 38 47 48 25 Business TPS 4000/ ½ million (95) 4000/ 1 million 2000/ 1 million 1000/ 1million Test Type à 30 ROSATEA – Boston, 10-11 July 2007
Conclusions
• Benchmark has proven that application scales linearly till 2000
users with the specified think time.
• Recommendations given for further scalability
• Analysis of the results and workload has proved that the
workload defined for the benchmark is unrealistic
• System can meet the target of processing 52 million returns in 4
months, with reasonable think time and workload
IMPACT :
The RFP was scrapped and new requirements were laid
down with more realistic workload and flexibility
31 ROSATEA – Boston, 10-11 July 2007
Learnings
• Gauge the problem - Is it feasible to achieve target with resolution?
• Whenever doing benchmark, work on performance engineering
model to derive whether it will work or not
• Evaluate contribution of wait event to response time while doing
database analysis
• Every application has certain scalability limits, no matter what
hardware you deploy upon.
“Adding hardware is not the solution for all the problems”
• Choosing realistic workload is imperative to ensure its achievability
and applicability of the results
“ Unrealistic workload may cause cost and schedule overrun exponentially”
32 ROSATEA – Boston, 10-11 July 2007