Modernising regulated professions
Economic importance and impact
Client: Ministerie van Economische Zaken, Directie Europa
Rotterdam, October 12, 2014
Modernising regulated
professions
Economic importance and impact
Client: Ministerie van Economische Zaken, Directie Europa
Robert Haffner (projectleider) Joost de Koning
Martin van der Ende Anastasia Yagafarova
About Ecorys
At Ecorys we aim to deliver real benefit to society through the work we do. We offer research, consultancy and project management, specialising in economic, social and spatial development. Focusing on complex market, policy and management issues we provide our clients in the public, private and not-for-profit sectors worldwide with a unique perspective and high-value solutions. Ecorys’ remarkable history spans more than 85 years. Our expertise covers economy and competitiveness; regions, cities and real estate; energy and water; transport and mobility; social policy, education, health and governance. We value our independence, integrity and partnerships. Our staff comprises dedicated experts from academia and consultancy, who share best practices both within our company and with our partners internationally.
Ecorys Netherlands has an active CSR policy and is ISO14001 certified (the international standard for environmental management systems). Our sustainability goals translate into our company policy and practical measures for people, planet and profit, such as using a 100% green electricity tariff, purchasing carbon offsets for all our flights, incentivising staff to use public transport and printing on FSC or PEFC certified paper. Our actions have reduced our carbon footprint by an estimated 80% since 2007. ECORYS Nederland BV Watermanweg 44 3067 GG Rotterdam P.O. Box 4175 3006 AD Rotterdam The Netherlands T +31 (0)10 453 88 00 F +31 (0)10 453 07 68 E [email protected] Registration no. 24316726 W www.ecorys.nl
Table of contents
Samenvatting (in Dutch) 5
Summary 8
1 Introduction 11
1.1 Background 11
1.2 The goal of the report 12
1.3 Reading guide 12
2 Regulated professions in the Netherlands 13
2.1 Introduction of the methodology applied 13
2.2 Step 1. Identifying regulated professions in the Netherlands 14 2.3 Step 2. Matching the regulated professions with ISCO-codes 14 2.4 Step 3. Analysing the share of the regulated professions by sector 16 2.5 Step 4. Calculating the economic contribution of the regulated professions 18
2.6 Conclusion 22
3 Impact of modernising regulated professions 25
3.1 Regulatory barriers 25
3.2 Modernising regulation 27
3.3 Economic effects of modernising regulations 27
3.3.1 Estimated economic effects for the Netherlands 29
3.3.2 Estimated EU-wide economic impact 33
3.4 Economic benefits of modernisation for the Dutch economy 42
4 References 45
Annex 1. Description of the input-output model 49
Annex 2. Matching sectors and regulated professions 51
Samenvatting (in Dutch)
Doel van het rapport
Recent is op Europees niveau voorgesteld om een modernisering van de regelgeving van gereglementeerde beroepen1 uit te voeren. Volgens de herziene richtlijn erkenning
beroepskwalificaties2 zijn alle Lidstaten verplicht om wettelijke bepalingen rondom de toegang tot gereglementeerde beroepen en de daarbij behorende beroepstitels te evalueren.
Nederland streeft naar een ambitieuze aanpak van deze evaluatie en wil hiermee een voorbeeld zijn voor andere EU-lidstaten. Met het oog op deze evaluatie heeft het Nederlandse ministerie van Economische Zaken (EZ) een project plan opgesteld voor de periode november 2013 tot maart 2016. De eerste stappen van dit plan omvatten: (i) het uitvoeren van een inventarisatie van de bestaande gereglementeerde beroepen en (ii) het uitvoeren van een economisch onderzoek naar de mogelijkheden en het economisch potentieel van een modernisering van de regelgeving van gereglementeerde beroepen in Nederland.
Het doel van dit rapport is om inzicht te geven in het economisch potentieel van een modernisering van de regelgeving van gereglementeerde beroepen in Nederland.
De volgende hoofdvragen worden beantwoord:
1. Welk percentage van de Nederlandse economie wordt gedekt door gereglementeerde beroepen?
2. Bij welke gereglementeerde beroepen kunnen de grootste positieve economische effecten worden bereikt door modernisering?
3. Wat is het verwachte economisch effect van een modernisering van gereglementeerde beroepen voor de Nederlandse economie in de komende 10 jaar?
Resultaten
Het ministerie van Economische Zaken heeft bij de start van dit onderzoekstraject 167 gereglementeerde beroepen in Nederland geïdentificeerd. Deze lijst met gereglementeerde beroepen wordt nog geëvalueerd in het kader van de wederzijdse evaluatie. De Nederlandse economie heeft 27 sectoren waarin gereglementeerde beroepen vertegenwoordigd zijn. Het aantal gereglementeerde beroepen verschilt sterk per sector. De sector gezondheidszorg en sociale dienstverlening (denk aan kinderopvang) staat bovenaan met 73 gereglementeerde beroepen uit een totaal van 167. Ook de sectoren zakelijke dienstverlening, en landbouw, bosbouw en mijnbouw kenneneen relatief groot aantal gereglementeerde beroepen.
Voorzover ons bekend heeft voor de Nederlandse economie nog niet eerder een analyse plaatsgevonden van het aantal personen werkzaam in gereglementeerde beroepen en de impact van deze beroepen op de Nederlandse economie. Wij hebben daarom een methodologie
ontwikkeld om een inschatting te kunnen maken van het economisch belang van gereglementeerde beroepen in Nederland. Rekening houdend met het verkennende karakter van dit onderzoek concluderen wij dat de gereglementeerde beroepen tussen de 9,5% en 15,6% uitmaken van de
1
Richtlijn 2006/123/EG van het Europees Parlement en de Raad van 12 december 2006 betreffende diensten op de interne markt.
2
Richtlijn 2005/36/EG van het Europees Parlement en de Raad van 7 september 2005 betreffende de erkenning van beroepskwalificaties als gewijzigd door richtlijn 2013/55/EU.
totale werkgelegenheid. De onderkant van deze bandbreedte is naar onze mening het meest realistisch; de bovenkant van de bandbreedte is waarschijnlijk een overschatting. De
gereglementeerde beroepen beslaan zo’n 8,8% tot 15,4% van de totale toegevoegde waarde in de economie, met inbegrip van de indirecte effecten op gebruikers van deze diensten. Bij deze indirecte effecten gaat om de impact die deze sectoren als toeleverancier hebben op de rest van de economie. Wanneer we naar de omvang van de indirecte effecten in Nederland kijken, zien we dat deze het grootst zijn voor de gereglementeerde beroepen in de sectoren gezondheidszorg en sociale dienstverlening, zakelijke dienstverlening, landbouw, bosbouw, mijnbouw en de bouw3.
Wanneer we kijken naar het economisch belang van de gereglementeerde beroepen dan concluderen wij dat de gereglementeerde beroepen het grootste aandeel in de toegevoegde waarde hebben in de sectoren gezondheidszorg en sociale dienstverlening en de onderwijssector. Ook in de zakelijke dienstverlening leveren de gregelementeerde beroepen een relatief grote bijdrage. Gegeven het economisch belang van gereglementeerde beroepen in deze sectoren is het interessant om – als een volgende stap - na te gaan waar hervormingen kunnen of moeten plaatsvinden. We merken hierbij op dat verschillende criteria gebruikt kunnen worden om sectoren te selecteren waar hervormingen de meeste kansen voor de Nederlandse economie bieden. De omvang en het huidige economisch belang van gereglementeerde beroepen in een sector is slechts één mogelijk criterium. Nader onderzoek naar de wijze van reglementering en de
mogelijkheden voor hervorming per sector is nodig om tot sectorspecifieke beleidsaanbevelingen te kunnen komen.
Een onderzoek naar beschikbare literatuur op dit gebied wijst uit dat er geen literatuur is die de economische effecten bestudeert van een hervorming van de regelgeving voor gereglementeerde beroepen. Hierdoor is het niet mogelijk om de verwachte effecten van de hervorming van
Nederlandse gereglementeerde beroepen te schatten op basis van eerdere literatuur. Daarentegen is er wel veel literatuur over de economische effecten van hervormingen in de dienstensector. Gezien het feit dat gereglementeerde beroepen ook diensten zijn, zien wij de onderzoeksresultaten uit deze literatuur als de meest relevante indicaties.
De beschikbare literatuur over hervormingen van de dienstensector laat zien dat er een positieve relatie is tussen hervormingen van de regelgeving en de groei van het Bruto Binnenlands Product (BBP). De meeste literatuur over hervorming van de regelgeving in de Nederlandse dienstensector verwacht een toename van het Nederlandse BBP van 0,2-1,4% als gevolg van deze
beleidsaanpassingen. Literatuur die de effecten voor de EU als geheel analyseert vindt een effect van tussen de 0,5% en 1,5% van het EU BBP. Gezien het feit dat de in deze literatuur
geanalyseerde hervormingen van de dienstensector een breder spectrum beslaan dan alleen gereglementeerde beroepen, is het niet mogelijk om deze resultaten als graadmeter te zien van de effecten van een modernisering van gereglementeerde beroepen. De gerapporteerde effecten vormen wel een indicatie dat de verwachte effecten positief en significant kunnen zijn.
Om toch een illustratief beeld te geven van de mogelijke omvang van de economische effecten in Nederland, nemen wij aan dat de ondergrens van de bovenstaande inschattingen (die betrekking hebben op de dienstensector als geheel) een relevant vertrekpunt zijn. Tevens rekening houdend met het aandeel van de gereglementeerde beroepen in de Nederlandse economie komen wij uit op een jaarlijkse opbrengst van 0,06-0,1% BBP als gevolg van hervormingen van de regelgeving voor gereglementeerde beroepen. Wanneer alle hervormingen volledig zijn doorgewerkt, kan deze opbrengst gezien worden als een structurele opbrengst. Om de totale opbrengst voor de economie 3
De publieke sector is de ruime zin van het woord ook een grote speler in het bijdragen aan de andere sectoren.
te berekenen in de komende 10 jaar, gaan we ervan uit dat de volledige impact van de
hervormingen 3 jaar na doorvoering van de hervormingen zichtbaar is. Over een periode van 10 jaar resulteert dit in een bate voor de Nederlandse economie van 2,3 tot 2,8 miljard euro.
Hierbij tekenen we aan dat de verwachte baten mede worden bepaald door de hervormingen die andere EU landen doorvoeren. Als alle EU landen hun gereglementeerde beroepen hervormen, zoals is voorzien, dan hebben de effecten van hervormingen een impact op een grotere markt en kunnen extra baten worden verwacht.
Beperkingen van de studie
Deze studie kent een aantal beperkingen. Ten eerste was het in het kader van deze studie niet mogelijk om een diepgaand onderzoek te doen naar alle gereglementeerde beroepen in Nederland. Hierdoor bestaat er onzekerheid over het exacte aantal personen werkzaam in gereglementeerde beroepen, vooral in de beroepen met een beperkt aantal professionals in Nederland. Ten tweede was het niet mogelijk om een diepgaand onderzoek te doen naar de mogelijkheden voor
hervormingen in gereglementeerde beroepen. Hiervoor is een zorgvuldige analyse vereist
gebaseerd op marktinformatie. Ten derde zorgt het ontbreken van literatuur over de effecten van de reglementering van beroepen in Nederland ervoor dat we slechts een illustratieve indicatie hebben kunnen geven van de potentiële baten die niet is gebaseerd op een robuust ijkpunt. Ten slotte is een onzekerheid dat de verwachte baten mede afhangen van de hervormingsmaatregelen die andere EU landen nemen.
We merken verder op dat hervormingen niet alleen kunnen leiden tot een hoger BBP, maar ook tot allerlei andere effecten die niet uitgebreid in dit rapport aan de orde komen. Zo kan modernisering van regelgeving door het verminderen van administratieve lasten leiden tot een hogere
productiviteit door een efficiëntere werkwijze. Modernisering van gereglementeerde beroepen zou ook kunnen leiden tot meer grensoverschrijdende migratie. Een hogere Europese arbeidsmobiliteit kan een bijdrage leveren aan een efficiëntere en innovatievere dienstensector en een betere aansluiting tussen vraag en aanbod op zowel de arbeidsmarkt als de dienstverleningsmarkt. Dit zijn belangrijke baten die slechts ten dele tot uitdrukking komen in een hoger BBP. Daarnaast moeten mogelijke hervormingsmaatregelen zorgvuldig geanalyseerd worden om mogelijke negatieve of onbedoelde gevolgen te vermijden. Dergelijke analyses vielen niet binnen het kader van deze opdracht.
Tot slot merken wij op dat de mogelijke baten van een modernisering van gereglementeerde beroepen mede zal afhangen van eventuele aanvullende maatregelen gericht op bedrijven of dienstensectoren (en niet op beroepsbeoefenaren). Te denken valt bijvoorbeeld aan maatregelen gericht op het verbeteren van het vestigingsklimaat van bedrijven, zoals het verminderen van administratieve lasten en het wegnemen van toetredingsbelemmeringen. Derhalve adviseren wij om oog te hebben voor de bredere regulatorische context bij het analyseren van mogelijke moderniseringsmaatregelen voor gereglementeerde beroepen om de volledige vruchten van dit beleid te kunnen plukken.
Summary
Goal of the report
Recently, the modernization of the regulation of the regulated professions4 has been proposed at the European level. According to the revised Professional Qualifications Directive5 every Member State is obliged to evaluate statutoryprovisionson access toregulated professions.
The Netherlandshascommitted itself to anambitiousapproach ofthe evaluationandwould like to be an exampleforotherMember States. For the purposeofthis evaluation, the Netherlands Ministry of EconomicAffairs(EZ) prepared aproject plan(Nov 2013 -March 2016). The first steps of this plan include: (i) an inventoryof existingregulated professionsand(ii) astudy on the
economicopportunities andeconomic potential ofthe modernisation oftheregulated professionsin the Netherlands.
This report aims to provide a first insight into the economic potential of modernising regulated professions in the Netherlands.
The following research questions are addressed in this study:
1. What percentage of the Dutch economy is covered by the regulated professions? 2. Which regulated professions are the most promising in terms of economic benefits to be
expected following modernization?
3. What are the expected economic benefits of modernisation of regulated professions over the next 10 years for the Dutch economy?
Findings
At the start of this study the Ministry of Economic Affairs identified 167 regulated professions in the Netherlands. This list with regulated professions is still under evaluation within the framework of a mutual evaluation exercise. Regulated professions are present in 27 sectors of the Dutch
economy. The number of regulated professions differs a lot among the different sectors. The sector of health and social services has the most regulated professions in the Netherlands, with 73 regulated professions out of a total of 167. Business services, agriculture, forestry and mining
follow as sectors where regulated professions have a relatively high share.
As the number of people occupied in regulated professions and their economic footprint has so far not been analysed for the Dutch economy, we developed a methodology to estimate the size and economic impact of the regulated professions in the Netherlands. Keeping in mind the exploratory nature of our work we conclude that the regulated professions cover somewhere between 9.5 and 15.6% of the total employment in the Dutch economy. The lower-bound estimate in our opinion is more realistic, whereas the upper bound estimate is likely to be too high. Regulated professionals account for 8.8-15.4% of value added in the whole economy, including indirect effects on users of these services in other sectors. When looking at the size of indirect effects in the Netherlands we see that they are the largest for the regulated professions within health and social services, business services, agriculture, forestry and mining and construction sectors6.
4
Directive 2006/123/EC of 12 December 2006 on services in the internal market. 5
Directive 2005/36/EC on the recognition of professional qualifications, as amended by directive 2013/55/EU. 6
One more large contributor to other sectors is the public sector in broad sense.
When looking at the economic importance of regulated professions, we conclude that regulated professions represent the largest shares of value added within the health and social services sectors, and the education sector. The contribution of regulated professions in business services is also relatively high. Given the economic importance of regulated professions in these sectors, it could – as a next step – be interesting to investigate where reforms can or should take place. We note that different criteria can potentially be used to select “promising” sectors for reform. The size and economic importance of regulated professions within a sector is just one of them. A closer study of the regulations and the potential for reform in each sector is required to reach more detailed conclusions and sector-specific policy recommendations.
Our study of available literature found that there is no literature which has studied the economic impact of reforming regulated professions in the Netherlands. Therefore, it is not possible to assess the expected impact of modernising Dutch regulated professions based on previous studies. However, there is a large body of literature on the economic impact of service sector reform. As regulated professions are also services activities, we see this as the best available proxy.
The available literature on service sector reform shows that there is a positive relationship between regulatory reform in services sectors and GDP. The majority of the literature on the Netherlands finds an expected impact of between 0.2 and 1.4% of Dutch GDP of services sector modernisation, while studies focusing on an EU-wide implementation of the Services Directive find an expected impact of 0.5-1.5% of EU GDP. Given that the reforms analysed are generally wider in scope than a modernisation of regulated professions, they cannot generally be seen as the expected benefit of modernising regulated professions. The results of these studies do provide an indication that the expected benefit can be positive and significant.
To still provide an illustration of the size of the potential economic impact in the Netherlands, we assume that a lower bound of the estimates discussed above is a relevant starting point. Also taking into account the share of regulated professions in the Dutch economy, we show that modernisation of regulated professions in the Dutch economy could lead to an annual benefit of
0.06-0.1% of GDP for the Dutch economy. This can be seen as a structural impact after all modernisation measures have taken full effect. In order to calculate the economic benefit of modernisation in regulated professions in the next ten years, we assume that the full effect is reached three years after the implementation of modernisation measures. Over a period of 10 years, a rough indication of the net present value of the economic benefits is 2.3 – 3.8 bln. euros.
The expected benefits also depend on measures taken in EU-countries outside the Netherlands. If all EU-countries modernise their regulated professions, as is foreseen, additional benefits can be expected because the reforms have impact on a larger market.
Limitations to the study
There are important caveats to the above high level analysis. First, we have not been able to perform an in-depth analysis for all regulated professions in the Netherlands. Therefore, there is uncertainty regarding the exact number of persons occupied in a regulated professions, especially in relatively “small” professions with a limited number of professionals. Second, we have also not been able to perform an in-depth analysis of the potential for reform in each profession, as this requires extensive market research. Third, the lack of studies on regulated professions in the Netherlands allowed us to only provide an illustrative indication of potential benefits of reform, which is not based on a solid benchmark. Finally, we note that the expected benefits also depend on measures taken in EU-countries outside the Netherlands, which is still uncertain.
A more general observation is that the benefits of reforms are only partially measured by GDP. For example, modernisation measures such as a lowering of the administrative burden can also lead to a higher productivity by working more efficient. Another effect is that modernisation will lead to more cross-border migration in regulated professions resulting in more competition, a more efficient and innovative services market and a better fit between supply and demand on the labour market (quality) and service market (costs). These are important benefits which are only partly measured by GDP. Moreover, any potential modernisation of regulated professions should be carefully assessed to avoid negative or unintended potential side-effects, which have not been taken into account in the above calculations and discussions.
Finally, we note that any benefits of modernising regulated professions may at least in part depend on the implementation of accompanying measures. Such accompanying measures may relate to regulations at company level (e.g. administrative obligations or national standards that need to be met before activities in a certain sector may be undertaken). Therefore, we advise to assess the whole “regulatory” environment for services activities, to ensure that a modernisation of professions’ regulations will bear full fruit.
1 Introduction
1.1 Background
Lawyers and notaries, doctors and teachers are among the oldest professions in the world but are also among the most regulated ones in Europe. In a large number of Member States, the
regulations of lawyers, doctors and others exist which cover required qualifications, and sometimes also cover restrictions on pricing (e.g. fixed fee scales), advertising (e.g. restrictions or bans on comparative or price advertising), inter-professional co-operation and business structure. These types of professions often also enjoy a wide range of exclusive rights. However, little is known about the presence of these types of professions in the Netherlands and their economic contribution, which is the topic of this report.
Regulation of the professions could possibly hamper economic growth
Regulated professions are services, like legal services, accountancy services, pharmacy services or medical services, which require specific qualifications to allow a person to practice this profession.
Professional Qualifications Directive 2005/36/EC (c.f. Article 3-1 a):
‘A regulated profession is professional activity or group of professional activities, access to which, the pursuit of which, or one of the modes of pursuit7 of which is subject, directly or indirectly, by virtue of legislative, regulatory or administrative provisions to the possession of specific professional qualifications8’.
Regulated professions are therefore those to which access is conditional upon the possession of specific qualifications. Often the use of a specific title is protected. There are currently around 800 different regulated professions in the European Union910. Reasons to regulate professions include for example consumer protection, public goods, health and safety. However, when the conditions to obtain a specific qualification are too restrictive this may hamper the free movement of labour and the delivery of cross-border services in the EU. Improving access to these types of professions, for example, through a more flexible and transparent regulatory environment in Member States, would facilitate the mobility of qualified professionals in the EU and result in larger cross-border provision of professional services. A recent Communication of the European Commission reports, that a more modern regulatory environment should have a positive impact on the employment situation and enhance economic growth.11
7
The mode of pursuit of a regulated profession also covers situations in which the use of a professional title is limited by legislative or regulatory provisions to holders of a specific professional qualification (as specified in Article 3(2) of the Directive).
8
Art 3 (1b) states that a professional qualification is “attested by evidence of formal qualifications, an attestation of competence referred to in Article 11, point (a) (i) and/or professional experience. Art 3(1c) states that (c) ‘evidence of formal qualifications’: diplomas, certificates and other evidence issued by an authority in a Member State designated pursuant to legislative, regulatory or administrative provisions of that Member State and certifying successful completion of professional training obtained mainly in the Community’.
9
Database of regulated professions in EU:
http://ec.europa.eu/internal_market/qualifications/regprof/index.cfm?action=regprofs. 10
Some professions are not officially regulated, for example, a real estate agent. Since 2001 the Netherlands does not officially regulate it, thus the title of a real estate agent (‘makelaar’) is not a protected. Nevertheless, the main professional federations: NVM (Dutch Federation of Real Estate Agents), VBO (Association of Real Estate Agents) and VastgoedPro formulated their own voluntary admission requirements to promote high quality of the services. Thus, when a person wants to become a member of these professional associations, a real estate agents should undertake a certification procedure which is linked to specific educational and qualification requirements and also requires adherence to a code of conduct. 11
COM(2013) 676 final.
1.2 The goal of the report
Recently, the modernization of the regulation of the regulated professions has been agreed at the European level. According to the Professional Qualifications Directive12 every Member State is obliged to evaluate statutoryprovisionson access toregulated professions.
The Netherlandshascommitted itself to anambitiousapproach ofthe evaluationandwould like to be an exampleforotherMember Statesandto take aleading role. For the purposeofthis
evaluation, the Ministry of EconomicAffairs(EZ) prepared aproject plan(Nov 2013 -March 2016). The first steps of this plan include: (i) to make an inventoryof existingregulated professionsand(ii) to undertake astudy on theeconomicopportunities andeconomic potential ofthe modernization of theregulated professionsin the Netherlands.
This study contributes to the second step of this project plan as it aims to get a better
understanding of the size and economic contribution of regulated professions in the Netherlands. Based on an analysis of available data and a review of the literature, this study provides an indication of the number of professionals which qualify as having a regulated profession. Moreover, we analyse the extent in which these professions are present in different sectors of the Dutch economy, and provide an estimate of their economic importance. Finally, we also provide an indication of the potential benefits that could be achieved if the regulation of Dutch professions is modernised. The scope of the project is limited; our findings should be interpreted as a rough first indication. An in-depth analysis of all regulated professions, including an investigation of various modernisation options, is beyond the scope of this report.
The following research questions are addressed in this study:
1. What percentage of the Dutch economy is covered by regulated professions?
2. Which regulated professions are the most promising in terms of economic benefits to be expected following modernization?
3. What are the expected economic benefits of modernisation of regulated professions over the next 10 years for the Dutch economy?
1.3 Reading guide
The remainder of the report is organized as follows. Chapter 2 starts with an inventory of the regulated professions in the Netherlands. The methodology adopted to estimate the coverage of the regulated professions is discussed and the results are reported. Furthermore, this chapter sheds light on the economic contribution of regulated professions in the Netherlands. Chapter 3
discusses the available literature on the economic impact of the modernisation of regulated professions. As there is limited literature available specifically for regulated professions, we also include literature on services sector liberalisation in this discussion as regulated professions are also service providers. We see the impact of service sector liberalisation as a potential proxy for the economic impact of liberalising regulated professions. Finally, Section 3.4 summarizes the results in terms of economic impact and provides some recommendations for further research.
12
Directive 2005/36/EC on the recognition of professional qualifications.
2 Regulated professions in the Netherlands
As defined in Chapter 1, the regulated professions are those to which access is conditional upon the possession of specific qualifications. Often the use of a specific title is protected and/or there are reserved activities13. There are two types of regulations applicable to the term regulated professions: licencing based on qualifications (the professions are regulated as a whole) and protected titles.14 For example before being able to work as a lawyer (advocaat) one needs to apply to the relevant competent authority (Orde van Advocaten) for admission to professional practice and one needs to have a diploma of post-secondary level (3-4 years).
To the knowledge of authors there is no research conducted on how much regulated professions contribute to the Dutch economy. Therefore, a methodology needed to be developed to estimate the share of regulated professions in the Netherlands. In this chapter we present our approach and conclusions regarding the contribution of the regulated professions to the Dutch economy.
2.1 Introduction of the methodology applied
Before we analyse the economic importance and impact of regulated professions, we present an overview of our methodology. The details of this methodology and the results are elaborated in the remainder of this chapter.
To the knowledge of authors, there is no central data on numbers of people working in regulated professions15. There are data available by broad occupational groups. We have matched this data with information on the regulated professions (top-down approach16). The data by broad
occupational groups, however, may include non-regulated professions besides the regulated professions. The extent to which non-regulated professions are included in the data by broad occupational groups is however not known. Therefore, the top-down approach gives an upper-bound estimate of the number of regulated professionals.
Besides the matching with broad occupational groups we have also looked at how many people are registered in a certain profession (bottom-up approach) but this information is only available for some occupations. Moreover, in cases where it is likely that a regulated profession does not cover the whole occupational group, we made a rough estimate of their likely share (see Chapter 2.3 for details on the methodology used). The detailed results of both the top-down and bottom-up approaches can be found in the Annexes of this report.
By combining the information from these two sources, we are able to present a lower and an upper bound of employment of regulated professionals and from that we calculate the boundaries of the share of regulated professionals in the economy. This is also due to the fact that there is no data on the exact number of regulated professionals available. As the bottom-up numbers include more information, we see the bottom-up estimates the more realistic ones. However, the top-down estimates do have the advantage that they are directly linked to official statistics.
13
We follow the definition of a regulated profession as it is specified in Directive 2005/36/EC as it quoted in Chapter 1. 14
The categorization of the regulated professions by the type of the regulation is outside the scope of this study. 15
This is also mentioned in another recent study: Koumenta et al. (2014). 16
More on the top-down approach is explained in Chapter 2.3 ( Step 2).
Below we describe the steps we took in order to calculate the economic importance of the regulated professions measured by the share in employment (based on top-down and bottom-up
approaches), the share of GDP and the impact on other sectors. The main steps are: 1. Identifying regulated professions in the Netherlands;
2. Matching the regulated professions with ISCO-codes; 3. Analysing the share of the regulated professions by sector; 4. Calculating the economic contribution of the regulated professions.
Below we elaborate on each of these steps and also present the results of each step.
2.2 Step 1. Identifying regulated professions in the Netherlands
In order to identify the regulated professions in the Netherlands we have gathered information from the following sources17:
• Regulation determining the list from regulated professions by the Dutch Ministry of Education, Culture and Science18;
• Current list of regulated professions compiled by the Dutch Ministry of Economic Affairs;
• The database of regulated professions maintained by the European Commission, DG MARKT19 that falls under the Directive of the European Parliament and the Council concerning the recognition of professions qualifications20;
• The website of Nuffic specifying the regulated professions and the competent authority21. In the Netherlands the number of regulated professions is around 16722 in 2014. Compared to other countries, the Netherlands is somewhere in the middle in terms of the number of regulated
professions. For example, there are more than 300 regulated occupation in Czech Republic, Slovenia and Poland but less than 100 in Finland and France23. However, it should be noted that the number of regulated professions is difficult to compare internationally, as this depends on the definitions and way of aggregation of the different professions. Moreover, the number of regulated professions in itself does not say anything about the way the are regulated. Regulation can for example consist of licensing based on qualifications, protected titles, or mandatory certification, with different economic effects. If professions are only relatively lightly regulated in one country, the economic impact of the regulation may be smaller than in another country even though the number of regulated professions in the former country is higher than in the latter.
2.3 Step 2. Matching the regulated professions with ISCO-codes
In order to estimate the number of workers with a regulated profession we match the regulated professions in the Netherlands with the occupations specified in the International Standard
Classification of Occupations, ISCO-08 code (up to four digits). The full list is presented in Annex 2. This classification does not provide an exact match with the professions as some of the data are only available by broad occupational groups. This means that the occupations identified in the ISCO classification may include non-regulated professions besides the regulated professions. This
17
Due to the fact that during the implementation of this study the list of regulated professions has been revised, we use those professions that were already included in lists prior to the beginning of the study.
18 http://wetten.overheid.nl/BWBR0023396/geldigheidsdatum_15-02-2014. 19 http://ec.europa.eu/internal_market/qualifications/regprof/. 20 http://eur-lex.europa.eu/LexUriServ/LexUriServ.do?uri=OJ:L:2005:255:0022:0142:nl:PDF. 21 http://www.nuffic.nl/diplomawaardering/beroepserkenning/gereglementeerde-beroepen-en-bevoegde-autoriteiten. 22
However, the profession ‘Gastouder in de kinderopvang’ is regulated, we could not match it to the classification of sectors like NACE of second revision.
23
http://ec.europa.eu/internal_market/qualifications/docs/news/20120214-report_en.pdf.
could result in an overestimation of the number of regulated professionals. Therefore, in our bottom-up calculations we make corrections in cases where overestimation is evident (see below). The top-down estimates should therefore be seen as an upper-bound in the study.
For example, the ISCO classification identifies the profession of a field crop and vegetable grower while in the Netherlands there are at least two regulated professions that fall under this category (Beheerder landbouwspuitbedrijf; Uitvoerder gewasbescherming). In case of the mechanical engineering technicians, there is only one profession that is regulated in the Netherlands (Lpg-technicus) while ISCO code clearly includes more occupations. Therefore, the two types of
classifications do not always match. In general, it is likely that using the ISCO classification leads to an overestimation of employment in regulated professions, as some categories may also include professions which are not regulated in the Netherlands.
After assigning the ISCO codes to the regulated professions in the Netherlands, the regulated professions were matched with the European Labour Force Survey24. As a result of this step we obtained the data on employment by occupation (top-down approach).
Since the data in the Survey is at the level of broad occupational groups, we (whenever possible) also collected data on employment gathered by associations where regulated professionals work25 (bottom-up approach of data collection). For example, for the education sector we used the DUO database26, while for the health sector we used the BIG register27, for other sectors we used other registers for smaller sectors2829. Here we assumed that people who have registered themselves as a regulated professional are actually active in this profession.
For other professions, where is was evident that the top-down numbers would result in an overestimation, we made a rough assessment of the share of employees in the regulated professions as part of the occupational group reported in the European Labour Force Survey. As we do not have detailed information on the composition of employment in each sector, we had to make a subjective estimate based on the description of the categories. For example, as the Dutch regulated profession “Installateur alarmapparatuur” is very specific, we assumed that only 5% of employment in the sector “Building and related electricians” can be attributed to people who install alarm installations. Where we thought it to be likely that no non-regulated professions are present in a certain sector, we assumed 100% of the employment in that sector to be regulated. In other cases, where a professions was not too specific but was deemed unlikey to cover 100% of employment in a certain sector, we allocated 50% of employment to the regulated profession. In this way, all the sectors were assessed, allocating either a 5%, 50% or 100% share of employment to regulated professions (see Annex 2 for the choices made)30.
As a result a lower-bound of the bandwidth is calculated for share of the regulated professions in employment, which are reported as our bottom-up estimates. Although the classification is somewhat arbitrary, we think this is a more useful approach than simply assuming that 100% of employment in a sector is a regulated profession, as implicitly assumed in the top-down approach.
24
It is a dataset, a large household sample survey providing data on labour participation of employees and self-employed aged 15 and over, living in private households. It is available in Eurostat.
25
Most of the corresponding registers are not accessible for public and the data in some registers is not always up-to-date. 26
http://www.duo.nl/organisatie/open_onderwijsdata/databestanden/default.asp. 27
https://www.bigregister.nl/. 28
The list of registers is available on the website https://www.cibg.nl/productenendiensten/. 29
From now on we use the term bottom-up approach when data collected from the associations on the number of regulated employees; and top-down approach when data was (also) collected on the sector level.
30
This is also part of a bottom-up approach.
2.4 Step 3. Analysing the share of the regulated professions by sector
As mentioned earlier, to the knowledge of the authors there is no research conducted on how much regulated professions contribute to the Dutch economy, therefore we first theoretically identify the channels through which the professionals might affect the economy and then we estimate the share of the regulated professions in the economy by sector.
How can regulated professions affect the economy?
The regulated professions might have an impact on the economy in a number of ways. First of all, the presence of regulated professions might have an impact on the structure and the size of the market. Since an individual needs to obtain a certain educational degree this could be perceived as an entry barrier. In that case, the number of suppliers of services might be restricted, thus limiting the competition on the market. For some professions, there are also limits to the number of
students that are allowed to enrol in educational programmes (e.g. surgeons). The regulated nature of these professions could also lead to reduced possibilities of firms to experience economies of scale due to the decreased range of services that could be offered compared to the situation when a market does not have any entry restriction.31 Another potential effect that the regulated
professions have is on the sectoral competitiveness. Since there are entry barriers, there is a risk that the regulations might have a negative impact on the growth and productivity of a sector if these regulations are more restrictive than necessary to achieve public objectives.32
Any economic effects arising from the regulated professions are not limited only to the sectors where those professions are active. There will also be spillover effects on other sectors which use the services of the regulated professionals. These spillovers effects are also called a “multiplier effect” on other sectors resulting from the use of these services in other sectors. In this way, the economic performance of regulated professions can have a much broader influence than just in the “own” sectors of regulated professions. The competitiveness of the whole economy can in principle be influenced.33
How big is the share of the regulated professions in the Netherlands?
In order to empirically estimate the contribution of regulated professions to the Dutch economy, we first map the regulated professions with the sectors using the data gathered in the steps before and match this with the list of Dutch sectors in the economy that we took from Central Bureau of Statistics (CBS, Centraal Bureau voor de Statistiek). The full list of the regulated professions by sector is presented in Annex 2.
The employment figures for every regulated profession collected from European Union Labour Force Survey for the latest year available (annual data, 2012) and information from registers of regulated professions are also matched with the sectors. The n umbers also include the self-employed, such as dentists (tandarts) and general practitioners (huisarts).
31
Sebastian et al. (2007) stress that in the sphere of legal services, conveyancing in the UK was deregulated in 1990. This attracted new players on the market affecting the structure of the market. This has led to innovation in the design of services so that consumers have a wider choice between a full service commonly provided by solicitors, which may include legal advice, and a ‘no-frills’ service provided by low-cost conveyancers that focuses on the administrative process. For example, Sebastian et al. (2007) highlights that due to the deregulation on the regulated professions in the UK there was a reduction in the prices of services. After changes in the regulation of the notarial profession in the Netherlands in 1999 the customer service, innovation, the use of technology, efficiency and customer friendliness have improved. Moreover, the fees of the notaries have fallen substantially by 37.5% resulting in an annual welfare gain to consumers of 347.64 million euro. There has also been a positive increase in the number of notaries (+12%) since 1999 and their employees (+22%). 32
See for example COM(2013) 676 final and OECD (2009). Paterson, Fink, Ogus (2003) did a survey where one of the questions to the respondents was ‘Why regulate professional services?’.
33
See for example OECD (2009).
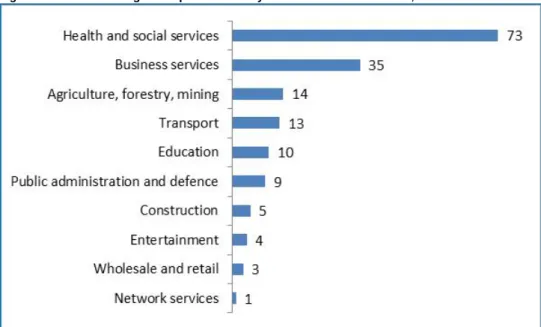
Figure 2.1 Number of regulated professions by sector in the Netherlands, 2014
Source: Database of regulated professions, DG MARKT, EC; Dutch Ministry of Economic Affairs.
When we analyse the number of regulated professions per sector it becomes clear that the sector of health and social services has the most regulated professions in the Netherlands, with 73 regulated professions out of a total of 167, or 44% of the regulated professions (see Figure 2.1). Business services (20%), agriculture, forestry and mining (8%) follow as they have less regulated professions in terms of employees. Wholesale and retail sector and entertainment sectors have few regulated occupations within the sector (4 and 3 respectively). There is only one regulated
profession in the network services.
Figure 2.2 Employment of regulated professionals by sector, 2012
Source: European Union Labour Force Survey, Eurostat, Ecorys calculations.
Note: the data for the sector Entertainment are not reported due to the fact that the employment figures are below 2500 people.
The employment of regulated professionals by sector (Figure 2.2) differs by approach, where the top-down estimates provide an upper bound and the bottom-up numbers provide a more realistic lower-bound indication. According to the top-down approach, more than 500.000 people in the
health and social services sector have a regulated profession, with business services and education following with 311.000 and 230.00 regulated professionals respectively. Employment of regulated professionals is significantly lower in other sectors. Adding up all the regulated
professionals leads to a top-down estimate of 1.4 mln persons, which represents 15.6% of the total employment within the Dutch economy. This is an overestimation of the total number of employees within the regulated occupations as we matched it in some cases to broader categories of
occupations. Figure 2.2 also shows that the bottom-up estimates are significantly lower than the top-down estimates, but the “ranking” of sectors in terms of regulated professionals hardly changes. Health and social services again has the highest “regulated employment”, followed by education and business services. Adding up all the employment numbers leads to a grand total of almost 828 thousand people (9.5% of total employment in the Netherlands) that work in a regulated profession according to the up approach. Figure 2.3. shows the results for both top-down and bottom-up in terms of the shares in total employment in the Netherlands.
Figure 2.3 Share of the regulated professionals by sector as a percentage of the total employment in the Netherlands, 2012
Source: European Union Labour Force Survey, Eurostat, Ecorys calculations.
Note: the data for the sector Entertainment are not reported due to the fact that the employment figures are below 2500 people.
2.5 Step 4. Calculating the economic contribution of the regulated professions
The contribution of the regulated professionals to the whole economy of the Netherlands can be measured in terms of the goods and services that are produced. In order to estimate the economic importance of the regulated professions we use an input-output model, which captures the interlinkages of the sectors in the economy. The purpose is to show how the output of a regulated profession in one sector may indirectly affect other sectors through their use of inputs. This is called a so-called input-output model.
Input-Output model
An Input-Output model can be used to determine the impact on the economy caused by a one euro change in final demand for any given sector. Goods and services produced in one sector are consumed by the sector itself and other sectors, thus they are the intermediate inputs for other sectors. Sectors, providing goods and services for consumption, also purchase goods and services from other producers. Thus the change in the demand from one sector can affect the production of
the sector itself (this is a so called direct effect) and can affect the production of other sectors (this is a so called indirect effect of the change in demand in the original industry).
To estimate the relative importance of the regulated professions in the Netherlands we use an input-output model of the Dutch economy. The model is based on CBS data on purchases and sales of goods and services in each sector of the economy. The data is obtained from CBS34. Input-Output table for 2012, the latest available data, is based on basic prices according to SBI (Standaard Bedrijfsindeling) 2008 classification. The SBI 2008 classification is based on the activity classification of the European Union NACE (Nomenclature statistique des activités économiques dans la Communauté Européenne, NACE) and on the classification of the United Nations
(International Standard Industrial Classification of All Economic Activities, ISIC). We use the data of up to four digits which coincide with the first four digits of NACE Revision 2.
Before we start calculating the economic impacts of the regulated professions in the Dutch economy, we estimate how much the regulated professions contribute to the total production of a sector they are matched to.
The following steps were taken in order to do so:
1. Collection of the data on wages in the sector. The sector level data was obtained from CBS. This enables us to calculate the total wage income share in the sector;
2. Calculation of part-time factor in the sector based on the data on the number of persons employed in the sectors and the labour years. We assume that it is the same for the whole sector as for the regulated professions;
3. Collection of the data on the wages of the regulated professionals in the Netherlands. The average wages for every regulated professions were collected from Loonwijzer
(www.loonwijzer.nl), which is a wage indicator survey with more than 17,000 professions listed. The average wage was calculated as a wage of a professional with fifteen years of experience, assuming that the data from Loonwijzer is representative. We consider this a reasonable approximation of the wage of a professional as we use the relatively higher wages of people with fifteen years of experience, corresponding to the notion that the regulated professions are relatively well paid. The wages of professions related to the maritime sector like ship’s deck officer (stuurman) were collected from Ecorys (2009)35. Due to the fact that the data are of several years old we correct for inflation;
4. Calculation of the (wage) income share of the regulated professionals as a percentage of the total (wage) income earned in a sector (see step 1 above). We assume that the share of income earned in production by regulated professionals relative to the total income earned in a sector is the same as the share of the (wage) income of regulated professionals.
The steps above result in the next overview in table 2.1.
34
Centraal Bureau voor de Statistiek. 35
Ecorys (2009), Final report ‘Study on the Labour Market and Employment Conditions in Intra-Community Regular Maritime Transport Services Carried out by Ships under Member States’ or Third Countries’ Flags’ for EC, Directorate-General Energy and Transport.
Table 2.1 Overview of the sectors and their contribution to the economy Sector Value added (mln euros) Share of regulated professionals in the employment of the sector (top-down approach) Share of regulated professionals in the employment of the sector (bottom-up approach) Income share of the regulated professions in the sector (top-down approach) Income share of the regulated professions in the sector (bottom-up approach) Agriculture, forestry and mining 29724 8.0% 0.5% 10.23% 1.12% Business services 44567 22.9% 7.8% 29.58% 9.74% Construction 26551 18.5% 0.9% 17.16% 0.86% Education 27064 48.0% 48.0% 48.44% 48.44% Entertainment 4938 1.3% 0.2% 1.55% 1.03% Financial services 46385 0 0 0 0 Human and social activities 55952 39.4% 27.3% 56.13% 40.27% Manufacturing 67968 0 0 0 0 Network services 40178 2.2% 0.1% 7.92% 0.40% Other services 8883 0 0 0 0 Real estate 31551 0 0 0 0 Tourism 9392 0 0 0 0 Transport 23868 12.9% 0.6% 15.13% 1.58% Wholesale and retail 66890 3.6% 0 0 0.27% Public administration and defence 39194 11.8% 11.2% 12.57% 11.87%
Source: Ecorys calculations.
Knowing the production shares of the regulated professionals in every sector of the Dutch economy we calculate the direct and indirect contribution to the Dutch economy. Again we assume that the so-called input-output relation between and within sectors is the same for regulated professions as it is for the sector as a whole. Thus we calculated the economic contribution of the regulated professions by multiplying the share of the income in production generated by the regulated professionals with the value added generated in the sector.
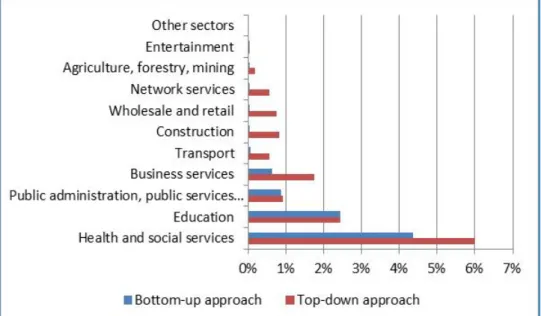
Direct contribution
In Figure 2.4, the direct contribution of regulated professions in each sector is calculated in terms of value added (contribution to GDP). The biggest contribution to Dutch GDP comes from sectors like health and social services, education, public administration, and business services. Health and social services contribute in a range between 4.4% and 6% of the total Dutch GDP, whereas education is around 2,5%. Most other sectors have a direct contribution of below 1% of GDP.
Adding all these impact together results according to the bottom-up approach in a total value added, due to regulated professions, of 45 bln. euros or 8.5% of the GDP. The top-down approach gives a higher result: the total value added, due to the regulated professions, accounts for 75 bln euros or 14% of the GDP.
Figure 2.4. Direct impact of regulated professions, top-down and bottom-up approaches (value added)
Source: CBS and data from associations, Ecorys calculations.
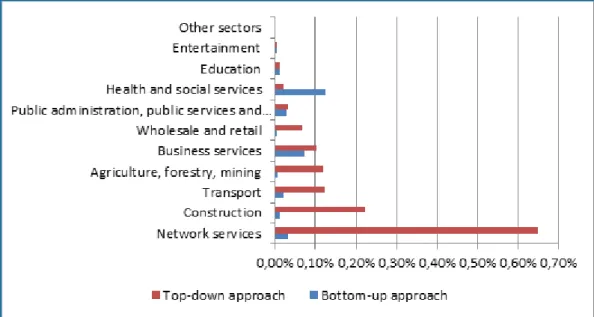
Indirect contribution
For each sector of the economy we calculated, through the input-output model, the linkages (in terms of value added) of regulated professions to other sectors. This analysis is relevant because it shows that reforms of regulated professions can have an important effect on sectors outside the sector where the reforms have taken place, because many sectors use regulated professions as an input for their own production process.
Figure 2.5 shows the size of the calculated indirect effects. According to the top-down approach, the largest (0.65%)indirect contributor is the cluster of sectors network services, which is to a significant extent due to the sub-sector electricity, gas, steam and air conditioning supply. On the other hand, according to the bottom-up approach the spillover effect is relatively small, 0.03% of GDP. This means that one euro generated by the regulated profession in this sector will result in additional value added in other sectors of around 0.01 euros in other sectors. Business services are an important contributor to indirect effects, both from a bottom-up and a top-down perspective (0.07-0.1 % GDP). Another significant contributor to other sectors is the Construction sector, which generates 0.12% of GDP of indirect effects, because the construction sector is an important supplier for other sectors36. For the health and social services sector the results of both approaches are very similar: the spillover effect is in between 0.12% and 0.17% of GDP. Together all regulated professions generate an indirect effect between 1.6 and 7 bln euros that spills over to other sectors, accounting for 0.3 – 1.3% of GDP.
36
This is an average of the range of top-down and bottom-up approaches that the construction sector generates.
Figure 2.5. Indirect impact of regulated professions, top-down and bottom-up approaches (% of GDP)
Source: CBS and data from associations, Ecorys calculations.
2.6 Conclusion
In this chapter we explored the sizes of the regulated professions in the Netherlands in terms of employees and economic contribution to the Dutch economy. Although it is difficult to extract the regulated professions from the regular professions in the existing datasets, this chapter gives a first insight and as a result a first estimation.
At the beginning of this study the Ministry of Economic Affairs identified 167 regulated professions
in the Netherlands. This list with regulated professions was not yet fully updated but the largest professions in terms of number employees were present. The regulated professions are present in 27 sectors of the economy. The number of regulated professions differs a lot among the different sectors.
The exact number of employees in regulated professions is not available in national datasets and also the economic footprint of the regulated professions has so far not been identified. Due to this lack of data we developed a four-step methodology, as presented in this chapter, to estimate the size and economic impact of the regulated professions. As part of this exercise, we matched the ISCO-codes of the regulated professions with the sector SBI-2008 classification. Identification and isolation of all the regulated professions for each sector was not possible within the scope of this study.
To calculate the upper-bound of size and economic impact we assumed that the number of employees in regulated professions is the same as the number of employees reported in Labour Force Statistics. Due to this approach we overestimated the share of the regulated professions within the sector as whole. However from a research perspective this is the most accurate way to identify size and economic impact without making subjective assumptions. As such the calculations presented in the paragraphs above represent the upper-bound calculation.
In order to identify the more likely size and economic impact of the regulated professions we made a rough assessment of the expected share of employees in regulated professions as part of the total sector. For this we made a distinction between shares of 5%, 50% or 100% per sector (see Annex 2 for the choices made). As a result a lower-bound of the bandwidth is calculated for size
and economic impact of the regulated professions. We used the exact same methodology as presented in this chapter, with the difference of estimating the share of regulated professions in number of employees per sector.
Following the presented methodology and keeping in mind that it represents a first exploration of the size and economic footprint we can conclude that the regulated professions cover somewhere between 9.5 and 15.6% of the total employment in the Dutch economy. In which the lower-bound result represents a more realistic calculation and the upper-bound represents a maximum
contribution. The regulated professionals account for 8.8-15.4% value added in the whole economy (including indirect effects). When looking at indirect effects in the Netherlands we see that the regulated professions within health and social services, business services, agriculture, forestry and mining and construction sectors are contributing the most to the Dutch economy through spillovers to other sectors37.
When looking at the economic importance of regulated professions, we conclude that regulated professions represent the largest shares of value added within the health and social services sectors, and the education sector. Given the economic importance of regulated professions in these sectors, it could – as a next step – be interesting to investigate where reforms can or should take place. We note that different criteria can potentially be used to select “promising” sectors for reform. The size and economic importance of regulated professions within a sector is just one of them. A closer study of the regulations and the potential for reform in each sector is required to reach more detailed conclusions.
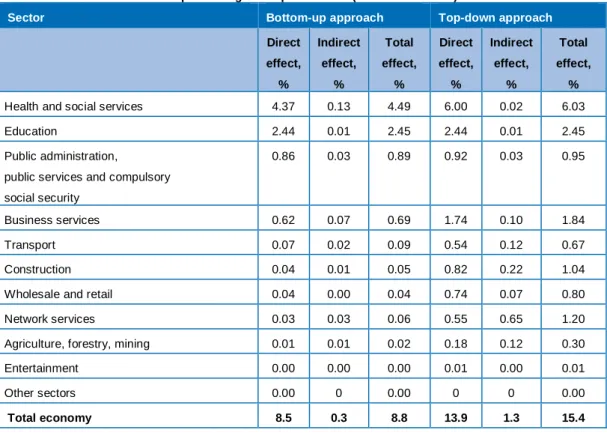
Table 2.2 Direct and indirect impact of regulated professions (% of value added)
Sector Bottom-up approach Top-down approach
Direct effect, % Indirect effect, % Total effect, % Direct effect, % Indirect effect, % Total effect, %
Health and social services 4.37 0.13 4.49 6.00 0.02 6.03 Education 2.44 0.01 2.45 2.44 0.01 2.45 Public administration,
public services and compulsory social security
0.86 0.03 0.89 0.92 0.03 0.95
Business services 0.62 0.07 0.69 1.74 0.10 1.84 Transport 0.07 0.02 0.09 0.54 0.12 0.67 Construction 0.04 0.01 0.05 0.82 0.22 1.04 Wholesale and retail 0.04 0.00 0.04 0.74 0.07 0.80 Network services 0.03 0.03 0.06 0.55 0.65 1.20 Agriculture, forestry, mining 0.01 0.01 0.02 0.18 0.12 0.30 Entertainment 0.00 0.00 0.00 0.01 0.00 0.01 Other sectors 0.00 0 0.00 0 0 0.00
Total economy 8.5 0.3 8.8 13.9 1.3 15.4
Source: Ecorys calculations.
Note: the sum of direct and indirect effects might not be equal to the total effect due to rounding.
37
One more large contributor to other sectors is the public sector in broad sense.
3 Impact of modernising regulated professions
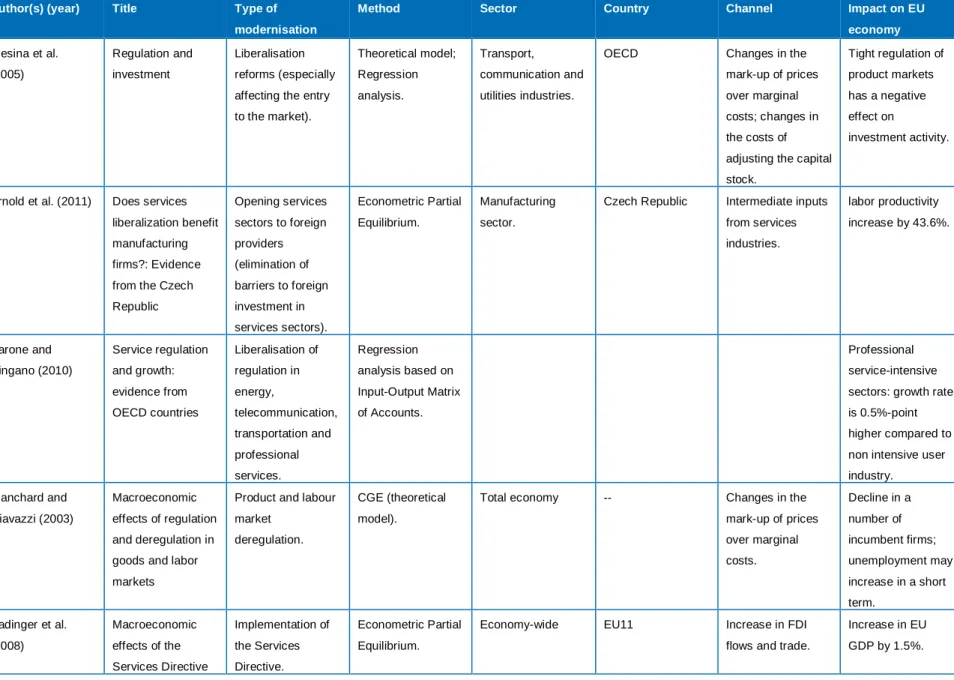
Due to the fact that literature on economic impact of the regulated professions on the total economy is limited, we looked at literature on a broader level, namely at sector level. Since the regulated professions are largely present in the services sectors we first looked at the potential effect of reforms in the services sector and the effects this could have on the economy (paragraph 3.1, 3.2 and 3.3) before estimating its economic effect on the regulated professions for the Dutch economy in the next ten years (paragraph 3.4).
For this purpose we mapped the existing literature with the effects it predicts. We looked at the services sector reform and how it affects the overall economic performance. The reason we look at the services sector is the absence of specific literature on the expected impact of reforming regulated professions. As regulated professions are also services activities, we see this as the best available proxy. Furthermore we looked at literature on the link between the services and
manufacturing industries and how performance of one sector can affect the other. The findings show how the liberalisation/modernisation of the services sector affects the services sector and the whole economy. We use the findings in the literature review as a proxy to identify the expected economic benefits of modernisation of regulated professions over the next 10 years for the Dutch economy. Note that we have not analysed what measures are required to achieve modernisation.
The studies presented in this chapter were selected because they were primarily concerned with an empirical analysis of the effects of policy changes.
3.1 Regulatory barriers
The Single Market in Services is hindered by
A fundamental principle of the European Union is that goods, services, capital and labour can move freely between the Member States38. The internal market for goods seems to function relatively well compared to the internal market in services39. The providers of services experience barriers if they want to export their services to other Member States, or when they want to start a subsidiary company in other EU member states. Services constitute a large and increasing part of the EU economies and are considered to be one of the main determinants of competitiveness and growth40. In 2002 the European Commission41 has concluded that the obstacles in services provision are mainly due to the differences among national regulations for service exporters, foreign investors in services, and for the service product itself mostly focusing on domestic purposes (so called trade barriers). The heterogeneity of national regulations increases trade costs and
investment costs for service providers doing business in other Member States. Recent evaluations of the Member States’ of the regulatory impact on the trade in services (COM, 2011, European Commission, 2012) show that there are national regulatory elements hampering the EU Single Market in services:
• Regulations on required professional qualifications of services-providing personnel;
• Regulations on legal form of the services provider;
• Regulations on capital ownership of the services provider;
• Regulations on required local insurance. 38
http://europa.eu/legislation_summaries/internal_market/index_en.htm. 39
Kox, Lejour, Montizaan (2004). 40
http://ec.europa.eu/commission_2010-2014/president/news/archives/2014/03/pdf/services_en.pdf. 41
COM (2002).
Below we present several indicators that measure the restrictiveness to competition and trade in services and allows to compare the situation in the Netherlands to other countries.
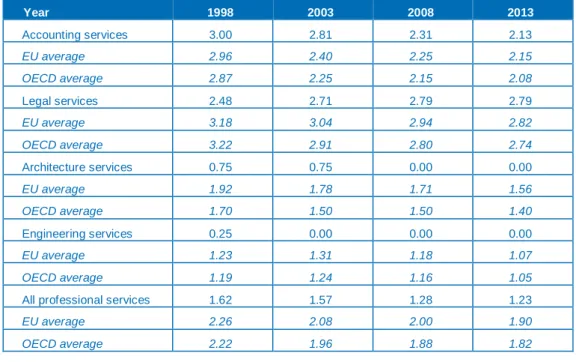
Box 1. Measures of restrictiveness to competition and trade in services in the Netherlands According to this classification, the regulated professions, which are also present in the Netherlands, fall into the category regulations on required professional qualifications of service-providing personnel. The recently developed OECD Trade Restrictiveness Index42 shows that the Netherlands is the least restrictive country among OECD countries in construction, architecture and engineering sectors, where there are no sector specific regulations though there are some professions that are regulated.43 A different OECD indicator is the so called Product market regulation (PMR) index. This set of indicators44 measures the restrictiveness of regulation and shows that the Netherlands scores below average in professional services. This means that regulation in these services is more conducive to competition in the Netherlands than average across OECD-countries. This can be explained by past liberalisation efforts of the
Netherlands over the past 15 years which have resulted in a reduction in the overall score for professional services from 1.62 to 1.23. In engineering and architecture services the Netherlands is considered as one of the countries that is the least restrictive to competition.
Table 3.1 Product market regulation set of indicators for professional services in the Netherlands and OECD countries
Year 1998 2003 2008 2013 Accounting services 3.00 2.81 2.31 2.13 EU average 2.96 2.40 2.25 2.15 OECD average 2.87 2.25 2.15 2.08 Legal services 2.48 2.71 2.79 2.79 EU average 3.18 3.04 2.94 2.82 OECD average 3.22 2.91 2.80 2.74 Architecture services 0.75 0.75 0.00 0.00 EU average 1.92 1.78 1.71 1.56 OECD average 1.70 1.50 1.50 1.40 Engineering services 0.25 0.00 0.00 0.00 EU average 1.23 1.31 1.18 1.07 OECD average 1.19 1.24 1.16 1.05
All professional services 1.62 1.57 1.28 1.23
EU average 2.26 2.08 2.00 1.90
OECD average 2.22 1.96 1.88 1.82
Source: OECD.
Note: OECD average is the average of all OECD countries. EU average is an average among the following 19 countries that are present in the database: Austria, Belgium, Czech Republic, Denmark, Estonia, Finland, France, Germany, Greece, Hungary, Ireland, Italy, the Netherlands, Portugal, Slovak Republic, Slovenia, Spain, Sweden and UK.
42
http://www.oecd.org/tad/services-trade/services-trade-restrictiveness-index.htm. 43
The transport, accounting and legal services sectors seem to be the most restrictive sectors for the trade in services in the Netherlands but still less restrictive than the average of 40 countries investigated. Besides the regulations on required professional qualifications of services-providing personnel43, there are restrictions on the share of foreign equity in transport, accounting and legal services sectors.
44
These indicators aim at measuring the degree to which policy settings promote or inhibit competition in areas of the product market where competition is viable. Thus they represent the stringency of regulatory policy in specific areas on a scale of 0 to 6 where a higher number indicates a policy stance that is deemed less conducive to competition.