Beer Sheva, Israel
Combining AHP and DEA Methods for
Selecting a Project Manager
UDC: 005.22:005.8
DOI: 10.7595/management.fon.2014.0016
1. Introduction
The success of a project depends on several critical success factors. One important factor is supervision by a competent project manager with proven leadership skills (Fortune & White, 2006). In the selection process for a new project manager, his or her past performance should be considered, as should his or her per-sonal and professional skills. If there are several candidates to manage an important project, it is common practice to select the best candidate on the basis of several criteria. Some of the criteria are qualitative and subjective (for example, leadership, technical skills, and teamwork ability),while others are quantitative and can be objectively related to previous projects (for example, completion time, completion cost, and meet-ing the technical requirements). In order to evaluate the past performance of candidates to be the selected project manager their completed projects should be examined. Many criteria can be used to compare the relative performance success of completed projects. Asosheh et al., (2010) discussed about 30 criteria that were reviewed in six papers they surveyed concerning IT project management.
The project manager selection process has been widely discussed in the literature. Hadad et al., (2013) sur-veyed several papers of this topic. Some of those survey results are restated here, in brief. Zavadskas et al., (2008) proposed a set of criteria for the selection of construction managers. El-Sabaa (2001) conducted a survey concerning the skills of successful project managers. Hauschildt et al., (2000) identified five types of project managers. They calculated the prevalence of each type and examined the success levels of project managers, classified to each type. Muller & Turner (2007) claimed that past performance of project managers depends on their competence, particularly their leadership. It can be concluded that the criteria most often taken into consideration are the candidate’s personal skills, project management skills, and experience in similar projects. Cheng et al., (2005) concluded that task competencies are specific to a given project. How-ever, when selecting a project manager one must consider both the past performances of the candidates and their suitability for the specific project. Eilat et al., (2006) stated that project performance evaluation is a multiple-criteria problem. The criteria and their weights must be determined and weighted according to the organization’s preferences.
In selecting a project manager for a specific project his or her certification degree can be taken into account. It is common to assume that a project manager with a high level of certification is more competent than an uncertified project manager. There are several international associations that propose certification programs for project managers. For example, the project management institute (PMI) offers a certification program for
A project manager has a major influence on the success or failure of the project. A good project manager can
match between the strategy and objectives of the organization and the goals of the project. Therefore, the
se-lection of the appropriate project manager is a key factor for the success of the project. A potential project
man-ager is judged by his or her proven performance and personal qualifications. This paper proposes a method
to calculate the weighted scores and the full rank of candidates for managing a project, and to select the best
of those candidates. The proposed method combines specific methodologies: the Data Envelopment Analysis
(DEA) and the Analytical Hierarchical Process (AHP) and uses DEA Ranking Methods to enhance selection.
project practitioners of all education and skill levels. There are currently six credentials available (PMI, 2014). Another example is the international project management association (IPMA) that developed a 4-level system for project managers certification (IMPA, 2014). Level A is Certified Projects Director – one that manages plex project portfolios and programs. Level B is Certified Senior Project Manager – one that manages com-plex projects with a minimum of five years of experience. Level C is Certified Project Manager – one that manages projects of moderate complexity with a minimum of three years of experience. Level D is Certified Project Management Associate – one that applies project management knowledge when working on projects.
This paper is an expansion of the decision-making support system (DMSS) that was proposed by Hadad et al., (2013). The DMSS of Hadad et al., (2013) used only objective criteria in order to rank a group of candi-dates. This paper proposes to use the scores that each project obtains by the previous DMSS, as an input to a revised DMSS, and to use those results in combination with other qualitative and subjective criteria to obtain a full rank of the candidates.
The revised DMSS combines two well-known methodologies: Data Envelopment Analysis (DEA) (Charnes et al., 1978) and the Analytical Hierarchical Process (AHP) (Saaty, 1980). Moreover, the DMSS uses a rank-ing method in the context of the DEA (see Adler et al., 2002, Hadad & Hanani, 2011). Combinrank-ing the AHP with the DEA can be found for example in: Sinuany-Stern et al., (2000); Hadad & Hanani (2011); Hadad et al., (2013); Yang & Kuo (2003), and others.
The paper is structured as follows: in section 2, a literature review and basic models are presented. Section 3 details the candidates ranking; in section 4 a real-life case study is described, and the final part of the paper is a summary.
2. Literature review
This section introduces the two well-known methodologies that are at the basis of the proposed model, the Data Envelopment Analysis (DEA) and the Analytical Hierarchical Process (AHP). The DEA evaluates the rel-ative efficiency of Decision-Making Units (DMUs) and the AHP converts qualitrel-ative evaluations into quanti-tative criteria. Furthermore, this section introduces ranking methods in the DEA context that can be used to rank the project managers.
2.1 Data Envelopment Analysis (DEA)
The DEA (CCR model) was first developed by Charnes et al., (1978). The DEA is a non-parametric method that uses multiple inputs and outputs to evaluate the relative efficiency of DMUs. It is a tool that is widely used in the private and public sectors, and provides a mechanism for measuring an identified DMU efficiency (in our case, the project), compared with other DMUs. Surveys of DEA applications can be found in Seiford (1996) and in Emrouznejad et al., (2008). There are also many papers that use the DEA for comparing proj-ect efficiency (for example, Vitner et al., 2006; Eilat et al., 2006; Mahmood et al., 1996, Hadad et al., 2013, and Hadad & Keren, 2013).
The DEA measures the relative efficiency score as a ratio between weighted output and weighted input. The
DEA calculates for each DMU kthe ideal weights for each output- , and the ideal weights
for each input- , thereby maximizing its relative efficiency score under the restriction that this score is bound by 100% efficiency. The weights vary from DMU to DMU. If a DMU with its ideal weights receives an efficiency score of 100%, it is efficient, while a score of less than 100% is considered inefficient.
Consider n projects, where each project j (j=1,…,n) is characterized by m input types
Where is an infinitesimal number.
The CCR model assumes that the production function exhibits Constant Returns To Scale (CRTS). The re-sults of the CCR output-maximized formulation are identical to the CCR input-minimized rere-sults (Adler et al., 2002).
2.2 Analytical Hierarchical Process
The Analytical Hierarchical Process (AHP) methodology was developed by Saaty (1980). The AHP method-ology is used to quantify the value of qualitative or subjective criteria. The AHP has been widely used in real-life applications (see a survey in Zahedi 1986, Vaidya & Kumar 2006, Hadad & Hanani, 2011). In our case each project manager is evaluated according to several criteria, not all of them quantitative. The output of the AHP is shown by numeric scores of each project manager in each qualitative or subjective criterion. The input of the AHP is a pairwise comparison matrix for every pair of project managers, for each qualitative or subjective criterion that is created by the decision makers. A common scale of values for pairwise comparison ranges from 1 (indifference) to 9 (extreme preference). The pairwise comparcomparison matrix
-has an element , and each element in the matrix is strictly positive
- . For nproject managers and mcriteria, the number of
compar-isons to be carried out is According to Saaty’s definition, the
eigen-vector , of the maximal eigenvalue of each pairwise comparison matrix, is utilized for ranking the project managers. For more detail about AHP methodology see Saaty (1980, 1986, 1990). The AHP has been widely used in real-life applications (see a survey in Hadad & Hanani, 2011).
Saaty (1980) defined a statistical measure to test the consistency of the respondent. The statistical
meas-ure of the consistency index ( ) is:
, and the Consistency Ratio (CR) is given by:
,
where:
- is the maximal eigenvalue of the matrix, - is the number of rows/columns of the matrix,
- is the random index. It is the average of the for a large number of randomly generated matrices.
The values of can be found in the table developed by Saaty (1980, p.51).
The consistency of the decision makers can be checked by the value of . Generally, if the is 10% or less, the respondent is considered consistent and acceptable, and the computed comparison matrix can
be used (Saaty, 1980). If the is higher than 10%, the respondent is not consistent and his or her pair-wise estimations must be corrected.
2.3 Ranking methods
There are many different methods for ranking DMUs within the DEA context (for reviews see Adler et al., 2002, Hadad & Hanani, 2011). The following sub-section presents two of them.
2.3.1 The Super Efficiency method
One drawback of the DEA methodology is that it does not rank efficient DMUs (those with efficiency scores of 1). To overcome this drawback Anderson & Peterson (1993) proposed the Super efficiency ranking method. They suggest allowing the efficient DMUs to receive a score higher than 1 by dropping the constraint that bounds the score of the evaluated efficient DMU to 1. The Anderson & Peterson formulation for the DMUk is follows:
2.3.2The Cross Efficiency method
Another drawback of DEA methodology is that it does not use common weights while evaluating the effi-ciency of DMUs. To overcome this drawback Sexton et al., (1986) proposed the Cross Effieffi-ciency (CE) rank-ing method. This subsection presents the steps in usrank-ing the CE to set the score of each DMU.
Step 1 – Find the optimal weights and
by the CCR model.
Step 2 – Calculate the elements of the cross-evaluation matrix as follows:
.
Thus, represents the efficiency given to DMU in the CCR run of DMU (the efficiency of DMU
by the optimal weights of DMU ).
Step 3 -Calculate the score for each DMU as follows:
(3)Step 4 –Rank the DMUs according to the scores , . The DMU with the highest score will be ranked first, and so on.
2.4 Inputs and outputs for ranking projects
Many quantitative criteria can be used to compare the relative performance of completed projects. The de-cision makers must determine the appropriate criteria for project evaluation and how those criteria can be measured, bearing in mind that they should reflect the organization’s objectives and the project types. In order to use the ranking method in the DEA context, the criteria must be classified into inputs and outputs. Hadad et al., (2013) proposed the following inputs and outputs:
Input 1 - The cost stabilization coefficient of project .
, where
- the expected cost of the -th project.
- the standard deviation cost of the -th project.
- the coefficient of variation (Levy & Sarnat, 1995).
Input 2 - The completion time stabilization coefficient of project .
Input 3 - The reciprocal of the intensity of project .
(4)
(5)
Output 1- The ratio between the expected cost and the actual cost of project .
Where represents the implementation expenses of the -th project.
Output 2- The ratio between the expected and the actual completion time of project
Output 3- The ratio between the actual cost, excluding implementation expenses, and the implementation
expenses of project .
Where represents the implementation expenses of the -th project.
Output - The ratio between the actual completion time, excluding the implementation duration, and the
im-plementation duration of project .
3. Candidate ranking
This section presents the steps of the proposed method that enables a full ranking of the candidates. The ranking is carried out according to the average scores of the projects that each project manager performed in the past, and according to the scores of his or her personal qualitative criteria.
Step 1: Define the candidates to be evaluated. For each candidate , determine the
proj-ects that will be used for candidate ranking . is the number of projects according to
which the candidate will be evaluated.
Step 2: Calculate for each project the input and output values according to equations , re-spectively.
Step 3: Select one of the ranking methods (section 2.3) and compute the level of performance, , for
all the projects , . For the Anderson & Peterson ranking method use
equation (2) to compute . For the CE ranking method use equation (2) to calculate the optimum weights
and then use equation (3) to compute .
Step 4: The average level of past performance of candidate is calculated as follows:
(7)
(8)
, (9)
(10)
Step 5: Determine the qualitative personal criteria according to which the candidates will be evaluated. For
each criterion , perform pairwise comparisons according to AHP methodology and create
a pairwise comparison matrix . Calculate for these matrixes and the consistency ratio . If
, go to the next step. If not, the pairwise comparison must be modified.
Step 6: Calculate the normalized eigenvector of the maximum eigenvalue .
The elements of this vector, , represent the score of candidate in criterion .
Step 7: Determine the relative weights, for all the criteria (qualitative and
quan-titative). Note that there are criteria that represent the qualitative attributes of the candidate and one quantitative criterion that represents his or her past performance level. The relative weights can be set di-rectly by the decision makers, either subjectively by the AHP, or objectively by the DEA.
Step 8: The final score of each candidate, , is the weighted score he or she obtained for all the crite-ria. This score is calculated as follows:
Step 9: Rank all the candidates by . The candidate with the highest is ranked first, and so on.
4. The case study
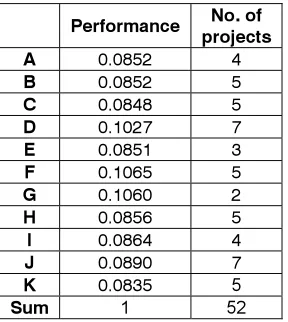
This section presents a real-life case study that demonstrates the applicability of the proposed method. The raw data of the level of performance are taken from Hadad et al., (2013). In this case study there are 11 can-didates (A,B,…,K) that together performed 52 projects in the past as illustrated in Table 1. Hadad et al., (2013) calculated the score of each of the 52 projects by the CE ranking method. Here the performance level for each project manager is calculated as the average scores of the CE data of his or her projects. The performance score is normalized in order to obtain a sum of the scores that will equal1. The results are given in Table 1.
Table 1: Level of performance
(12)
Performance projectsNo. of A 0.0852 4
B 0.0852 5
C 0.0848 5
D 0.1027 7
E 0.0851 3
F 0.1065 5
G 0.1060 2
H 0.0856 5
I 0.0864 4
J 0.0890 7
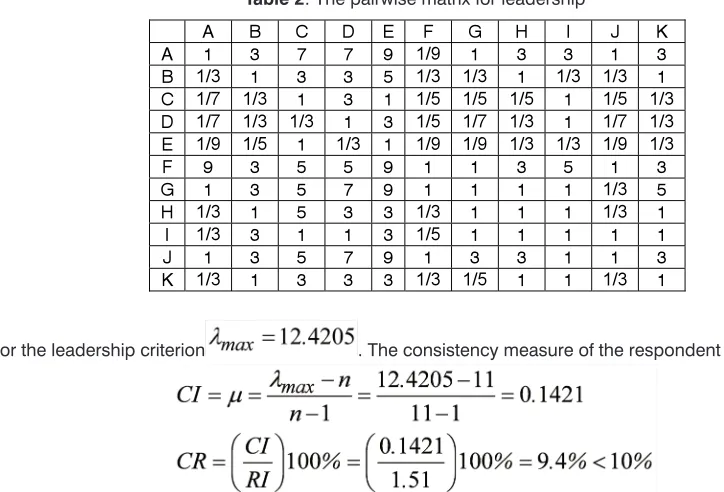
Beyond the level of performance, the decision maker decided to take into account three qualitative criteria: leadership, technical skills and the level of certification in order to improve the ranking of the candidates. Here are the pairwise matrices (Table 2 and Table 3) for the qualitative criteria.
Table 2: The pairwise matrix for leadership
For the leadership criterion . The consistency measure of the respondent is:
Hence, the respondent can be considered consistent, and the comparison matrix can be used. The lead-ership score of each project manager is calculated by the following normalized eigenvector:
Table 3: The pairwise matrix for technical skills
For the technical skills criterion . The consistency measure of the respondent is:
A B C D E F G H I J K
A 1 3 7 7 9 1/9 1 3 3 1 3
B 1/3 1 3 3 5 1/3 1/3 1 1/3 1/3 1 C 1/7 1/3 1 3 1 1/5 1/5 1/5 1 1/5 1/3 D 1/7 1/3 1/3 1 3 1/5 1/7 1/3 1 1/7 1/3 E 1/9 1/5 1 1/3 1 1/9 1/9 1/3 1/3 1/9 1/3 F 9 3 5 5 9 1 1 3 5 1 3
G 1 3 5 7 9 1 1 1 1 1/3 5
H 1/3 1 5 3 3 1/3 1 1 1 1/3 1
I 1/3 3 1 1 3 1/5 1 1 1 1 1
J 1 3 5 7 9 1 3 3 1 1 3
K 1/3 1 3 3 3 1/3 1/5 1 1 1/3 1
A B C D E F G H I J K
A 1 3 3 1 3 3 3 1 1/3 1 1/3
B 1/3 1 3 1/3 1 1 1 1/3 1/9 1/3 1/9 C 1/3 1/3 1 1/7 1/3 1/3 1 1/5 1/9 1/3 1/9
D 1 3 7 1 3 3 3 1 1/3 1 1/3
E 1/3 1 3 1/3 1 1 1 1/3 1/9 1/3 1/9 F 1/3 1 3 1/3 1 1 3 3 1/9 1/9 1/9 G 1/3 1 1 1/3 1 1/3 1 1/3 1/9 1/3 1/9
H 1 3 5 1 3 1/3 3 1 1/9 1/3 1/3
I 3 9 9 3 9 9 9 9 1 9 3
J 1 3 3 1 3 9 3 3 1/9 1 1
Hence, the respondent can be considered consistent, and the comparison matrix can be used. The techni-cal skills and the score of each project manager are techni-calculated by the following normalized eigenvector:
In general, the candidates may have official certifications from different national or international associa-tions, and different levels of certification (for example, level A or level D of IMPA certification). In our case the candidates were classified into three groups: the first group includes candidates without certification (score 1), the second group includes candidates with basic certification (score 2), and the third group includes candidates with expert certification (score 3) in project management. The scores of the certification levels were normalized and presented in Table 4. Table 4 summarizes the normalized scores of leadership, tech-nical skills, performance level and certification level for each project manager.
Table 4: The normalized scores of each project manager
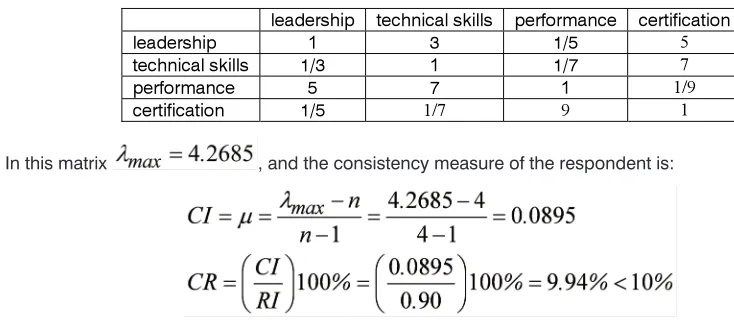
In order to calculate the final score of each project manager the decision makers should determine the
rel-ative weights, , for all the criteria. In our case these weights were determined by the AHP. Table 5 is the pairwise matrix for the three criteria as set by the decision makers.
Table 5: The pairwise matrix for the criteria
In this matrix , and the consistency measure of the respondent is:
Hence, the respondent can be considered consistent, and the comparison matrix is applicable. The weight of each criterion is calculated by the following normalized eigenvector:
. manager leadership technical skills performance certification
A 0.1397 0.0760 0.0852 0.05 B 0.0545 0.0283 0.0852 0.05 C 0.0299 0.0180 0.0848 0.10 D 0.0261 0.0820 0.1027 0.05 E 0.0165 0.0283 0.0851 0.10 F 0.2496 0.0426 0.1065 0.10 G 0.1309 0.0230 0.1060 0.15 H 0.0674 0.0573 0.0856 0.05 I 0.0684 0.3425 0.0864 0.10 J 0.1628 0.1107 0.0890 0.10 K 0.0541 0.1912 0.0835 0.15
leadership technical skills performance certification
leadership 1 3 1/5 5
technical skills 1/3 1 1/7 7
performance 5 7 1 1/9
Conclusion
The final score of each candidate is the weighted score he or she obtained in all the criteria. The normalized final scores and the ranks of the candidates are presented in Table 6. One can see that F is the most suit-able candidate to be selected as project manager.
Table 6:The final score and the rank of candidates
REFERENCES:
[1] Adler, N., Friedman, L. and Sinuany-Stern, Z. (2002), Review of ranking methods in the DEA context. Eu-ropean Journal of Operational Research, 140(2), 249–265.
[2] Anderson, P. and Peterson, N.C. (1993), A Procedure for ranking efficient units in DEA. Management Sci-ence, 39(10), 1261–1264.
[3] Asosheh, A., Nalchigar, S. and Jamporazmey, M. (2010), Information technology project evaluation: An integrated data envelopment analysis and balanced scorecard approach. Expert Systems with Applica-tions, 37(8), 5931-5938.
[4] Charnes, A., Cooper, W.W. and Rhodes, E. (1978), Measuring the efficiency of decision making units. Eu-ropean Journal of Operational Research, 2(6), 429–444.
[5] Cheng, M.I., Dainty, A.R.J. and Moore, D.R. (2005), What makes a good project manager? Human Re-source Management Journal, 15(1), 25–37.
[6] Eilat, H., Golany, B. and Shtub, A. (2006), R&D project evaluation: An integrated DEA and balanced scorecard approach. Omega, 36(5), 895-912.
[7] El-Sabaa, S. (2001), The skills and career path of an effective project manager. International Journal of Project Management, 19 (1), 1-7.
[8] Emrouznejad, A., Barnett, R. P. and Tavares, G. (2008), Evaluation of research in efficiency and produc-tivity: A survey and analysis of the first 30 years of scholarly literature in DEA, Socio-Economic Planning Sciences 42, 151-157
manager score rank
F 1 1
I 0.9152 2
J 0.8428 3
G 0.7922 4
K 0.7345 5
A 0.7322 6
D 0.6272 7
H 0.5915 8
B 0.5371 9
C 0.4995 10
E 0.4890 11
This paper proposes a method that uses the DEA and AHP methodologies, together with the ranking method, for select-ing the best candidate for managselect-ing a project. The proposed method allows calculatselect-ing the weighted score and the rank of each candidate according to quantitative and qualitative criteria. It is important to select the appropriate criteria for the ranking because the selected criteria have influence on the final rank. The values of the criteria (quantitative and qualita-tive) are based on the past performance of the candidates. Therefore, this method is applicable only in case of experienced candidates. The proposed method can be used in project-oriented organizations such as building companies and soft-ware companies, where all projects have similar characteristics.
The limitation of the proposed model is that it is applicable only to experienced project managers and only in the cases where full data of past projects are available. Another limitation is that it needs subjective evaluations that must be carried
[9] Fortune, J. and White, D. (2006), Framing of project critical success factors by a systems model. Inter-national Journal of Project Management, 24(1), 53-65.
[10] Hadad, Y & Keren, B. (2013), Decision support model for ranking project network activities based on multiple criteria of precedence, duration, and cost International. Journal of Engineering Management and Economics, 4(1), 1-17.
[11] Hadad, Y. and Hanani, Z.M. (2011), Combining the AHP and DEA methodologies for selecting the best alternative. International Journal of Logistics Systems and Management, 9(3), 251- 267.
[12] Hadad, Y., Keren, B. and Hanani, Z.M. (2013), Hybrid methods for ranking DMUs that combine per-formance and improvement trend over successive periods. Int. J. Logistics Systems and Management, 16(3), 269-287.
[13] Hadad, Y., Keren, B. and Laslo, Z. (2013), A decision-making support system module for project man-ager selection according to past performance. International Journal of Project Management, 31(4), 532-541.
[14] Hauschildt, J., Gesche, K. and Medcof, J.W. (2000), Realistic criteria for project manager selection and development. Project Management Journal. 31(3), 23-32.
[15] IPMA (2014), IPMA Four Level Certification, available online at
http://ipma.ch/certification/competence/4-l-c-features/ (accessed 19 June 2014).
[16] Levy, H., Sarnat, M. (1995), Capital Investment & Financial Decisions, Prentice-Hall, Englewood Cliffs, New Jersey.
[17] Mahmood, M.A., Pettingell, K.J. and Shaskevich, A.I. (1996), Measuring productivity of software proj-ects: A data envelopment analysis approach. Decision Sciences, 27(1), 57–80.
[18] Muller, R. and Turner, J.R. (2007), Matching the project manager's leadership style to project type. In-ternational Journal of Project Management, 25(1), 21-32.
[19] PMI (2014), The PMI Certification, available online at http://www.pmi.org/Certification.aspx (accessed 19 June 2014).
[20] Saaty, T.L. (1980), The Analytic Hierarchy Process, Planning Priority Setting Resource Allocation. Mc-GraW-Hill book company, New York.
[21] Saaty, T.L. (1986), Axiomatic foundation of the analytic hierarchy process. Management Sciences, , 32(7), 841-855.
[22] Saaty, T.L. (1990), An exposition of the AHP in reply to the paper remarks on the analytic hierarchy process. Management Sciences, 36(3), 259-268.
[23] Seiford, L.M. (1996), Data envelopment analysis: The evolution of the state of the art (1978–1995). Jour-nal of Productivity AJour-nalysis, 7(2-3), 99-137.
[24] Sexton, T.R., Silkman, R.H. and Hogan, A.J. (1986), Data envelopment analysis: Critique and exten-sions. In: Silkman, R.H. (ed.). Measuring Efficiency: An Assessment of Data Envelopment Analysis. Jossey-Bass, San Francisco, CA, pp. 73-105.
[25] Sinuany-Stern, Z., Mehrez, A. and Hadad, Y. (2000), An AHP/DEA methodology for ranking decision-making units. International Transactions in Operational Research, 7, 109-124.
[26] Vaidya, O.S. and Kumar, S. (2006), Analytic hierarchy process: An overview of applications, European Journal Of Operational Research, 169 (1), 1-29.
[27] Vitner, G., Rozenes, S. and Spraggett, S. (2006), Using data envelope analysis to compare project ef-ficiency in a multi-project environment. International Journal of Project Management, 24(4), 323-329. [28] Yang, T. and Kuo, C. (2003), A hierarchical AHP/DEA methodology for the facilities layout design
prob-lem, European Journal of Operational Research, 147, 128-136.
[29] Zahedi F. (1986), The Analytic Hierarchy Process: A Survey of the Method and Its Applications, Inter-faces, 16 (4), 96-108.
[30] Zavadskas, E.K., Turskis, Z., Tamosaitiene, J. and Marina, V. (2008), Multi-criteria selection of project managers by applying grey criteria. Technological and Economic Development of Economy, 14(4), 462-477.
About the Author
Baruch Keren
SCE- Shamoon College of Engineering, Industrial Engineering and Management Department E-mail: [email protected]
Baruch Keren is Senior Lecturer in the Industrial Engineering and Management Department at SCE – Shamoon College of Engineering. He is also a Lecturer at the Open University of Israel. He received his B.Sc., M.Sc., and Ph.D. summa cum laude in Industrial Engineering from Ben-Gurion University of the Negev. His professional experience includes 13 years at Israel Chemicals Ltd. and its subsidiaries, concentrating in the areas of industrial engineering, economics, and auditing. His current research interests are decision-making under uncertainty, production planning, project management, and operations research.
Yossi Hadad
SCE- Shamoon College of Engineering, Industrial Engineering and Management Department E-mail: [email protected]
Yossi Hadad is Associate Professor and Head of the Department of Industrial Engineering and Management at SCE – Shamoon College of Engineering. His areas of specialty are DEA, work study and ranking methods. He has published six books and more than 40 papers in these areas. He received his B.Sc., M.Sc. and Ph.D. (summa cum laude) in Industrial Engineering from Ben-Gurion University of the Negev, Israel.
Zohar Laslo
SCE- Shamoon College of Engineering, Industrial Engineering and Management Department E-mail: [email protected]