DOI: 10.12928/TELKOMNIKA.v17i2.3774 882
Facial image retrieval on semantic features using
adaptive mean genetic algorithm
Marwan Ali Shnan*1, Taha H. Rassem2, Nor Saradatul Akmar Zulkifli3 1,2,3
Faculty of Computer Systems and Software Engineering, University Malaysia Pahang, Kuantan, Pahang, Malaysia
2
IBM Center of Excellence, University Malaysia Pahang, Kuantan, Pahang, Malaysia *Corresponding author, e-mail: [email protected], [email protected],
Abstract
The emergence of larger databases has made image retrieval techniques an essential component and has led to the development of more efficient image retrieval systems. Retrieval can either be content or text-based. In this paper, the focus is on the content-based image retrieval from the FGNET database. Input query images are subjected to several processing techniques in the database before computing the squared Euclidean distance (SED) between them. The images with the shortest Euclidean distance are considered as a match and are retrieved. The processing techniques involve the application of the median modified Weiner filter (MMWF), extraction of the low-level features using histogram-oriented gradients (HOG), discrete wavelet transform (DWT), GIST, and Local tetra pattern (LTrP). Finally, the features are selected using Adaptive Mean Genetic Algorithm (AMGA). In this study, the average PSNR value obtained after applying the Wiener filter was 45.29. The performance of the AMGA was evaluated based on its precision, F-measure, and recall, and the obtained average values were respectively 0.75, 0.692, and 0.66. The performance matrix of the AMGA was compared to those of particle swarm optimization algorithm (PSO) and genetic algorithm (GA) and found to perform better; thus, proving its efficiency.
Keywords: discrete wavelet transform, euclidean distance, genetic algorithm, histogram oriented, gradients, local tetra pattern, median modified weiner filter, particle swarm optimization algorithm
Copyright © 2019 Universitas Ahmad Dahlan. All rights reserved.
1. Introduction
The world today is digitalized as evidenced by the presence of data in different forms such as videos, text, and images. These digitalized data are commonly saved in several databases from which their retrieval is attracting overwhelming user responses. Image retrieval involves the process of searching for an image and its retrieval from a large database [1]. As the diversity and complexity of images increases, it becomes more challenging to search and retrieve the right images [2]. The retrieval of an image can either be text or content based. The text-based image retrieval (TBIR) involves the retrieval of an image based on its textual information, while the content-based image retrieval (CBIR) uses some of the contents of the image such as its shape, colour, texture, or spatial information to retrieve the image [3, 4].
The CBIR is also referred to as query by image content (QBIC) or content-based visual information retrieval (CBVIR) [5]. It is a research field that has received much attention over the last 20 years [6, 7]. Context diversity in huge databases seems to be the trade-off between achieving relevant and intended results and achieving different results that cover different search areas [8-10]. Human images can be retrieved based on facial features.
The feature-based recognition frameworks recognize the shape and the similarities between facial parts as descriptive features [11]. Face recognition requires the actual identification of a specific person rather than just detecting the presence of a human face [12]. The system is presented with a sketch or an image as an input and challenged to retrieve similar images from the database. Within the system, the exact feature vector used to build the feature database is used to convert the input image into an internal representation of the feature vector. Then, the distance between the feature vectors of both the query image and the target images in the feature database is calculated based on the similarity measure [13-15]. Finally, the image retrieval is done using an indexing scheme that supports an efficient perusing of the
database. After performing the similarity assessment based on the features of the images, the output set achieves a high retrieval performance level [16].
In the absence of an image with the user, then, some systems will warrant the user to sketch an image which will serve as an input [17-19]. Most times, it may be difficult for a user to accurately present the intended visual content at hand, such as a sketch map or a sample image [20, 21]. This phenomenon is called “intention gap” and must be minimized to ensure the provision of the user with the relevant query results. Hence, the query input in a CBIR system demands a good user interface [22-25]. The remaining part of this paper is scheduled as follows: a review of the current reports on deep learning for sentiment analysis is presented in Section 2, while Section 3 provides the details of the designs and methodologies adopted in this study. Section 4 presented the experimental findings from the performance evaluations of the proposed approach. The last section presented the conclusions drawn from the current study.
2. Literature survey
A novel approach for long-term relevance feedback gain enhancement has been proposed by Rupali et al [13]. The general CBIR in the proposed system comprised of two steps, the ABC-based training step, and the image retrieval step. The image features such as the shape, colour or texture was extracted using Gabor Filter, Gray Level Co-occurrence Matrix, and Hu-Moment shape feature techniques, while the static features such as the mean and SD were extracted after image preprocessing. The k-means algorithm was utilized to cluster these features and each cluster was trained using an ANN-based ABC method. The weight of the features was updated using an ABC-based ANN. The experimental findings showed the proposed system as a suitable tool for achieving a better CBIR as it can minimize the semantic gap compared to the traditional systems.
Xiaochao et al. [14] presented the volume local binary count (VLBC) method of representing and recognizing dynamic textures. In this descriptor, the histograms of threshold local spatiotemporal volumes are extracted using both motion features and appearance to describe dynamic textures. The system was proven to be efficient in both computing and representing dynamic textures. The experimental evaluations using 3 dynamic texture databases (UCLA, DynTex, and DynTex++) showed the proposed method to achieve better classification rates compared to those achieved with the existing approaches. In addition to the effective dynamic texture recognition of the proposed system, it also utilizes CVLBC for 2D face spoofing detection. The performance evaluations demonstrated the CVLBC as an effective tool for 2D face spoofing detection.
Zhijie et al. [15] presented a fractal theory-based rapid face recognition method. In this method, the facial images are compressed to obtain the fractal codes before completing face recognition using the fractal codes. To ensure that face recognition is rapidly done, they suggested the use of the Fractal Neighbor Distance-Based Classification (FNDC) which is an improvement of the conventional fractal recognition methods. The FNDC uses class information to set up thresholds between and within classes to speed up the speed of recognition. They demonstrated the advantages of the FNDC through a series of experiments conducted on Yale, FERET and CMU PIE databases.
An improved principal component analysis (IPCA) was proposed by Yani et al. [16] for facial feature representation. The IPCA was designed mainly for the extraction of vital information from original facial images via the reduction of the feature vector dimensions. An LRC framework was utilized to treat the face recognition process as a linear regression problem. In the LRC, the least-square method is used to determine the class label with the least reconstruction error. Several evaluations were performed on Yale B, CMU_PIE and JAFFE databases to prove the suitability of the proposed IPCA, where both IPCA and LRC algorithms achieved better recognition performances compared to the existing algorithms.
Soumendu et al. [17] suggested a new hand-crafted local quadruple pattern (LQPAT) for the recognition and retrieval of facial images. The proposed framework addressed the challenges of the current techniques by defining an efficient encoding structure which has an optimal feature length. In the proposed descriptor, the relationship between the neighbours is encoded in the quadruple space, and from this relationship, two micropatterns were computed to form the descriptor. The proposed descriptor was compared to the existing handcrafted descriptors for retrieval and recognition accuracies based on certain benchmark databases such
as Caltech-face, Color-FERET, CASIA-face-v5, and LFW, and the analyses showed the proposed descriptor to perform well under uncontrolled variations.
Wangming et al. [18] suggested a novel non-negative sparse feature learning mechanism for producing a holistic image representation scheme based on low-level local features. To reduce the rate of information loss, a new feature pooling strategy called kMaxSum (comprising of the sum and max-pooling strategies) pooling was introduced. This strategy achieved higher image representation efficiency and was considered as a hybrid of the sum and max-pooling approaches. The outcome of the retrieval evaluations of 2 public image databases showed the proposed method as an effective approach.
3. The proposed system
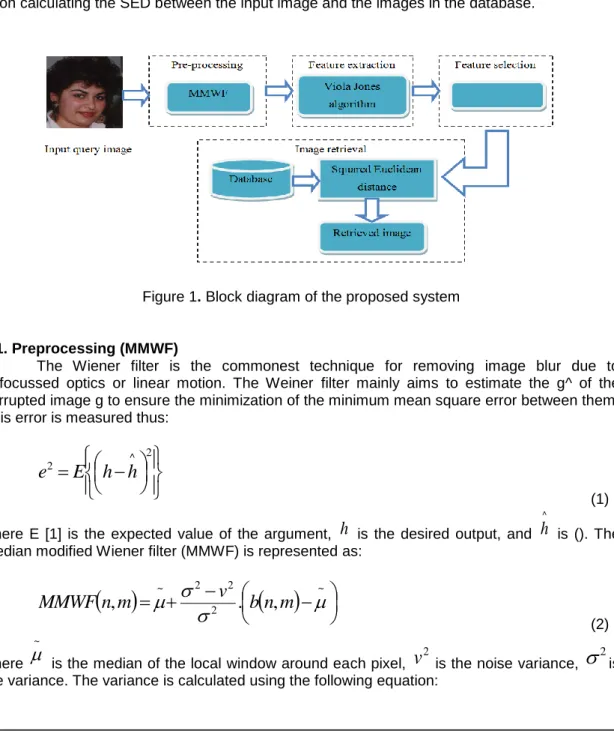
The system proposed in this study focuses on image retrieval from databases using features from the input image. Figure 1 depicts the block diagram of the proposed model. The flow of the proposed work is as follows: when the query image is read, it is preprocessed to remove noise using a Weiner filter before extracting the features. Among the extracted features, the most discriminating features are selected using AMGA. Finally, the images are retrieved upon calculating the SED between the input image and the images in the database.
Figure 1. Block diagram of the proposed system
3.1. Preprocessing (MMWF)
The Wiener filter is the commonest technique for removing image blur due to unfocussed optics or linear motion. The Weiner filter mainly aims to estimate the g^ of the corrupted image g to ensure the minimization of the minimum mean square error between them. This error is measured thus:
(1) where E [1] is the expected value of the argument, is the desired output, and is (). The median modified Wiener filter (MMWF) is represented as:
(2) where is the median of the local window around each pixel, is the noise variance, is the variance. The variance is calculated using the following equation:
AMG
^ 2 2E
h
h
e
h
^h
~ 2 2 2.
,
~,
v
b
n
m
m
n
MMWF
~
2v
2(3)
(4) where µ = the mean, = size of the local neighbourhood area , is a notation for the identification of each pixel in the area .
The aim of introducing the nonlinear adaptive spatial filter is to combine the abilities and qualities of the median and Wiener filters, thereby, annulling their respective drawbacks. A major effect is that after de-noising, there is a preservation of the edge morphology compared to the outcome of both median and Wiener filters alone. This effect was termed drop-off-effect due to the preservation of the slope of the spot sides in the 2D signals. The next significant outcome is the good performance of the MMWF in the global de-noising of different types of noise. 3.2. Feature extraction
The image preprocessing was followed by the feature extraction techniques to obtain the most discriminating features. A set of low-level features, viz, HOG, DWT, GIST, LTrP, and a set of high-level features were obtained by applying the Viola-Jones algorithm.
3.2.1. Low-level features a. HOG
In the HOG feature descriptor, the distribution of the gradient directions is used as the features. The image gradients are initially calculated before the histogram calculations. Each pixel in the cell casts a weighted vote for an orientation-based histogram channel depending on the gradient computation values. The values are later grouped into a larger block that is spatially connected. The HOG descriptor is then the concatenated vector of the components of the normalized cell histograms from all the block regions. The L2 norm of the vector is used for the block normalization which is denoted as:
(5) where = component of the block.
b. DWT
A two-level 2D DWT is applied to the input image. This produces four types of 2D matrices at the output (an approximation coefficient which is the original image at lower resolution) and 3 detail coefficients; viz. a horizontal coefficient (which highlights the horizontal edges of the original image), a vertical coefficient (which highlights the vertical edges), and a diagonal coefficient (which highlights the diagonal edges). The approximation coefficients at the end of the second level are considered as the feature here.
c. GIST
The GIST descriptor is based on spatial envelopes. These envelopes define the features that distinguish the images. These dominant spatial image structures are represented by features such as expansion, openness, roughness, naturalness, and ruggedness.
d. LTrP
The LTrP uses the direction of the centre grey pixel to describe the spatial structure of a local texture. Assume an image , its first-order derivatives along 0 and 90 directions are represented as . Let = the centre pixel while and = the horizontal and vertical pixels, respectively. The first order derivatives magnitude at the centre pixel can then be represented as:
m nm
n
a
NM
, 2 2 2)
,
(
1
m nm
n
a
NM
, 2)
,
(
1
NM
a
2(
n
,
m
)
d i ib
B
1)
(
ib
0g
I
0,90 1 g
gI
0g
I
g
hg
v(6) while the direction at the centre pixel is denoted as:
(7)
(8) from (7) and (8), four different directions of the centre pixel can be calculated.
3.2.2. High-level features a. Viola-Jones algorithm
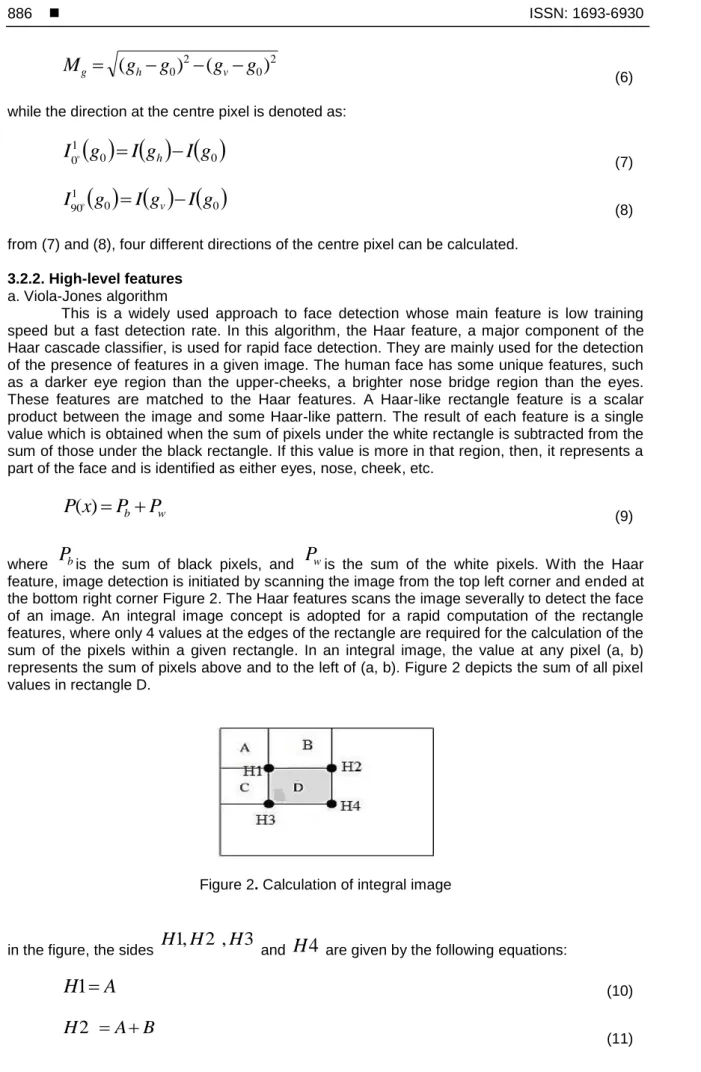
This is a widely used approach to face detection whose main feature is low training speed but a fast detection rate. In this algorithm, the Haar feature, a major component of the Haar cascade classifier, is used for rapid face detection. They are mainly used for the detection of the presence of features in a given image. The human face has some unique features, such as a darker eye region than the upper-cheeks, a brighter nose bridge region than the eyes. These features are matched to the Haar features. A Haar-like rectangle feature is a scalar product between the image and some Haar-like pattern. The result of each feature is a single value which is obtained when the sum of pixels under the white rectangle is subtracted from the sum of those under the black rectangle. If this value is more in that region, then, it represents a part of the face and is identified as either eyes, nose, cheek, etc.
(9)
where is the sum of black pixels, and is the sum of the white pixels. With the Haar feature, image detection is initiated by scanning the image from the top left corner and ended at the bottom right corner Figure 2. The Haar features scans the image severally to detect the face of an image. An integral image concept is adopted for a rapid computation of the rectangle features, where only 4 values at the edges of the rectangle are required for the calculation of the sum of the pixels within a given rectangle. In an integral image, the value at any pixel (a, b) represents the sum of pixels above and to the left of (a, b). Figure 2 depicts the sum of all pixel values in rectangle D.
Figure 2. Calculation of integral image
in the figure, the sides and are given by the following equations:
(10) (11) 2 0 2 0
)
(
)
(
g
g
g
g
M
g
h
v
0 0 1 0g
I
g
I
g
I
h
0 0 1 90g
I
g
I
g
I
v
w bP
P
x
P
(
)
bP
P
w3
,
2
,
1
H
H
H
H
4
A
H
1
B
A
H
2
(12)
(13)
(14)
(15)
where is the sum of all pixel values in the rectangle.
The detection window (Haar features) is moved across the image, and for each chosen window size, the window slides vertically and horizontally. A face recognition filter is applied at each step. Each classifier is composed of Haar feature extractors (weak classifiers). Ada boosts a strong classifier as a linear combination of these weak classifiers, as shown in (16).
(16)
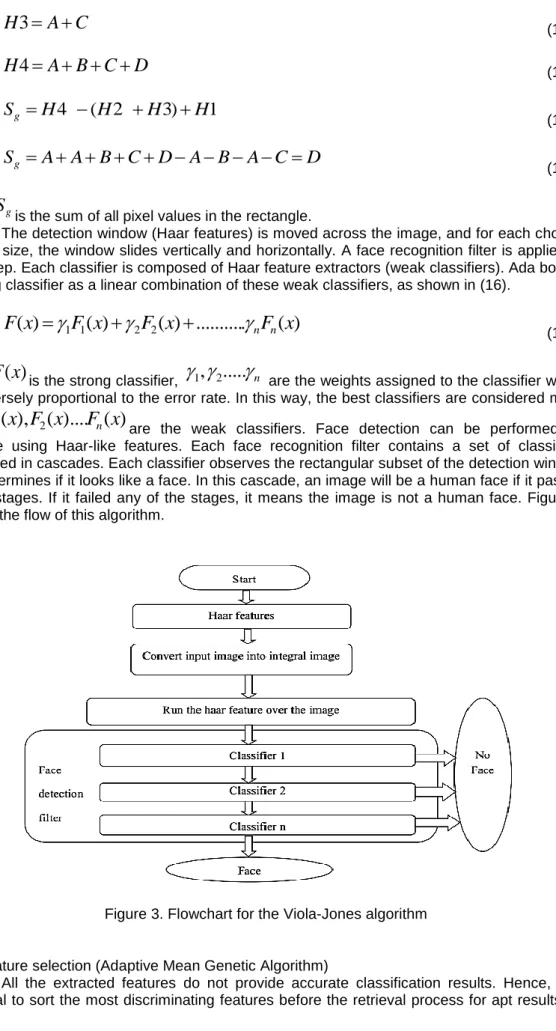
where is the strong classifier, are the weights assigned to the classifier which are inversely proportional to the error rate. In this way, the best classifiers are considered more and are the weak classifiers. Face detection can be performed by cascade using Haar-like features. Each face recognition filter contains a set of classifiers connected in cascades. Each classifier observes the rectangular subset of the detection window and determines if it looks like a face. In this cascade, an image will be a human face if it passes all the stages. If it failed any of the stages, it means the image is not a human face. Figure 3 depicts the flow of this algorithm.
Figure 3. Flowchart for the Viola-Jones algorithm
3.3. Feature selection (Adaptive Mean Genetic Algorithm)
All the extracted features do not provide accurate classification results. Hence, it is essential to sort the most discriminating features before the retrieval process for apt results. In
C
A
H
3
D
C
B
A
H
4
1
)
3
2
(
4
H
H
H
H
S
g
D
C
A
B
A
D
C
B
A
A
S
g
gS
)
(
.
...
)
(
)
(
)
(
x
1F
1x
2F
2x
F
x
F
n n)
(
x
F
1,
2...
n)
(
)....
(
),
(
2 1x
F
x
F
x
F
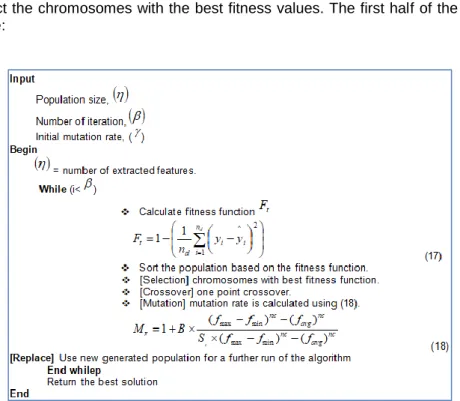
nthis paper, feature selection is done with the help of Adaptive Mean Genetic Algorithm (AMGA). The pseudo code of the AMGA is given in Figure 4. Figure 4 is explained in the following steps: Step 1: Initially, the number of population and iterations is set. The population size is the number of features selected.
Step 2: The fitness function is determined using equation 17. Step 3: Sort the fitness function and their corresponding chromosomes.
Step 4: Select the chromosomes with the best fitness values. The first half of the population is selected here:
Figure 4. Pseudocode of AMGA
Step 5: One-point cross is performed on the selected parent chromosomes.
Step 6: The mutation rate is calculated using equation 18, in which is the population of the chosen parent chromosomes, is the worst fitness value, is the best fitness value, is the average fitness value, B is taken as 2, and is the control parameter given by (19).
(19)
This adaptation on the mutation rate in GA is utilized in this paper and is stated as AMGA. With this adaptive strategy, the exploitation of good solutions is increased, thus, speeding up the convergence and preventing the population from being trapped at the local minima in most cases.
3.4. Image retrieval (Squared Euclidean Distance)
The aim of this entire process is to retrieve the images that are identical to the input image. The FGNET database was used in this paper. The above techniques (preprocessing, feature extraction and feature selection) were also done for the images in the database. The SED between the selected features of the query images and the images in the database is
t
F
nc
minf
f
maxf
avg iS
nc avg if
f
f
S
max mincalculated and the image corresponding to the features with the shortest SED is selected as the identical image. The SED between two features and is given by:
(20)
4. Results and discussion
The performance of the techniques used in this paper was evaluated and compared to other existing techniques. Furthermore, the performance of the AMGA algorithm was evaluated in terms of its precision, recall, and F-measure and compared to other feature selection techniques like GA and PSO.
4.1. Performance analysis
The performance of the filter techniques and the feature selection techniques was analyzed. The PSNR value was utilized in evaluating the performance of the MMWF. A comparison with the existing filtering techniques was also provided. The PSNR value can be calculated using equation 21.
(21)
where is the maximum number of pixels, and is the mean square error. The MSE is given by:
(22)
where is the desired output, and is the current output. is the area of the selected pixels. The performance of the feature selection techniques can be evaluated using 3 measures- precision, recall, and F-measure. The precision is calculated using equation 23.
(23)
similarly, the recall and F-measure values can be calculated using in (24) and (25), respectively.
(24)
(25) 4.2. Comparative analysis
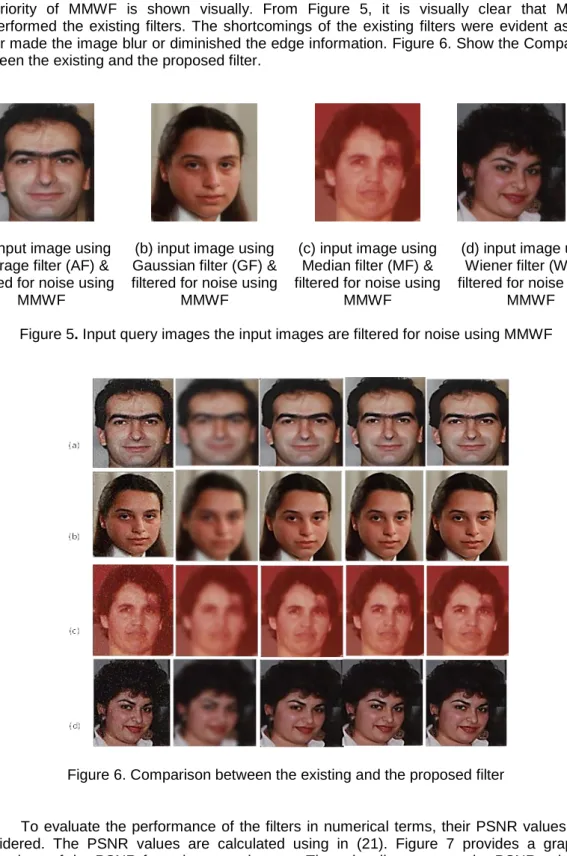
The input query images used in this paper are shown in Figure 5. The input images are filtered for noise using MMWF. The superiority of the MMWF lies in its ability to preserve the image edge morphologies. Figure 5 shows a visual comparison of the existing filters, while the
i
f
1f
2i 2 1 2 2 1)
)
(
(
P i i if
f
d
MSE
MAX
PSNR
i 2 10log
10
iMAX
MSE
1 0 1 0 2 ^)
,
(
)
,
(
1
M x N yg
x
y
g
x
y
MN
MSE
)
,
(
x
y
g
(
,
)
^y
x
g
MN
p p pF
T
T
precision
n p pF
T
T
recall
recall
precision
recall
precision
Score
F
2
superiority of MMWF is shown visually. From Figure 5, it is visually clear that MMWF outperformed the existing filters. The shortcomings of the existing filters were evident as they either made the image blur or diminished the edge information. Figure 6. Show the Comparison between the existing and the proposed filter.
(a) input image using Average filter (AF) & filtered for noise using
MMWF
(b) input image using Gaussian filter (GF) & filtered for noise using
MMWF
(c) input image using Median filter (MF) & filtered for noise using
MMWF
(d) input image using Wiener filter (WF) & filtered for noise using
MMWF Figure 5. Input query images the input images are filtered for noise using MMWF
Figure 6. Comparison between the existing and the proposed filter
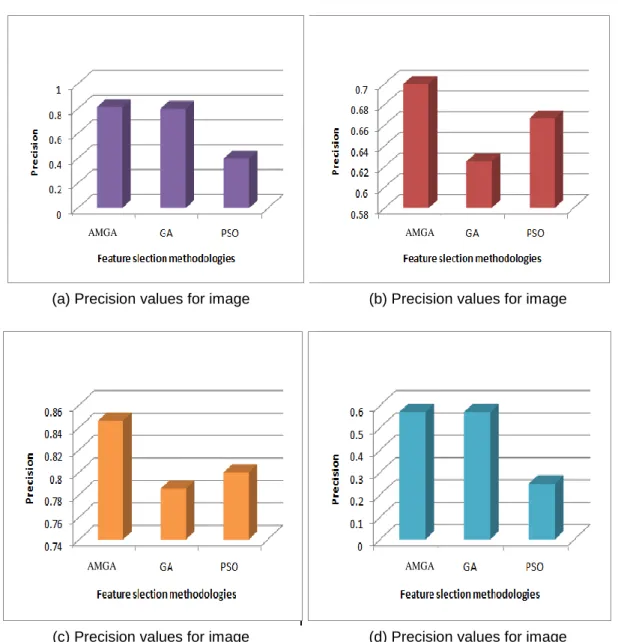
To evaluate the performance of the filters in numerical terms, their PSNR values were considered. The PSNR values are calculated using in (21). Figure 7 provides a graphical comparison of the PSNR from the query images. They visually represent the PSNR values of the query images after being processed by the filters earlier discussed. In Figure 7(a, b, c, d), the names of the filters are plotted on the x-axis while the PSNR values are plotted on the y-axis. Form Figure 7, the PSNR values of the images when using MMWF were higher compared to those of the other filters, thereby, presenting the MMWF as the most efficient filter. Similarly, comparisons can also be made on the feature selection techniques. These techniques can be evaluated in terms of precision, recall, and F-measure. This would provide a concrete proof of the efficiency of the superior method. Figure 8 depicts the comparison of the precision between
4 different query images for 3 different feature selection methods. The precision of the AMGA method used in this study was compared to those of GA and PSO. The algorithmic precision was calculated using (23). Figure 8 depicts the precision values of the input query images after processing by different filters.
(a) PSNR values for image (b) PSNR values for image
(c) PSNR values for image (d) PSNR values for image Figure 7. PSNR values of the input query images after processing by different filters
In Figure 8(a, b, c, d), the names of the feature selection methods are plotted on the x-axis while the precision values are plotted on the y-axis. From the figure, the AMGA performed better than AG and PSO. The below results are tabulated in Table 1 and Table 2 presents the recall values of the evaluated algorithms and their comparison. The recall values are calculated using in (24).
Figure 9 presents the comparison between the recall values of AMGA, AG, and PSO. In Figure 9(a, b, c, d), the names of the feature selection method are plotted on the x-axis while the recall values are plotted on the y-axis. From the figure, the AMGA outperformed the AG and PSO. In Figure 9(a, b, c, d), the names of the feature selection method are plotted on the x-axis while the recall values are plotted on the y-x-axis. From the figure, the AMGA outperformed the AG and PSO. The F-measure values of the existing and the proposed methodologies are tabulated in Table 3. The F-measure is calculated using equation 25.
(a) Precision values for image (b) Precision values for image
(c) Precision values for image (d) Precision values for image Figure 8. Precision values of the input query images after processing by different filters
Table 1. Precision comparison
Image Name Precision for AMGA Precision for GA Precision for PSO (a) 0.8125 0.8 0.4 (b) 0.84615 0.78571 0.8 (c) 0.571429 0.571429 0.25 (d) 0.785714 0.75 0.4
Table 2. Recall comparison
Image Name Recall for AMGA Recall for GA Recall for PSO (a) 0.86667 0.8 0.13333 (b) 0.6875 0.6875 0.75 (c) 0.363636 0.363636 0.090909 (d) 0.733333 0.6 0.133333
Figure 10 provides a visual comparison of the F-measure between AMGA, GA, and PSO. In Figure 10(a, b, c, d), the names of the feature selection method are plotted on the x-axis while the corresponding F-measure values are plotted on the y-axis. From the figure, the
AMGA AMGA
AMGA AMGA
AMGA outperformed the AG and PSO. The overall results of the methodologies used in this paper are tabulated in Table 4, containing the precision, recall, and F-measure values of the feature selection techniques used in this paper. The Table also presents the PSNR value of the images filtered using MMWF.
(a) Recall values for image (b) Recall values for image
(c) Recall values for image (d) Recall values for image Figure 9. Recall values of the input query images after processing by different filters
Table 3.Comparison of the F-Measure
Image Name F-measure for AMGA F-measure for GA F-measure for PSO (a) 0.83871 0.8 0.2 (b) 0.75862 0.73333 0.77419 (c) 0.444444 0.444444 0.133333 (d) 0.758621 0.666667 0.2
(a) F-measure values for image (yb) F-measure values for image
(c) F-measure values for image (d) F-measure values for image Figure 10. F-measure values of the input query images after processing by different filters
Table 4. Concatenated Results of the Proposed Methodology
Image Precision Recall F-measure PSNR values while using MMWF
0.8125 0.86667 0.83871 43.50073
0.84615 0.6875 0.75862 44.36676
0.571429 0.363636364 0.444444444 49.64241
5. Conclusion
A content-based image retrieval technique was proposed in this study. In this technique, the input image is first filtered using MMWF. This filter preserves the vital image information better than most of the available image filters. The filtration process is followed by the feature selection process using AMGA. The Viola-Jones algorithm was used for the extraction of the high-level features. The performance of the proposed AMGA was evaluated in terms of its precision, recall, and F-measure and compared to those of GA and PSO. The evaluation results proved a superior performance of the AMGA compared to GA and PSO in terms of its precision, recall, and F-measure. Future works are recommended on the improvement of the AMGA computational time.
Acknowledgement
This work is supported by the Universiti Malaysia Pahang (UMP) via Research Grant UMP RDU160349.
References
[1] Madhavi D, M Ramesh Patnaik. Genetic Algorithm-Based Optimized Gabor Filters for Content-Based Image Retrieval. In Intelligent Communication, Control and Devices, Springer, Singapore. 2018; 157-164.
[2] Khodaskar, Anuja, Sidharth Ladhake. A Novel Approach for Intellectual Image Retrieval Based on Image Content Using ANN. In Computational Intelligence in Data Mining Springer, New Delhi. 2015; 3: 693-704.
[3] Das, Pranjit, Arambam Neelima. An overview of approaches for content-based medical image retrieval. International Journal of Multimedia Information Retrieval. 2017; 6(4): 271-280.
[4] Tyagi, Vipin. Content-Based Image Retrieval Based on Location-Independent Regions of Interest. In Content-Based Image Retrieval, Springer, Singapore. 2017; 205-225.
[5] Dixit, Umesh DMS. Shirdhonkar. Face-based Document Image Retrieval System. Procedia Computer Science. 2018; 132: 659-668.
[6] Desai, Rupali, Bhakti Sonawane. Gist, HOG, and DWT-Based Content-Based Image Retrieval for Facial Images. In Proceedings of the International Conference on Data Engineering and Communication Technology, Springer, Singapore. 2017; 297-307.
[7] Vanitha, Janakiraman, Muthukrishnan Senthilmurugan. Multidimensional Image Indexing Using SR-Tree Algorithm for Content-Based Image Retrieval System. In International Conference on Emerging Research in Computing, Information, Communication and Applications, Springer, Singapore, 2016; 81-88.
[8] Iftene, Adrian, Baboi Alexandra-Mihaela. Using semantic resources in image retrieval. Procedia Computer Science. 2016; 96: 436-445.
[9] Wen Ge, Huaguan Chen, Deng Cai, Xiaofei He. Improving face recognition with domain adaptation. Neurocomputing. 2018; 287: 45-51.
[10] Angadi, Shanmukhappa, Vishwanath Kagawade. Face Recognition Through Symbolic Data Modeling of Local Directional Gradient. In International Conference on Emerging Research in Computing, Information, Communication and Applications. Springer, Singapore. 2016; 67-79.
[11] Tyagi, Vipin. Content-Based Image Retrieval: An Introduction. In Content-Based Image Retrieval. Springer, Singapore. 2017; 1-27.
[12] Tyagi, Vipin. Research Issues for Next Generation Content-Based Image Retrieval. In Content-Based Image Retrieval. Springer, Singapore. 2017; 295-302.
[13] Mane, Pranoti P, Narendra G, Bawane. An effective technique for the content-based image retrieval to reduce the semantic gap based on an optimal classifier technique. Pattern Recognition and Image Analysis. 2016; 26(3): 597-607.
[14] Hao Xiaochao, Yaping Lin, Janne Heikkilä. Dynamic texture recognition using volume local binary count patterns with an application to 2D face spoofing detection. IEEE Transactions on Multimedia. 2018; 20(3): 552-566.
[15] Tang Zhijie, Xiaocheng Wu, Bin Fu, Weiwei Chen, Hao Feng. Fast face recognition based on fractal theory. Applied Mathematics and Computation. 2018; 321(C): 721-730.
[16] Zhu Yani, Chaoyang Zhu, Xiaoxin Li. Improved principal component analysis and linear regression classification for face recognition. Signal Processing. 2018; 145: 175-182.
[17] Chakraborty, Soumendu, Satish Kumar Singh, Pavan Chakraborty. Local quadruple pattern: A novel descriptor for facial image recognition and retrieval. Computers & Electrical Engineering. 2017; 62: 92-104.
[18] Xu Wangming, Shiqian Wu, Meng Joo Er, Chaobing Zheng, Yimin Qiu. New non-negative sparse feature learning approach for content-based image retrieval. IET Image Processing. 2017; 11(9): 724-733.
[19] Hasan RA, Mohammed MN. A Krill Herd Behaviour Inspired Load Balancing of Tasks in Cloud Computing. Studies in Informatics and Control. 2017; 26(4): 413-424.
[20] Hasan RA, Mohammed MA, Salih ZH, Ameedeen B, Ariff M, Ţăpuş N, Mohammed MN. (2018). HSO: A Hybrid Swarm Optimization Algorithm for Reducing Energy Consumption in the Cloudlets. TELKOMNIKA Telecommunication Computing Electronics and Control, 16(5).
[21] Rassem TH, Makbol NM, Yee SY. Face recognition using completed local ternary pattern (CLTP) texture descriptor. International Journal of Electrical and Computer Engineering (IJECE). 2017; 7(3): 1594-1601.
[22] Mohammed MA, Salih ZH, Ţăpuş N, Hasan RAK. Security and accountability for sharing the data stored in the cloud. In RoEduNet Conference: Networking in Education and Research, IEEE.
2016; 1-5.[23] Mohammed MA, ŢĂPUŞ N. A Novel Approach of Reducing Energy Consumption by Utilizing Enthalpy in Mobile Cloud Computing. Studies in Informatics and Control. 2017. 26(4), 425-434.
[24] Hammood OA, Kahar MNM, Mohammed MN. Enhancement the video quality forwarding UsingReceiver-Based Approach (URBA) in Vehicular Ad-Hoc Network. In Radar, Antenna, Microwave, Electronics, and Telecommunications (ICRAMET), International Conference on IEEE. 2017; 64-67.
[25] Guo H, Su S, Liu J, Sun Z, Xu Y. An Image Retrieval Method Based on Manifold Learning withScale-Invariant Feature Control. TELKOMNIKA Telecommunication Computing Electronics and Control. 2016; 14(3A): 252-258.