A New Approach to Accessibility – Perceived accessibility versus objectively measured accessibility in daily travel.
Katrin Lättmana*, Lars E Olssona, and Margareta Frimana a SAMOT/CTF, Karlstad University, 65188 Karlstad, Sweden
* Corresponding author: SAMOT/CTF, Karlstad University, 651 88 Karlstad, Sweden. +46(0)54 7001354. [email protected]
Keywords: perceived accessibility; accessibility; accessibility measure; transport planning; sustainable transport
Classification codes (minimum of 3, maximum 6): R0; R2; D1
ABSTRACT
Accessibility has conventionally been measured and evaluated ignoring the user-perspective in favor for focus on travel time and distance to a number of pre-determined destinations. Acknowledging this gap, we recently developed a scale for perceived accessibility PAC (Lättman, Friman, & Olsson 2016) aimed at capturing the individual perspective of accessibility within a certain travel mode. In this paper, we 1) further develop the PAC measure of perceived accessibility in order to capture the perceived accessibility of the individuals’ actual daily travel 2) compare residents’ perceived accessibility to the objective accessibility level for the same residential area, and 3) compare levels of perceived
accessibility between residential areas and main travel modes. Data from 2711 residents of Malmö, Sweden show that perceived accessibility is consistently higher than objective accessibility across 13 residential areas, with minor differences in levels of perceived accessibility between areas. Surprisingly, bicycle users rate their accessibility significantly higher than those who mainly use the car or public transport for daily travel, contrary to objective accessibility assumptions. These differences point at the importance of including perceived accessibility as a complementary tool when planning for and evaluating the transport systems.
1. Introduction
Despite being one of the most recognized and explored concepts in the field of
transportation, research and practice on transport accessibility still linger around and depend on conventional, objective measures and evaluations that for the most part ignore the individual dimension and perspective of accessibility (the others being land-use, transport mode, and temporal dimensions [Geurs & Van Eck, 2001]). The individual perspective is at best represented in empirical research by sociodemographic data such as age, income, and place of residence in favor for focus on place-based dimensions of accessibility, such as travel time or distance to a number of pre-determined destinations. (Titheridge, Mackett, & Achuthan, 2010). This is unfortunate as when it comes to planning for and evaluating transport accessibility, it is expected that perceived (e.g. subjective or realised) accessibility differ from objective (potential) accessibility within contexts as well as between transport modes. For instance, different combinations of public transport, cycling or walking may elicit
diverse experiences within and between individuals, and depending on if the travel takes place in the countryside or in the city during rush hour, the sources of the experience may contrast even more, making perceived accessibility an exceedingly relevant area for research, implementation, and evaluation in transportation.
The authors define perceived accessibility as “how easy it is to live a satisfactory life using the transport system” (Lättman, Olsson, & Friman, 2016). This definition includes, but is not limited to, accessibility while using the transport system per se, ease of getting to the transport system, and the perceived possibilities and ease to live the life one wants (e.g. ability to reach activities of choice) with help of the transport system.
Previous empirical findings support the suggestion that subjective experiences and perceptions may be as important as conventional objective indicators when designing and evaluating a socially inclusive transport system (Curl, 2013; Lättman et al., 2016A). A study by Combs, Shay, Salvesen, Kolosna, and Madeley (2016) found differences between how individuals perceived their own travel needs in relation to their travel possibilities, and objective indicators of transport disadvantage (age, physical mobility, income, vehicle access). Another study set in Teheran (Lotfi & Koohsari, 2009) provided different levels of accessibility for the same two residential areas depending on if accessibility was measured by objective indicators (GIS modelling) or by interviews capturing the perceived accessibility of the area residents.
The concept of perceived accessibility has started to get attention even on policy level. Examples of this include long-term intentions of improved life-quality for individuals, groups, and even cities, by pursuing liveability and accessibility for all (City of Gothenburg, 2014; European commission, 2015). Despite this, researchers and planners have found it difficult to include and capture perceived accessibility in transport-related research and practice, partly due to practical measurement issues, such as a lack of meaningful, practical measures of perceived accessibility (Lucas, van Wee, & Maat, 2016; vanWee, 2016). This means that there still exists a need for research incorporating this complementary but essential dimension (Schwanen, Lucas, Akyelken, Cisternas Solsona, Carrasco, & Neutens, 2015; Shay et al., 2016).
The primary aim of this paper is to study potential differences between perceived and objective accessibility in daily travel. Acknowledging this gap, the authors recently developed a scale for perceived accessibility PAC (Lättman et al., 2016A) aimed at capturing and evaluating the individual perspective of accessibility within a certain travel mode. Although PAC has merit, it was designed for specified travel modes and is limited in its ability to capture perceived accessibility in actual daily travel that may consist of combinations of different modes. As the current paper aims to look at differences between perceived and objective accessibility in daily travel, the PAC measure was slightly modified and empirically tested against objective accessibility among 2700 urban residents.
1.1 Accessibility
Transport accessibility is important, as it enables individuals to live their daily lives and travel to destinations and activities by use of the transport system. Accessibility is also an important prerequisite for social inclusion (Farrington & Farrington, 2005), and has been linked to psychological concepts such as well-being and quality of life (De Vos, Schwanen, Van Acker, & Witlox, 2013; Olsson, Gärling, Ettema, Friman, & Fujii, 2013; Parkhurst & Meek, 2014).
Although Morris, Dumble, and Wigan (1979) distinguished between objective and
perceived measures of accessibility already in the late seventies, the concept of accessibility and how it is measured and evaluated in transport research and planning still mainly rely on objective indicators of accessibility, such as travel times, distances, or place characteristics. Those studies that actually include the individual perspective seem to be content with including demographic characteristics (Dong, Ben-Akiva, Bowman, & Walker, 2006; Hanson & Schwab, 1987; Kwan, 1998) or at best capturing subjective data by non-quantifiable methods such as semi-structured interviews (Curl, Nelson, & Anable, 2011; Lotfi & Koohsari, 2009). This is unfortunate, as social dimensions of accessibility (such as levels of
accessibility for specific population groups and their related social outcomes) are not
captured by traditional accessibility measures (Lucas et al., 2016). Moreover, recent findings indicate that 1) there are indeed gaps between conventionally measured or modelled
accessibility, and how accessibility is perceived by individuals (Budd and Mumford, 2006; Curl et al., 2011; Scheepers et al., 2016), and that 2) social activities clearly are the most important activities for the travellers (Titheridge et al., 2010). Instead of assuming
homogeneity in geographical areas or groups of individuals, a distinction between objective accessibility and perceived accessibility is highly relevant, as the opportunities and abilities to travel are likely to be perceived differently between individuals, alas also between objective and subjective measurements.
1.2 Objective accessibility
Objective accessibility determine the objective options for travel, such as the built
environment, attributes of transport modes, travel times, travel costs, and travel distances. There are several approaches for measuring objective accessibility, ranging from the simpler, conventional methods that capture distances and travel times from A to B up to more complex measures that capture and compare aspects of several different accessibility-dimensions, such as the SNATMUS-tool developed by Curtis and Scheurer (2016).
The overviews by Scheurer and Curtis (2007) and Ryan, Lin, Xia, and Robinson (2016) provide thorough descriptions of different accessibility measures commonly used in research, divided into six methodological categories; Spatial separation measures, Contour measures, Gravity measures, Competition measures, Time-space measures, Utility measures, and Network measures. The more recent SNATMUS-tool (Curtis and Scheurer, 2016) brings together these conventional measures by including the land-use, temporal, and transport mode-dimensions of accessibility in one measure allowing for complex evaluations and comparisons between different contexts. The individual dimension of accessibility (e.g. individual expectations and perceptions) is however still absent (Lättman, 2017).
Research using objective indicators of accessibility has of recent resulted in a number of GIS-based mappings of accessibility levels within specific cities using time, place, distance and travel-mode based data (e.g. Siegel, 2016; Trivector, 2013). Objective accessibility measures has also helped providing research roadmaps for accessibility (Bekiaris & Gaitanidou, 2012) and comparisons between objectively mapped accessibility and actual travel. Dalton, Jones, Panter, and Ogilvie (2015) concludes in their study in the UK that the geographical overlap between objectively mapped accessibility routes and actual trips made by working adults in Cambridge is as low as 39 %, with 27 % of the trips made being further than modelled. Ryan, Lin, Xia, and Robinson (2016) compared measured to perceived accessibility (to train stations) between age groups and travel modes in Australia, and found
that objectively measured accessibility and perceptions of accessibility don´t match. Results like these suggest that objective measurements are not capturing the entire concept, and need to be complemented with measures of perceived accessibility.
1.3 Perceived accessibility
Perceived accessibility is about how people rate the conditions in which they live. Different individuals may perceive accessibility differently due to which travel opportunities that are known to them, or lie in their interest. Alas, contrary to objective accessibility, perceived accessibility is not about setting up a priori assumptions of the (most) important indicators of accessibility, as these may vary between individuals, groups, cultures and contexts. Instead, perceived accessibility consist of perceptions of the level of ease to access and use of the built environment and transport system or access to the activity of choice. On a more specified level, indicators of perceived accessibility may consist of perceptions of (classical objective) determinants such as distance to the nearest transit station or shop, perceived ability to get to the bus stop, or perceived safety when using the transport system (Lättman et al., 2016B). On the other hand, perceived accessibility may also include perceptions of the information (opportunities) known to the individual or personal preferences and abilities.
These individual perspectives cannot properly be captured by objective indicators, as objective indicators miss contextual determinants (such as the climate, or culture that determine walking- or cycling preferences) and individual preferences, such as where individuals actually want to go which may not be the nearest food-store or the work-out facilities that are closest to home. Neither do objective indicators have the ability to capture the awareness of options that different individuals’ experience, as this awareness may not correlate with calculated accessibility levels (van Wee, 2016).
Perceived accessibility is important in itself since it reflects the individual´s perceived ability to reach destinations and participate in preferred activities using the transport system. However, the ability or inability to participate in daily activities does not only affect the actual perceived accessibility of individuals. It has been established that accessibility is positively connected to several travel outcomes, such as well-being (Parkhurst & Meek, 2014) or transport-related social inclusion (Farrington, 2007; Stanley, Stanley, Vella-Brodrick, & Currie, 2010). Ziegler and Schwanen (2011) claim that subjective indicators are even better predictors of well-being than objective indicators.
A study by Scott, Evenson, Cohen, and Cox (2007) comparing subjective to objective accessibility (to recreational facilities) found that subjective accessibility predicted physical activity (actual use of the facilities) whereas objective measures were unrelated to use (apart from 1 facility), suggesting that perceptions of accessibility are also more important for predicting use. In line with this, Hui and Habib (2014) established that individuals who experience the transport system as accessible also experience less social exclusion. Scheepers et al. (2016) study of 3663 individuals in the Netherlands found that perceived accessibility is linked to transport choice, regardless of objective accessibility levels,
indicating that a focus on perceived accessibility is superior if the aim is to get individuals to choose active travel modes. According to Tobias and Ferreira (2014), researchers need to include the perceptions of the users in order to make investments more responsive to the needs and expectations of the population. Curl, Nelson, and Anable (2015) take this reasoning a step further by arguing that none of these measures (objective or subjective)
should be allowed to inform policy decisions at all before we have an understanding of the differences between them, and how they relate to each other. These findings indicate yet again the importance of including perceived accessibility when researching, planning for, and evaluating transport accessibility.
1.4 The present research and study objectives
Given the theoretical differences between objective and perceived accessibility, there is reason to believe that perceived accessibility, by comprising the perspective, knowledge, and travel horizon of the passenger, captures accessibility in a way that conventional accessibility measures cannot (Curl et al., 2011; Lättman, 2016). Previous research (Lotfi & Koohsari, 2009; Scott et al., 2007) alongside more recent findings by Curl et al. (2015) confirm this belief as their comparison of objective accessibility and perceived accessibility of travel time to a number of destinations revealed discrepancy between the two, with perceived
accessibility being greater in urban areas, and objective accessibility greater in rural areas. Not only may perceived accessibility lead to different results than objective accessibility, but often evaluations and presentations of accessibility studies do not acknowledge that this subjective perspective is missing, which has led to assumptions that the accessibility level of all residents within a specific area is consistent with the results of the objective
measurement, thus ignoring individual variances. In the current study, we argue that
measuring perceived accessibility on an aggregated level and comparing it to an objectively measured accessibility-index in thirteen residential areas in a Swedish urban setting, will bring important insights to the more or less unexplored relationship between objective and perceived accessibility. By also looking at and comparing levels of perceived accessibility between residential areas and between travel modes we expect to gain further knowledge of perceived accessibility itself, and whether there are significant differences between levels of perceived accessibility depending on where individuals live and what mode of travel they prefer.
More specifically, the study objectives are:
1) Further development of the PAC measure of perceived accessibility in order to capture the perceived accessibility of the individuals’ actual daily travel.
2) Comparing residents’ perceived accessibility to the objective accessibility level for the same residential area.
3) Comparing levels of perceived accessibility between different residential areas and between travel modes.
2. Material and methods
2.1 Study setting, participants and procedure
In October and November 2016, data from 2711 structured interviews was collected in Malmö, which has approximately 300 000 inhabitants and is the third largest city in Sweden. Malmö was selected as it has recently been divided into 15 residential areas (so called “tromp”-areas) within a project aiming at long-term evaluating and planning for increased
accessibility and mobility by sustainable transport options in the city (Malmö Stad, 2016). This project includes temporal- and place-based data that has provided Malmö with an objectively mapped, aggregated GIS accessibility-index score for each of these residential areas, based on accessibility scores for a number of specific sustainable travel modes (walking, cycling and public transport). Due to this Malmö was deemed suitable for comparisons between objective and perceived accessibility.
The participants of this study (age range 18-95) were included based on area of residence, but otherwise randomly chosen. Approximately half of the participants were men (47%) and the other half (53%) women. Out of the 2711 participants, 1141 used car, 743 cycling, 616 public transport, and 176 walking as their primary mode of transport in daily travel.
2.2 Instruments
Perceived accessibility was measured by an updated version of the Perceived Accessibility Scale, PAC (Lättman et al., 2016A) which consist of 4 items (table 2, section 3.1) that together were designed to measure overall perceived accessibility of the individuals´ daily travel, regardless of travel modes, or combination of modes. After the participants were asked to state their primary travel mode- car, bicycle, walk, public transport or other- they rated their experience of daily travel accessibility within Malmö on a 7-point Likert scale (ratings from “I don´t agree” = 1 to “I completely agree” = 7). Apart from the four items measuring overall accessibility, the structured interviews consisted of questions of age, income, residential area, hypothetical perceived accessibility, and a number of items considering opinions of the built environment in Malmö. Some of the data will be used in an upcoming study by the authors.
Data for the objective accessibility-index for each of the residential areas (tromps) was compiled by Malmö City between January and March 2017. These data are GIS-based and determine travel duration and distances to selected target destinations on a scale of 0-5. Indicators for objective accessibility are presented below in table 1. Two of the 15 tromp areas were excluded from analysis due to the low number of residents living in the areas (mainly industrial grounds).
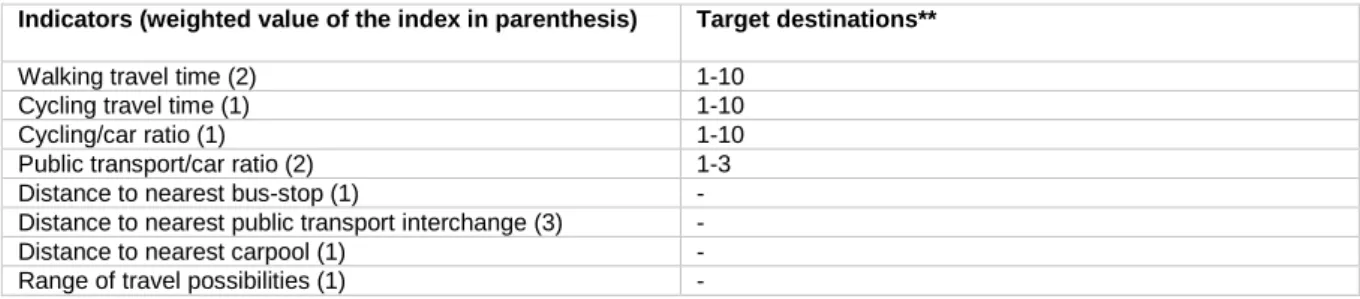
Table 1. Provides a brief overview of the indicators for the objective accessibility index*. Indicators (weighted value of the index in parenthesis) Target destinations**
Walking travel time (2) 1-10
Cycling travel time (1) 1-10
Cycling/car ratio (1) 1-10
Public transport/car ratio (2) 1-3
Distance to nearest bus-stop (1) -
Distance to nearest public transport interchange (3) -
Distance to nearest carpool (1) -
Range of travel possibilities (1) - *A full description of the calculation methods can be found in Trivector (2013).
** Target destinations: 1. Public transport hub, 2. City center, 3. Shopping mall, 4. Preschool, 5. Elementary school, 6. Health center, 7. Grocery store, 8. Park, 9. Exercise facility, and 10. Playground.
3. Results
The data was at first analyzed for the revised four PAC items of perceived accessibility, redesigned to measure actual daily travel rather than perceived accessibility of single travel modes. A Cronbach´s alpha analysis revealed a satisfying overall item correlation (α=.90) with no improvement for item deletion. These statistics alongside correlations, means, standard deviations, skewness and kurtosis are presented in table 2.
Table 2. Descriptive Statistics, Correlations, Skewness (Sk), Kurtosis (Kur) and change in Cronbach's alpha for 4 items (N=2711, α = 0.90).
Item 1 2 3 M SD α if item
deleted
Sk Kur Considering how I travel today it is easy to do my daily
activities
- - - 5.64 1.54 .89 -1.19 0.92 Considering how I travel today I am able to live my life as I
want to
0.67* - - 5.80 1.53 .86 -1.38 1.38 Considering how I travel to day I am able to do all activities I
prefer
0.60* 0.73* - 5.66 1.62 .86 -1.19 0.68 Access to my preferred activities is satisfying considering how I
travel today
0.65* 0.68* 0.76* 5.61 1.54 .86 -1.11 0.67 * p <.001
3.2 Statistical analyses
3.2.1 Study objective 1; Further development of the PAC measure of perceived accessibility in order to capture the perceived accessibility of the individuals’ actual daily travel:
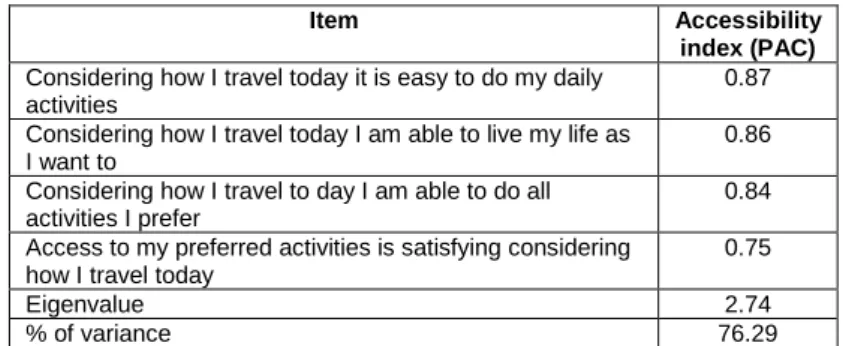
An exploratory factor analysis (Maximum Likelihood method) was performed in order to explore if the revised PAC items measure the same concept, e.g if they are unidimensional. An exploratory type of analysis was chosen, as there were no clear predictions of which factors existed for the revised perceived accessibility items and how they related to the variables (Byrne, 2010; Gorsuch, 1997). The analysis extracted one factor with an eigenvalue over 1 that explained 76.29 % of the variance, with a meritorious sampling adequacy (Kaiser-Meyer-Olkin) of .81. The scree plot further confirmed the extraction of one factor. Factor loadings are provided in Table 3.
Table 3. Factor loadings for Maximum Likelihood exploratory factor analysis of accessibility scales (N= 2711).
Item Accessibility
index (PAC) Considering how I travel today it is easy to do my daily
activities
0.87 Considering how I travel today I am able to live my life as
I want to
0.86 Considering how I travel to day I am able to do all
activities I prefer
0.84 Access to my preferred activities is satisfying considering
how I travel today
0.75
Eigenvalue 2.74
% of variance 76.29
3.2.2 Study objective 2; Comparing residents’ perceived accessibility to the objective accessibility level for the same residential area:
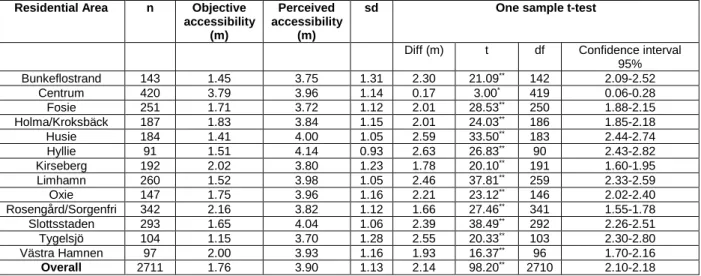
As perceived accessibility (PAC) and objective accessibility were measured on different scales, the PAC scores were initially recalculated to match the scale for the objective accessibility index in order to conduct an appropriate statistical comparison. Scores for the objective accessibility index and recalculated PAC index per residential area are presented below in table 4.
A Pearson correlation initially revealed that the correlation between perceived and objective accessibility was no higher than r =.014 (p=.458), indicating a very weak and non-significant relationship between objectively measure accessibility and perceived accessibility.
In order to examine the potential differences between objective accessibility and
perceived accessibility for each of the residential areas of Malmö, a number of one sample t-tests were conducted. One-sample t-t-tests were chosen as the value for objective
accessibility lacks variance within areas and needs to be treated as a normative value. The t-tests showed that for each of the residential areas, perceived accessibility was significantly higher than objective accessibility, with p-values between p <.001 and p <.005. The results of the t-tests are presented in table 4.
Table 4. One sample t-tests comparing objective and perceived accessibility per residential area and overall in Malmö.
Residential Area n Objective accessibility
(m)
Perceived accessibility
(m)
sd One sample t-test
Diff (m) t df Confidence interval 95% Bunkeflostrand 143 1.45 3.75 1.31 2.30 21.09** 142 2.09-2.52 Centrum 420 3.79 3.96 1.14 0.17 3.00* 419 0.06-0.28 Fosie 251 1.71 3.72 1.12 2.01 28.53** 250 1.88-2.15 Holma/Kroksbäck 187 1.83 3.84 1.15 2.01 24.03** 186 1.85-2.18 Husie 184 1.41 4.00 1.05 2.59 33.50** 183 2.44-2.74 Hyllie 91 1.51 4.14 0.93 2.63 26.83** 90 2.43-2.82 Kirseberg 192 2.02 3.80 1.23 1.78 20.10** 191 1.60-1.95 Limhamn 260 1.52 3.98 1.05 2.46 37.81** 259 2.33-2.59 Oxie 147 1.75 3.96 1.16 2.21 23.12** 146 2.02-2.40 Rosengård/Sorgenfri 342 2.16 3.82 1.12 1.66 27.46** 341 1.55-1.78 Slottsstaden 293 1.65 4.04 1.06 2.39 38.49** 292 2.26-2.51 Tygelsjö 104 1.15 3.70 1.28 2.55 20.33** 103 2.30-2.80 Västra Hamnen 97 2.00 3.93 1.16 1.93 16.37** 96 1.70-2.16 Overall 2711 1.76 3.90 1.13 2.14 98.20** 2710 2.10-2.18 ** p <.001, * p <.005
3.2.3 Study objective 3; Comparing levels of perceived accessibility between different residential areas and between travel modes.
Residential areas:
In order to analyze any differences in perceived accessibility levels between residential areas, an independent one-way Anova was calculated (Fwelch(12,816) = 2.41, p=.004).Since the
variance was unequal in the groups (Levene p=.014), the asymptotic F is reported. A Games-Howell post hoc test revealed significant differences in perceived accessibility only between two residential areas; Hylie and Fosie (p= .041), revealing that between the other 11 residential areas included in this study, there are no significant differences in perceived accessibility. Means and standard deviations are presented in Figure 1.
Figure 1. Means of perceived accessibility per residential area in Malmö (N=2711).
* Significant difference between Hyllie and Fosie (p <.05).
Main travel mode:
To look at differences in perceived accessibility levels between main travel modes, another independent one-way Anova was conducted (Fwelch(4,222) = 8.51, p<.001). As Levene´s test
revealed unequal variance in the groups (p<.001), the asymptotic F is reported. A Games-Howell post hoc test revealed (as can be seen in Figure 2) significant differences in perceived accessibility levels between main travel modes bike and car (p<.001), bike and public transport (p<.001), and bike and other (p<.05), but no differences between the perceived accessibility of walkers and any other travel mode or between drivers (car) and public transport travelers. The mean level of perceived accessibility reveal that individuals using bike or walking as their main travel mode are experiencing the highest accessibility, followed by car-users and public transport travelers respectively.
Figure 2. Means of perceived accessibility per residential area in Malmö (N=2711). 3,75 3,96 3,72* 3,84 4 4,14* 3,8 3,98 3,96 3,82 4,04 3,7 3,93 3,4 3,5 3,6 3,7 3,8 3,9 4 4,1 4,2 Residential area
Bunkeflostrand Centrum Fosie* Holma/Kroksbäck
Husie Hyllie* Kirseberg Limhamn
Oxie Rosengård/Sorgenfri Slottsstaden Tygelsjö
* Significantly different from bike (p <.001).
** Significantly different from car, public transport (p <.001), and other (p <.05). *** Significantly different from bike (p <.001).
4. Discussion
As expected, our results show that there exists a discrepancy between objective accessibility and perceived accessibility. Accessibility as perceived by the residents of Malmö was
significantly higher than the calculated objective accessibility overall, and for each of the residential areas. This implies that a low objective accessibility doesn´t necessarily mean that accessibility is perceived low by the residents, and that perceived accessibility can, and perhaps should, be a valuable contributor in the understanding of accessibility. These findings also confirm previous research results of differences between objectively and subjectively measured accessibility (e.g. Lotfi & Koohsari, 2009; Scott et al., 2007). Our results are important as the exclusion of perceived accessibility when evaluating and planning for accessibility can lead to assumptions of accessibility levels that are not in line with the experiences and perceptions of the individuals that are living in these areas and that are reliant on the transport systems.
Our further analyses revealed significant differences in perceived accessibility between only two of the thirteen residential areas, proposing that perceived accessibility is more stable across urban areas, than is objective accessibility. Given the high rates of
accessibility, these findings infer that individuals across Malmö are satisfied with their daily travel accessibility, regardless of area of residence. Considering the abilities of individuals to think and act in accordance with their environment and travel options, it is likely that most individuals use the transport mode, or combinations of transport modes, that offer them a satisfactory level of accessibility. Hence, even if the objective accessibility is considered low in certain areas, there still exists satisfying options for travel.
The comparison of perceived accessibility levels between transport modes revealed that individuals using bicycles as their main travel mode experience the highest accessibility of all participants in the study. The bicycle users mean level of perceived accessibility was indeed
3,86 4,07 3,96 3,78 3,24 0 0,5 1 1,5 2 2,5 3 3,5 4 4,5
Main travel mode
significantly higher than both car users, public transport users, and those using “other travel modes”. Individuals that are mainly walking perceived their accessibility nearly as high, but with no significant differences to other main travel modes. These results propose that Malmö city planners have been successful in providing accessible routes for active travelers. Car users’ and public transport users’ perceived accessibility levels were both significantly lower than bicycle users´, but level with all other travel modes. These are surprising results, considering the conventional accessibility assumption that the car is the most accessible option (e.g. Lättman, 2016), although consistent with the previous idea that individuals chose the mode most suitable to fulfil their travel needs and preferences.
4.1 The PAC-measure and policy implications
As the modified version of PAC for main travel mode was found psychometrically valid, it can be a valuable contribution to further knowledge of perceived accessibility within and between different groups of people, such as the elderly or others at risk of transport-related social exclusion. It can also contribute to knowledge of the relations between the residents´ perceived possibilities for daily travel and activities, and the objective description of accessibility. This is important as the choices individuals face when deciding how to travel (such as transport mode), and the routes they actually travel, are not captured with
conventional accessibility-measures. We know for instance that conventional accessibility measures, such as objective evaluations of daily travel accessibility, do not capture actual social travel or travel opportunities for social activities, such as visiting friends and family or going to the football field for watching a game or playing with friends. This is especially worrying, as social travel is considered the most important aspect of travel, by the travelers themselves (Titheridge et al., 2010). The Malmö-index for objective accessibility, among others, even omit work-opportunities and alas commuter travel, as these aspects are difficult to capture (Malmö Stad, 2016). These omissions could contribute to the explanation of the differences we found between objective and perceived accessibility, and our results illuminate the need for capturing these aspects of accessibility.
In all, the findings of this paper indicate that it can be beneficial to include perceived accessibility when evaluating accessibility and transportation projects and investments. Not only do objective and perceived accessibility differ significantly, but perceived accessibility may better account for user-perspectives (including social and commuter travel) than can conventional accessibility-measures. Perceived accessibility can also help advance accessibility considerations (e.g. where, when, for whom) and compare impacts of
investments for different groups (Lättman et al., 2016B) and between geographical areas.
4.2 Conclusions and Future research
In summary, the findings of this paper suggest that: individuals use the mode (or combination of modes) of transport that offer satisfactory levels of accessibility. In Malmö, bike users´ display significantly higher perceived accessibility than all other travel modes apart from walking, contrary to beliefs that the car is always the most accessible option for daily travel. We propose that since levels of perceived accessibility may be high despite low levels of objective accessibility, transport and accessibility related investments should not be based on only objective accessibility-evaluations. Including perceived accessibility will provide additional information for more thorough and knowledge based decision-making, that is not
based on a priori assumptions of individual choices of travel destinations and activities. There is also a possibility that objective accessibility fails to capture where people actually travel, or want to travel. We know for instance that objective accessibility doesn´t capture social travel and that Malmö index does not capture commuter-travel. There is also a possibility that other important indicators are omitted by objective measures, but may be captured including evaluations of perceived accessibility.
This study has explored differences between perceived accessibility and objectively measured accessibility in a Swedish urban setting. We welcome future studies to scrutinize our findings and address perceptions of accessibility across demographic groups,
populations in other cities, in rural environments, and in other countries to find out more about perceived accessibility and how it differs from objective accessibility.
Acknowledgements
Financial support was obtained through grant #2014-05335 from the Swedish Governmental Agency for Innovation Systems.
References
Bekiaris, E., & Gaitanidou, E. (2012). Research roadmap towards an accessible public transport system for all. Transport Research Arena 2012, 48, 1274-1283.
doi:10.1016/j.sbspro.2012.06.1103
Budd, J. W., & Mumford, K. A. (2006). Family-friendly work practices in britain: Availability and perceived accessibility. Human Resource Management, 45(1), 23-42.
doi:10.1002/hrm.20091
Byrne, B. M. (2010). Structural equation modeling with AMOS (2nd ed.). London: Routledge.
City of Gothenburg (2014). Accessibility policy (Swedish).
http://goteborg.se/wps/portal/start/kommun-o-politik/hallbar-stad--oppen-for-
varlden/tillganglighet/goteborg--en-tillganglig-stad/!ut/p/z1/04_Sj9CPykssy0xPLMnMz0vMAfIjo8ziQw0NAi2cDB0N3C0DXA0czULdzc3dgo 3dHQ30wwkpiAJKG-AAQOmC3FBFAAGYvik!/dz/d5/L2dBISEvZ0FBIS9nQSEh/
Combs, T. S., Shay, E., Salvesen, D., Kolosna, C., & Madeley, M. (2016). Understanding the multiple dimensions of transportation disadvantage: the case of rural North Carolina. Case Studies on Transport Policy, 4(2), 68-77.
Curl, A., Nelson, J. D., & Anable, J. (2011). Does accessibil-ity planning address what matters? A review of cur-rent practice and practitioner perspectives. Research in Transportation Business & Management, 2, 3-11.
Curl, A. (2013). Measuring what matters: comparing the lived experience to objective measures of accessibility (Doctoral dissertation, University of Aberdeen).
Curl, A., Nelson, J. D., & Anable, J. (2015). Same question, different answer: A comparison of GIS-based journey time accessibility with self-reported measures from the National Travel Survey in England. Computers, Environment and Urban Systems, 49, 86-97.
Curtis, C., & Scheurer, J. (2016). Planning for Public Transport Accessibility: An International Sourcebook. Routledge, London.
Dalton, A. M., Jones, A. P., Panter, J., & Ogilvie, D. (2015). Are GIS-modelled routes a useful proxy for the actual routes followed by commuters?. Journal of transport & health, 2(2), 219-229.
De Vos, J., Schwanen, T., Van Acker, V., & Witlox, F. (2013). Travel and subjective well-being: A focus on findings, methods and future research needs. Transport Reviews, 33(4), 421-442. doi:10.1080/014 41647.2013.815665
Dong, X., Ben-Akiva, M.E., Bowman, J.L., Walker, J.L., 2006. Moving from trip-based to activity-based measures of accessibility. Transp. Res. A Policy Pract. 40 (2), 163–180.
European commission (2015). European Accessibility Act. Employment, social affairs, & Inclusion. Downloaded from:
http://ec.europa.eu/social/main.jsp?catId=1202&langId=en&moreDocuments=yes Farrington, J. (2007). The new narrative of accessibility: Its potential contribution to discourses in (transport) geography. Journal of Transport Geography, 15(5), 319-330. doi:10.1016/j.trangeo.2006.11.007
Farrington, J., & Farrington, C. (2005). Rural accessibility, social inclusion and social justice: Towards conceptu-alisation. Journal of Transport Geography, 13(1), 1-12.
doi:10.1016/j.jtrangeo.2004.10.002
Geurs, K. T., & Ritsema van Eck, J. R. (2001). Accessibility measures: review and
applications. Evaluation of accessibility impacts of land-use transportation scenarios, and related social and economic impact.
Gorsuch, R. L. (1997). Exploratory factor analysis: Its role in item analysis. Journal of personality assessment, 68(3), 532-560.
Hanson, S., & Schwab, M. (1987). Accessibility and intraurban travel. Environment and Planning A, 19(6), 735-748.
Hui, V., & Habib, K. N. (2014). An investigation of transport-related social exclusion of the at-risk community (homeless people) in Toronto, Canada. In Transportation Research Board 93rd Annual Meeting (No. 14-1575).
Kwan, M. P. (1998). Space‐time and integral measures of individual accessibility: a
Lotfi, S., & Koohsari, M. J. (2009). Analyzing accessibility dimension of urban quality of life: Where urban designers face duality between subjective and objective reading of place. Social Indicators Research, 94(3), 417-435.
Lucas, K., Wee, B., & Maat, K. (2016). A method to evaluate equitable accessibility: combining ethical theories and accessibility-based approaches. Transportation, 43(3), 473-490.
Lättman, K (2016). Perceived Accessibility: capturing the traveler perspective. Licentiate Thesis (2016:33), Karlstad University Studies.
Lättman, K., Friman, M., & Olsson, L. E. (2016A). Perceived Accessibility of Public Transport as a Potential Indicator of Social Inclusion. Social Inclusion, 4(3), 36-45.
Lättman, K., Olsson, L. E., & Friman, M. (2016B). Development and test of the Perceived Accessibility Scale (PAC) in public transport. Journal of Transport Geography, 54, 257
Lättman (2017).Book review: Planning for Public Transport Accessibility: an international sourcebook. By Curtis, C. and Scheurer, J. (2016). London: Routledge. £ 76.50 (hardback) £ 24.49 (e-book). ISBN: 978-1472447241. Journal of Transport Geography (in press).
Malmö Stad (2016). Sustainable Urban Mobility Plan.
http://malmo.se/download/18.16ac037b154961d0287384d/1491301288704/Sustainable+urb
an+mobility+plan%28TROMP%29_ENG.pdf
Morris, J. M., Dumble, P. L., & Wigan, M. R. (1979). Accessibility indicators for transport planning. Transportation Research Part A: General, 13(2), 91-109.
Olsson, L. E., Gärling, T., Ettema, D., Friman, M., & Fujii, S. (2013). Happiness and satisfaction with work commute. Social indicators research, 111(1), 255-263.
Parkhurst, G., & Meek, S. (2014). The effectiveness of park-and-ride as a policy measure for more sustainable mobility. In Parking Issues and Policies (pp. 185-211). Emerald Group Publishing Limited.
Ryan, M., Lin, T. G., Xia, J. C., & Robinson, T. (2016). Comparison of perceived and measured accessibility between different age groups and travel modes at Greenwood Station, Perth, Australia. EJTIR, 16(2), 406-423.
Scheepers, C. E., Wendel-Vos, G. C. W., van Kempen, E. E. M. M., de Hollander, E. L., van Wijnen, H. J., Maas, J., ... & van Wesemael, P. J. V. (2016). Perceived accessibility is an important factor in transport choice—results from the AVENUE project. Journal of Transport & Health, 3(1), 96-106.
Scheurer, J., & Curtis, C. (2007). Accessibility Measures: Overview and Practical applications. Working paper no. 4, Curtin University of Technology.
Schwanen, T., Lucas, K., Akyelken, N., Solsona, D. C., Carrasco, J. A., & Neutens, T.
(2015). Rethinking the links between social exclusion and transport disadvantage through the lens of social capital. Transportation Research Part A: Policy and Practice, 74, 123-135.
Scott, M. M., Evenson, K. R., Cohen, D. A., & Cox, C. E. (2007). Comparing perceived and objectively measured access to recreational facilities as predictors of physical activity in adolescent girls. Journal of Urban Health, 84(3), 346.
Shay, E., Combs, T. S., Findley, D., Kolosna, C., Madeley, M., & Salvesen, D. (2016). Identifying transportation disadvantage: Mixed-methods analysis combining GIS mapping with qualitative data. Transport Policy, 48, 129-138
Siegel, M. S. (2016). Quantifying Transit Access in New York City: Formulating an
Accessibility Index for Analyzing Spatial and Social Patterns of Public Transportation. CUNY Academic Works. http://academicworks.cuny.edu/hc_sas_etds/76
Stanley, J., Stanley, J., Vella-Brodrick, D., & Currie, G. (2010). The place of transport in facilitating social inclusion via the mediating influence of social capital. Research in Transportation Economics, 29(1), 280-286.
Titheridge, H., Mackett, R., & Achuthan, K. (2010). A comparison of accessibility as measured by planners and accessibility as experienced by older people and those with disabilities. In The 12th International Conference on Mobility and Transport for Elderly and Disabled Persons. (TRANSED 2010)
Trivector (2013). A Normative Index for Sustainable Accessibility in Malmö. Report 2013:96, version 1.0.
Tobias, M. S. G., & Ferreira, É. F. B. (2014). Perception of health and accessibility: an approach to support projects for urban public spaces. Journal of Transport Literature, 8(1), 24-51.
van Wee, B. (2016). Accessible accessibility research challenges. Journal of transport geography, 51, 9-16.
Ziegler, F., & Schwanen, T. (2011). 'I like to go out to be energized by different people': an exploratory analysis of mobility and wellbeing in later life. Ageing and Society, 31(5), 758.