UCRL-PROC-229217
Tool Support for Inspecting the
Code Quality of HPC
Applications
T. Panas, D. Quinlan, R. Vuduc
March 19, 2007
Int'l Conf. on Software Engineering (ICSE), Workshop on
Software Engineering for High-Performance Computing
(SE-HPC)
Minneapolis, MN, United States
May 20, 2007 through May 26, 2007
Disclaimer
This document was prepared as an account of work sponsored by an agency of the United States
Government. Neither the United States Government nor the University of California nor any of their
employees, makes any warranty, express or implied, or assumes any legal liability or responsibility for
the accuracy, completeness, or usefulness of any information, apparatus, product, or process
disclosed, or represents that its use would not infringe privately owned rights. Reference herein to any
specific commercial product, process, or service by trade name, trademark, manufacturer, or otherwise,
does not necessarily constitute or imply its endorsement, recommendation, or favoring by the United
States Government or the University of California. The views and opinions of authors expressed herein
do not necessarily state or reflect those of the United States Government or the University of California,
and shall not be used for advertising or product endorsement purposes.
Tool Support for Inspecting the Code Quality of HPC Applications
Thomas Panas
Dan Quinlan
Richard Vuduc
Center for Applied Scientific Computing
Lawrence Livermore National Laboratory
P.O. Box 808, L-550
Livermore, California 94551, USA
{
panas2, dquinlan, richie
}
@llnl.gov
Abstract
The nature of HPC application development encourages
ad hocdesign and implementation, rather than formal re-quirements analysis and design specification as is typical in software engineering. However, we cannot simply expect HPC developers to adopt formal software engineering pro-cesses wholesale, even while there is a need to improve soft-ware structure and quality to ensure future maintainability. Therefore, we propose tools that HPC developers can use at their discretion to obtain feedback on the structure and quality of their codes. This feedback would come in the form of code quality metrics and analyses, presented when necessary in intuitive and interactive visualizations. This paper summarizes our implementation of just such a tool, which we apply to a standard HPC benchmark as “proof-of-concept.”
1. Introduction
Software engineering processes are not commonly ap-plied to high-performance computing (HPC) application de-velopment for several reasons [4, 9, 11]. First, developers may focus on performance over other aspects of the code, such as those that would ease future maintenance. Secondly, the developer could be the application’s sole customer, at least initially; thus, there may be little motivation to think about how to use, maintain, adapt, or extend an applica-tion beyond its initial use. Thirdly, many HPC developers are not formally trained in software engineering processes; development proceeds in anad hocmanner, possibly with-out requirements engineering, design plans, or documen-tation. Collectively, these aspects of HPC software imply high development and maintenance costs during a software system’s lifetime.
However, it is unrealistic to expect sudden widespread changes in the HPC applications development process [4].
Instead, we envision the creation of tools to help commu-nicate software maintainability, component reusability, and code quality aspects of HPC software to developers during code development. These tools would provide such feed-backunobtrusively,i.e., in a way that allows the developer to decide how best to make trade-offs between the perfor-mance and maintainability of their software. Moreover, by providing the right kinds of analyses and visualizations, these tools could even aid in restructuring and improving code during forward-engineering.
This paper summarizes our on-going implementation of just such a tool for large-scale C and C++ applications. Our code quality feedback tool, which we implemented by combining a number of other tools as described in Sec-tion 3, does not enforce particular design or development formalisms or processes [5]; rather, it provides information and guidance in the form of specific code quality metrics. Moreover, our tool can provide this information in the form of interactive visualizations when appropriate, e.g., when trying to understand whether the overall software architec-ture matches the developer’s mental model, or whether a subset of files or functions could be easily extracted as a reusable component.
We provide concrete examples of the analyses our tool produces in Section 2. These examples come from apply-ing our tool to an actual HPC benchmark, SMG2000 [1]. Section 3 describes our tool’s implementation. We hope this paper will stimulate discussion on the role of interactive feedback about code quality during HPC application devel-opment, with our tool serving as a constructive example of what is possible.
2. Code Quality Metrics and Analyses
Our tool presents the user with a variety of code quality metrics and analyses, of which this section provides con-crete examples. Except where noted, we generated these
Property Value Remark
#LOC (estimate) 46,000 based on AST size #LOC (wc) 28,301 w/o external libs #Files 71 source and header #Files (Source) 53
#Files (Header) 18 #AST NODES 515,030
#AST NODES 858,660 (with ext lib) #CLASSES 0
#STRUCTS 33 #UNIONS 1
#FUNCTIONS 394 SMG2000 only #FUNCTION CALLS 1,268
Table 1. Simple global statistics
Property Value Remark #VAR LOCAL 3726
#VAR MEMBER 0 #VAR MEMBER PUBLIC 0 #VAR MEMBER STATIC 0 #VAR MEMBER STRUCT 245 #VAR MEMBER UNION 2
#VAR NON MEMBER 2 globals #VAR NON MEMBER STATIC 5 file access
Table 2. Variable statistics
examples by applying our tool to SMG2000, an 50k lines-of-code parallel HPC benchmark implementing the semi-coarsening multigrid method [1].
We organize these examples into three categories (Sec-tions 2.1–2.3), in increasing order of “context” about the code that each requires. Roughly speaking, the more con-text needed to understand a metric or analysis, the better suited it is to either static or even interactive visualization.
2.1. Simple statistics
Our tool provides many metrics and analyses that can be represented simply as a single number or short textual list, such as the lines of code, the number of global variables, or the number of function calls (measured statically), among others. Tables 1–3 show several examples.
The statistics computed in Table 3 are among the most interesting of the simple statistics. For instance, our tool can check for certain kinds of security violations related to API misuse1 and reports McCabe’s cyclomatic complexity
(“CC”) [6]. Where appropriate, the user may select partic-ular thresholds on these statistics, and the tool will report violations accordingly.
1E.g., using the C functionsprintfrather than the safersnprintf.
Analysis Threshold #Violations Security 0 4 CC per function <20 20 CC per file <100 4 Global Variable 0 2 LOC (per function) <200 19 Cyclic dependency (funcs) 0 3 Cyclic dependency(files) 0 1 Naming >3 char 53
TOTAL 106
Table 3. Simple analysis results
2.2. Coherence reporting
In addition to the simple statistics of Section 2.1, our tool can report coherences. Our tool presents this category of information in the form of static pictures, to help illustrate interesting context.
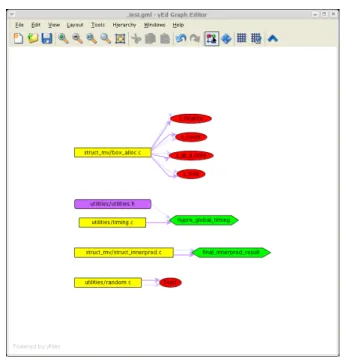
Figure 1. Variable access graph.
For example, consider the variable access graph in Fig-ure 1, which shows coherences between global variables (ovals and hexagons) and the source files which reference them (boxes) as edges. Figure 1 reveals the existence of two global variables (hexagons), and five file-scoped variables (i.e., variables declared asstaticin a file’s global scope).
The two true global variables are each used only within a single source file,2 and therefore could be eliminated by
2One of the variables,hypre global timing, appears in a header file as well, but only when conditionally compiled for inclusion within the corresponding source file shown.
converting them to be, for instance, file-scoped variables instead. However, whether or not to do this is up to the developer; our tool only reveals this opportunity.
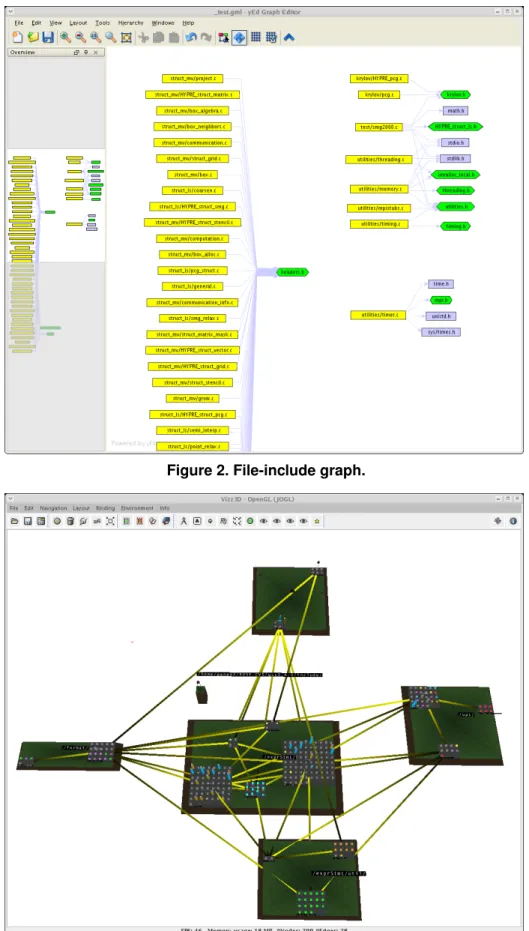
As another example, consider the file-include graph for SMG2000 shown in Figure 2, which shows coherences be-tween source files (yellow boxes) and header files, where we distinguish between the program’s header files (green boxes) and system headers (grey boxes). A developer could use this image to determine, for instance, whether there is unwanted sharing of header files between logically distinct components. (No such cases are shown in this figure.)
2.3. Interactive visualizations
In some cases, text dumps and even static pictures might not illuminate issues to the developer. Our tool can pro-vides interactive 3-D visualizations for such information, and we use familiar visual metaphors from the real-world to aid program comprehension and understanding in these visualizations.
For example, consider the image of the project file struc-ture depicted in Figure 3, which is a snapshot taken of the tool while running on a sub-module of ROSE, the compiler infrastructure that constitutes the front-end of our tool (see Section 3.1). Such an image gives a developer a sense of the overall software architecture. The five directories of this sub-module appear as five “islands,” individual files as “cities” within the island, and individual function defi-nitions as “buildings.” In addition, aggregate shaded edges between cities indicates that some function in one file (yel-low end) calls some function in another file (dark end). Other user-selected metrics and static or dynamic analyses may be rendered as textures, colors, and icons in this view (not shown; these elements appear when zooming in to view structures more closely than shown in Figure 3).
From Figure 3, a developer can quickly see whether his logical concept of components in the system holds. For in-stance, the leftmost island has only incoming edges, imply-ing that it is indeed a reusable component. If the developer decides to make changes to the system to improve the qual-ity or component structure, he can compare old and new visualizations to make a quick judgement. Indeed, we used our tool in this interactive fashion to create new, reusable components for this sub-module of ROSE.
3. Tool Implementation
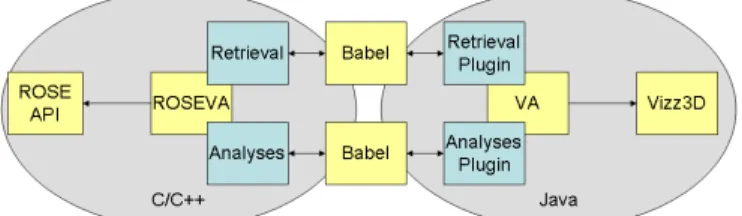
We built our visualization system by combining the tools shown in Figure 4. We use ROSE [10] as the C++ front-end. ROSEVA extends the ROSE API for use within the VizzAnalyzer framework [8, 12]. ROSEVA has two main interfaces, one for the parsing of C/C++ code (source re-trieval and AST construction) and one for high level
anal-yses. Since ROSE and ROSEVA are developed in C/C++ and VizzAnalyzer in Java, we use Babel [3] to connect these worlds. Finally, we use Vizz3D [7] to visualize the results.
3.1. ROSE
ROSE is an open infrastructure for building compiler-based source-to-source analysis and transformation tools. For C and C++, ROSE fully supports all language features, preserves all source information for use in analysis, and permits arbitrarily complex source-level translation via its rewrite system. Although research in the ROSE project em-phasizes performance optimization, ROSE contains many of the components common to any compiler infrastructure, and thus supports the development of general source-based analysis and transformation tools.
3.2. ROSEVA
ROSEVA has been designed as a library using the ROSE API. ROSEVA has two interfaces that VizzAnalyzer ac-cesses via Babel:retrievalandanalysis. The retrieval takes the files to be parsed by ROSE as input and constructs in-ternally an AST representation of the C/C++ source files. For user interaction, selected graphs are returned to Vizz-Analyzer. These results can be visualized directly or further inspected with additional analyses.
Therefore, ROSEVA provides a second interface allow-ing VizzAnalyzer to access a variety of analyses on any graph produced by the frontend. Analyses results, such as CC or LOC, are fed back directly as properties to the Vizz-Analyzer. These properties are used by the VizzAnalyzer to flexibly visualize any kind of program information.
3.3. Babel
Babel is a tool for mixing C, C++, Fortran77, Fortran90, Python, and Java in a single application. Babel is the foun-dation for a multi-language scientific component frame-work. Babel addresses the language interoperability prob-lem using Interface Definition Language (IDL) techniques. In particular, Babel uses a Scientific Interface Definition Language (SIDL) that addresses the unique needs of par-allel scientific computing.
3.4. VizzAnalyzer
The VizzAnalyzer framework is our composition system for reverse engineering, supporting the rapid composition of individual software reverse engineering tools by reusing ar-bitrary reverse engineering components. VizzAnalyzer dis-tinguishes two domains: Program retrieval and analysis are
Figure 2. File-include graph.
part of thesoftware analysis domain and program visual-ization is part of theinformation visualization domain[8]. Each domain operates on its own program model. For in-stance, a model for software analysis may contain informa-tion about a program’s clusters, metrics, cycles,etc., while a model for information visualization contains information about the visualization of a program, such as the position or color of entities. VizzAnalyzer allows the merging of tools from both domains.
3.5. Vizz3D
Vizz3D is a 3D information visualization system. It presents system structure and quality information to a user in a comprehensible way and leverages the understanding of that system. Vizz3D is highly flexible and allows users to define and re-assign layout algorithms and metaphors at run-time. Hence, visualizations can be online-configured. This also enables an interactive and iterative software anal-ysis, where appropriate views are created on demand.
Figure 4. Visualization Tool Architecture
4. Summary and Future Work
In our on-going research, we are continuing to extend and to evaluate our code quality feedback tool by working with development teams. Work in the latter area is of course critical to determining just how useful our approach could be, particularly for the common development practices of HPC applications [4].
The current version of our tool reports on a broad collec-tion of metrics and analyses. Moreover, these reports (tex-tual, static image, and interactive visualization) can include a variety of metrics of specific interest to HPC developers. For instance, we can report static counts of floating point operations within each function, or any hardware processor counts collected at run-timeviaan interface in ROSE to the HPCToolkit [2], though we did not show these in our exam-ples. We are also implementing analyses to extract reposi-tory information,e.g., from CVS. We are actively extending the metrics and analyses.
References
[1] The SMG2000 Benchmark, 2001. http://www.llnl.gov/asci/platforms/purple/rfp/benchmarks. [2] HPCToolkit, 2004. http://www.hipersoft.rice.edu/hpctoolkit/index.html. [3] Babel, July 2006. http://www.llnl.gov/casc/components/babel.html.[4] J. Carver, L. Hochstein, R. Kendall, T. Nakamura, M. Zelkowitz, V. Basili, and D. Post. Observations about software development for high-end computing. CTWatch: Special Issue on HPC Productivity, October 2006.
[5] C. Larman and V. R. Basili. Iterative and incremental de-velopment: A brief history. IEEE Computer, 36(6):47–56, June 2003.
[6] W. Li and S. Henry. Maintenance metrics for the object ori-ented paradigm. InIEEE Proceedings of the 1st Interna-tional Software Metrics Symposium, May 1993.
[7] W. L¨owe and T. Panas. Rapid construction of software com-prehension tools. International Journal of Software Engi-neering and Knowledge EngiEngi-neering, December 2005. [8] T. Panas. A Framework for Reverse Engineering. PhD
thesis, Department of Computer Science, V¨axj¨o University, Sweden, December 2005.
[9] D. E. Post and R. P. Kendall. Large-scale computational sci-entific and engineering project development and production workflows. CTWatch: Special Issue on HPC Productivity, October 2006.
[10] M. Schordan and D. Quinlan. A source-to-source architec-ture for user-defined optimizations. InProc. Joint Modular Languages Conference, 2003.
[11] S. Squires, M. L. V. D. Vanter, and L. G. Votta. Software productivity research in high-performance computing. CT-Watch: Special Issue on HPC Productivity, October 2006. [12] VizzAnalyzer. Available at:http://www.arisa.se/,
2006.
This work was performed under the auspices of the U. S. Department of Energy by University of California, Lawrence Livermore National Laboratory under contract W-7405-Eng-48.