Tangible User Interfaces as a Pathway for Information Visualisation for
Low Digital Literacy in the Digital Humanities
Javier Pereda* Bangor University Patricia Murrieta-Flores† University of Chester Panagiotis D. Ritsos‡ Bangor University Jonathan C. Roberts§ Bangor University ABSTRACT
Information visualisation has become a key element for empower-ing users to answer and produce new questions, make sense and create narratives about specific sets of information. Current tech-nologies, such as Linked Data, have changed how researchers and professionals in the Humanities and the Heritage sector engage with information. Digital literacy is of concern in many sectors, but is especially of concern for Digital Humanities. This is due to the fact that the Humanities and Heritage sector face an important division based on digital literacy that produce gaps in the way research can be carried out. One way to overcome the challenge of digital literacy and improve access to information can be Tangible User Interfaces (TUIs), which allow a more meaningful and natural pathway for a wide range of users. TUIs make use of physical objects to interact with the computer. In particular, they can facilitate the interaction process between the user and a data visualisation system. This position paper discusses the opportunity to engage with Digital Hu-manities information via TUIs and data visualisation tools, offering new ways to analyse, investigate and interpret the past.
Keywords: Human Information Interaction, Human Computer Interaction, Digital Humanities, Tangible User Interfaces
Index Terms: H.5.2 [Information Interfaces and Presentation]: User Interfaces—Interaction styles;
1 INTRODUCTION
Heritage organisations and museums among others, have been pushed in the last decade to adopt Semantic Web and Web technolo-gies among others. Such adoption, can take place as a sustaining or disruptive process [26]. Examples of this can be seen in the way the Digital Humanities use digital technologies (e.g., GIS, photogram-metry) to carry out research. Such technologies have shifted the way in which humanists and other researchers face challenges in their disciplines. Consequently, they are now, also, facing changes in their curriculum, working methodologies and organisational culture. For example, there has been arguments of how technology should push for a change in the scholarship and methodologies used and produced in Humanities research, beyond just using computers to perform a specific task such as tagging, writing, or searching [13]. Such disruption in the Humanities and the Heritage sector, arguably separates these professionals and audiences into two groups: the people that work with technology, and the people who do not. This produces an important gap in Humanities scholarship, since there are many technologies, commonly used by digital humanists, that can facilitate engagement and enable us to raise, and answer, new questions that were impossible to pose before.
*e-mail: [email protected] †e-mail: [email protected] ‡e-mail:[email protected] §e-mail: [email protected]
Usually, conveying information through a computer takes place through an interactive visualization system. Users are presented with data, and the system provides them interactive tools through which to add meaning, so they can transform it to information, and eventually knowledge. For users to engage with such information, they need to have a particular set of skills:technicalandcognitive. Data visualization and information engagement can facilitate this process. Many humanists, academics and users with low digital literacy are trying to keep up to date, while others are becoming avid technology users. Terms such as thesuper-humanist[5], have been coined to describe specialists within their fields (e.g., Medieval Stud-ies, Modern Literature) that also have the digital skills to produce algorithms, semantic databases, and complex automated analyses.
This observation motivates the main question we discuss in this paper: How can we use visualisation and interaction technologies (such as tangible interfaces shown in Figure 1, discussed here) to bridge the gap between scholars with different levels of digital liter-acy, in terms of engagement and making sense of digital information? How can we extend existing systems with visualisations in order to ameliorate the engagement with digital content, especially for humanists and users with low digital literacy and digital humanists alike? In this paper we discuss some considerations towards answer-ing these questions. The structure of this paper is: Section 2 looks into information exploration practices in Digital Humanities and presents the challenges for low digital literacy researches to engage with it. Section 3 discusses how TUIs can enhance data visualization tools to empower a wider range of users to perform more complex tasks.
2 A NEWWAYFORWARD THROUGHVISUALISATION
Regardless of how digital information is delivered, engaging with it has to be done through an interactive system. Human Computer Interaction (HCI) and specialist areas such as Tangible and Embod-ied Interaction have explored how Human Information Interaction (HII) can be used within the Heritage sector and Digital Humanities. Tangible User Interfaces (TUI) can facilitate the engagement with complex datasets [45], as well as reducing the complexity of an in-teractive system [4, 20]. We advocate that visualisation services and
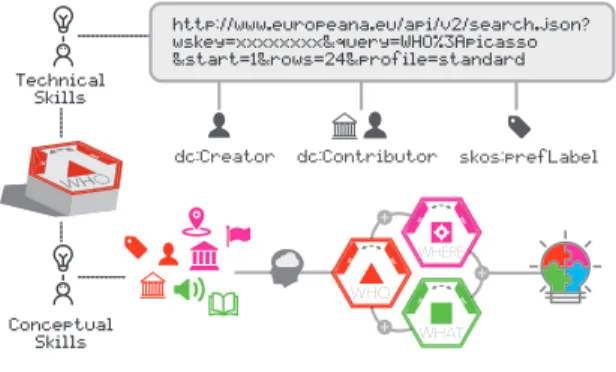
http://www.europeana.eu/api/v2/search.json? wskey=xxxxxxxx&query=WHO%3Apicasso &start=1&rows=24&profile=standard dc:Creator Technical Skills Conceptual Skills dc:Contributor skos:prefLabel
products can aid with the qualitative or quantitative decision making process [16] in Humanities. Visualisation, along with techniques such as data mining, cluster analysis, machine learning and text analytics enable users to analyse and query complex datasets [29]. Nonetheless, for these techniques to have wider adoption, users need to have technologic, technical and cognitive skills to use and apply them. In simple words, we should not expect general users (and some experts) to use regular-expressions or complex string of queries and parameters, when the vast majority of their searches on the Web are limited to no more than two keywords [17, 18, 21, 22, 44]. Visu-alization systems can facilitate the production of narrative through visual depictions, as well as provide the tools to raise more specific queries on the data. But as mentioned before, visualization processes have to be tied to the possible transactions that users are meant to perform on the system. Figure 2, presents a query produced by a user with low digital skills through a TUI. The query implements diverse data fields, logic operators and keywords. This approach, can enable the technologic (e.g. scripting languages), technical (e.g. data fields, operators) and conceptual skills (e.g. logic, formulation) to carry out query transactions on the knowledge system.
Figure 2: Complex query produced by a non digital expert through Pereda’s [34] TUI Query System
There is a wide range of visualisation interfaces that have aimed to facilitate such engagement in the Humanities. For example, with the Mandala Browser [12, 40] the user loads an XML encoded document of a play (e.g., Romeo and Juliet) and coloured dots appear around the periphery. The user can produce queries by joining these different dots, while visual links will show their relationship. Although the interface provides a meaningful approach for rich prospect browsing, to make sense of the visual relationships, users need to know beforehand what is the text about. In addition, although the system allows XPath queries, it is is unlikely that non-super-humanists will have the skills make them.
Visualisations can help audiences make sense of the information they are looking at through graphic narratives. They can be used to understand social and ethnographic relationships, or used to help users to understand the relationships of characters in a story (e.g., Mandala Browser). They can also be used to explain how informa-tion relainforma-tionships take place through visualisainforma-tion systems such as the ‘Citation Map’ Panels of Web of Science [39], or meaning of Congregational legislation bills through machine learning such as the ‘Many Bills’ visualisation by IBM [3]. However, data visual-ization can also undergo a data physicalvisual-ization citeJansen2015 by embodying the data. Data physicalization can enhance the user-data transactions through perceptual exploration, data accessibility and
engagement. Nevertheless, there is still a long way to go in terms of understanding how much interactive systems influence, or maybe even hinder the sense making process facilitated by the visualisation. Regardless of how information is coded (e.g. data vis/phys), users will still need to negotiate around it. TUIs can provide the embodied cognition to encode the data and provide the interaction affordances to perform such data transactions (e.g. querying).
When working with large and complex datasets, users need the technologic, technical and conceptual empowerment to engage with them. For example, Semantic Web technologies have enabled Her-itage organisations to create cross-domain and more explicit descrip-tions about objects in their collecdescrip-tions. It is this way that many or-ganisations interlink their knowledge with diverse domains through publishing in Linked Data format, such as Europeana, which gathers billions of records from over 3,000 organizations across Europe [10], or the British Museum which holds over 2,000,000 objects from 2,334,592 records [7]. Despite that Semantic Web technologies have eased such conceptualisation of collections, at least from a comput-ing approach, the process of produccomput-ing an aided narrative is still tied to the way people explore and visualize the information. This is to say that users will still need to understand how information is struc-tured, the particular data model, and particularly how to manipulate and explore it.
Information systems need the structure and the freedom to ex-plore through their own perspective. TUIs build up form epistemic activities by linking abstract and concrete concepts citeBakker2012. Manovich [30] described a view where narrative and databases are completely incompatible, since databases represent the world as lists of items. Alternatively, Semantic Web technologies and the use of ontologies, can be are used to describe the world [14, 15], thus challenging Manovich’s approach, thus providing a more or-ganic engagement with the information. However, in the case of Linked Data knowledge graphs, to fully conceptualise something, users are required to access the information and data to interpret it themselves, as the system cannot explain something, unless the users know what they are looking at (See Figure 3). Therefore, it is unrealistic to expect users to fully engage with data models, heritage collections, and descriptions of objects only through visual narratives and without the engagement of deeper levels of the data. TUIs can promote experimentation through Piagetian learning by exploiting sensory-motor and bodily patterns [1, 37, 50], that can promote both freedom and structure to explore through different levels of complexity with such data systems.
Figure 3: Europeana Data Model Event Oriented Ontology Example of Description
On one hand, visualisation approaches help users to engage with the information in different contexts, such as: Personal(e.g., “I wonder”),Stakeholder(e.g., user needs to know),Audience(e.g., user must need to know),Anticipated(e.g., might be interesting to know) andPotential(e.g., it might be interesting to know) [25].
On the other hand, users will base their information navigational strategies based on their level of need of information [32] as defined by Taylor [48]:Visceral, which appears as users realises their need to know something,Conscious, which arises once the person realized they needed to know something, Formalised, where a user will know how to formulate a question andCompromised where the user is able to express the information through the specific terms and qualifications of the information system (e.g., query language, data model). This portrays a landscape of different skills that user will be expected to have in order to perform data transactions based on their information need and context. Information engagement systems require to help build an understanding of the information (e.g. data models, values), as well as the possible transactions (e.g., querying, filtering) and the background in which these take place. It is through in the intersection of visualisation (context) and interaction (transactions) that users are empowered to understand what to ask and how to ask for it. This presents a challenging scenario for non-super humanists and low digital literacy users, where they are expected to engage with the logic, conceptualisation or sense making of a particular field of study as well as understanding how the interactive system is able to produce a meaningful data narrative for them.
3 VISUALIZATION ANDINTERACTIVESYSTEMS
Since Kay’s inception of the Graphical User Interface (GUI) [41], the computer has become more accessible and people are producing new interactions with information, systems and even other people. Nowadays, GUIs are so widespread that they have become the stan-dard way to engage with these interactions. Arguably, visualisation research has been constrained to these GUI techniques based by using small screens, clicking, selecting and dragging within a two-dimensional space [28]. This pixel limitation can hinder the engage-ment with the data [23]. Alternatively, early works by Perlman [36], Papert [33], Fitzmaurice [11] and Ishii [20] have challenged how we interact with the computer by bringing it “back to the real world” by using physical objects to interact with the computer through Tangible User Interfaces (TUI).
TUIs can enhance the way in which information is visualized (physicalization) and explored, especially within the different con-texts and levels of need of information, where the user will require deeper stages of interaction with the information system (e.g. data fields). In the specific case of the Digital Humanities, this remains a key problem due to the marked division between the diverse lev-els of digital literacy and digital generations, and the technical and technologic complexity behind data transactions. Arguably, TUIs can promote such empowerment among the non-super-humanists and general audiences. TUIs can help with the system’s perfor-mance through physical activities [31] and reduce the interaction complexity [4, 20]. TUIs can also aid in the exploration of infor-mation by exploiting sensory-motor and bodily patterns [2, 38, 50]. Finally, TUIs can help making sense of complex sets of informa-tion by producing direct affordances on how informainforma-tion can be manipulated [43, 49], even among children [46].
TUIs have been used to perform data transactions and data visual-izations to facilitate research, narrative and DH analytic approaches. For example, the Metatation system [6], which aims to ease literary criticism such as close reading, linked to slow analytical processes. This was done by using a digital pen, paper and a visualization out-put of the annotated texts. Making sense of the information system and the particular transactions that can be performed on it can be a challenging task. Nevertheless, examples of Tangible Query [42], Tangible Atoms [47], and Ullmer and Ishiis Token and Constrain TUI approaches [49] show how information from databases can be easily explored and manipulated through TUIs. In addition, Her-itage organisations with large sets of data and that commonly use Semantic Web technologies, have particular ontological
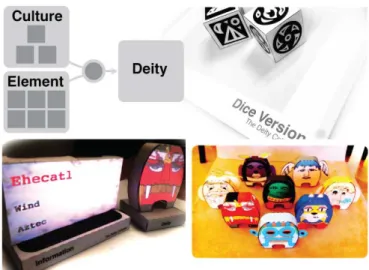
informa-Figure 4: Deity Collector. An example of a downladable TUI to pro-mote distribution. Users make combinations of concepts to produce a deity depiction, which papercraft versions can also be printed.
tion structures that users should arguably know, or be aware of, in order to engage with the full complexity of the information (e.g., Europeana Data Model, CIDOC CRM). An example of access to large datasets is the mARChive [24], a mega-display data browser that enables the exploration of 80,000 records. Other systems such as Navigational Blocks [8], CubeQuery [27] and Stackables [19], present the opportunity to engage with the data through diverse query facets. In addition, such systems provide users the engagement with data fields, data types, values and logic. Nevertheless, TUI research is still on its infancy and despite the benefits shown by previoius research, there is still much work to be carried out to integrate hu-man behaviour within interactive systems so they can become part of our everyday life. Examples, such as the Deity Collector [35] and dTouch [9], present the the opportunity to widely distribute TUI systems on the Web (Figure 4), thus advocating for a wider adoption. For example, the TUI Query System for Europeana [34] (Figure 2), builds upon providing access to TUI tools that can also enable the production of complex queries that use data fields, logic operators and multiple keywords.
4 CONCLUSION
The role of interactive systems and the way in which they are de-livered to the user can have a strong impact on the effectiveness of the information visualisation. The Humanities and the Heritage sector are facing novel challenges due to the complexity and amount of information they have available, that can be used to produce new research questions and interpretations. Databases, corpora and digitally-born collections (e.g. digital media, metadata) are becom-ing more widespread, and these are increasbecom-ingly also necessary to produce narratives and explorations for research. Although the adop-tion of Semantic Web technologies across the Humanities and the Heritage sector has enhanced the quality of the information and enabled its cross-domain implementation, it has also highlighted the technologic, technical, and conceptual challenges for non-digitally avid users to make use of it.
While visualisation systems have aimed to present information in a way that enables audiences to produce and answer research questions, there are still user needs that require them to engage with more low-level elements of the information system such as data fields and logic operators. TUIs can facilitate such engagement with the visualization system and the data as well, particularly among
low digital literacy users. In the case of the Digital Humanities, the intersection of Visualisation and TUIs can clear the pathway for more meaningful production of narratives from information. This means that TUIs can enable non-experts and experts alike to make sense of what the information is about, how it is organised, and how they can use the specific system to make and develop further questions.
REFERENCES
[1] M. L. Anderson. Embodied cognition: A field guide.Artificial intelli-gence, 149(1):91–130, 2003.
[2] M. L. Anderson. Embodied Cognition: A field guide.Artificial Intelli-gence, 149(1):91–130, 2003. doi: 10.1016/S0004-3702(03)00054-7 [3] Y. Assogba, I. Ros, J. DiMicco, and M. McKeon. Many bills: engaging
citizens through visualizations of congressional legislation. In Pro-ceedings of the SIGCHI Conference on Human Factors in Computing Systems, pp. 433–442. ACM, 2011.
[4] S. Bakker, A. N. Antle, and E. van den Hoven. Embodied metaphors in tangible interaction design. Personal and Ubiquitous Computing, 16(4):433–449, 2012. doi: 10.1007/s00779-011-0410-4
[5] L. Bassette. Challenges in the Digital Humanities. Higher Education Blogs [Online]. Available: https://www. insidehighered.com/blogs/college-ready-writing/
challenges-digital-humanities, 2012. [Accessed:
20-July-2017].
[6] A. J. Bradley, M. H. Hrim Mehta, and C. Collins. Visualization, Digital Humanities, and the Problem of Instrumentalism. 2016.
[7] British Museum. British Museum Collection Database. British Museum [Online]. Available: http://www.britishmuseum.org/ research/collection_online/search.aspx, 2014. [Accessed: 20-July-2017].
[8] K. Camarata, E. Y.-L. Do, M. D. Gross, and B. R. Johnson. Naviga-tional Blocks: Tangible Navigation of Digital Information.Proceedings of the 7th international conference on Intelligent user interfaces. ACM, pp. 31–38, 2002.
[9] E. Costanza, M. Giaccone, O. Kung, S. Shelley, J. Huang, and Acm. Ubicomp to the Masses: A Large-scale Study of Two Tangible Inter-faces for Download. Ubicomp 2010: Proceedings of the 2010 Acm Conference on Ubiquitous Computing, pp. 173–182, 2010.
[10] Europeana. Why become a Data Provider? British Museum [On-line]. Available:http://pro.europeana.eu/share-your-data/ become-a-data-provider, 2013. [Accessed: 20-July-2017]. [11] G. W. Fitzmaurice, H. Ishii, and W. A. S. Buxton. Bricks: laying
the foundations for graspable user interfaces. InProceedings of the SIGCHI conference on Human factors in computing systems, pp. 442– 449. ACM Press/Addison-Wesley Publishing Co., 1995.
[12] R. Gainor, S. Sinclair, S. Ruecker, M. Patey, and S. Gabriele. A Man-dala Browser User Study: Visualizing XML Versions of Shakespeare’s Plays.Visible Language, 43(1):60, 2009.
[13] M. K. Gold. Debates in the digital humanities. Univ Of Minnesota Press, Minneapolis, 2012.
[14] T. R. Gruber. A translation approach to portable ontology specifications. Knowledge acquisition, 5(2):199–220, 1993.
[15] T. R. Gruber. Toward principles for the design of ontologies used for knowledge sharing?International journal of human-computer studies, 43(5-6):907–928, 1995.
[16] A. J. G. Hey, S. Tansley, and K. M. Tolle.The fourth paradigm : data-intensive scientific discovery. Microsoft Research, Redmond, Wash, version 1.1. ed., 2009.
[17] IProspect. Search engine user attitudes survey April-May 2004. Report, 2004.
[18] IProspect. iProspect Search Engine User Behavior Study - April 2006. Report, 2006.
[19] P. Isenberg, S. Klum, R. Langner, J.-D. Fekete, and R. Dachselt. Stack-ables: faceted browsing with stacked tangibles. InCHI’12 Extended Abstracts on Human Factors in Computing Systems, pp. 1083–1086. ACM, 2012.
[20] H. Ishii and B. Ullmer. Tangible bits: towards seamless interfaces between people, bits and atoms. InProceedings of the ACM SIGCHI
Conference on Human factors in computing systems, pp. 234–241. ACM, 1997.
[21] B. J. Jansen and A. Spink. How are we searching the World Wide Web? A comparison of nine search engine transaction logs. Information processing & management, 42(1):248–263, 2006. doi: 10.1016/j.ipm. 2004.10.007
[22] B. J. Jansen, A. Spink, J. Bateman, and T. Saracevic. Real life infor-mation retrieval: A study of user queries on the web. InACM SIGIR Forum, vol. 32, pp. 5–17. ACM, 1998.
[23] D. J. Kasik, D. Ebert, G. Lebanon, H. Park, and W. M. Pottenger. Data Transformations and Representations for Computation and Visu-alization.Information Visualization, 8(4):275–285, 2009. doi: doi:10. 1057/ivs.2009.27
[24] S. Kenderdine and T. Hart. mARChive: Sculpting Museum Victoria’s Collections.MW2014: Museums and the Web 2014, 2014.
[25] A. Kirk.Data visualisation : a handbook for data driven design. Sage Publications, Los Angeles, 2016.
[26] R. N. Kostoff, R. Boylan, and G. R. Simons. Disruptive tech-nology roadmaps. Technological Forecasting and Social Change, 71(1 ¨A`ı2):141–159, 2004. doi: 10.1016/S0040-1625(03)00048-9 [27] R. Langner, A. Augsburg, and R. Dachselt. CubeQuery: Tangible
Interface for Creating and Manipulating Database Queries, 2014. doi: 10.1145/2669485.2669526
[28] H. Lee, P. Ferguson, N. O’Hare, C. Gurrin, and A. F. Smeaton. Inte-grating interactivity into visualising sentiment analysis of blogs, 2010. doi: 10.1145/2002353.2002360
[29] D. Maltby. Big data analytics. In74th Annual Meeting of the As-sociation for Information Science and Technology (ASIST), pp. 1–6, 2011.
[30] L. Manovich. The language of new media. MIT Press, Cambridge, Mass. ; London, 1st mit press pbk. ed. ed., 2001.
[31] T. Mayes and S. De Freitas. Review of e-learning theories, frameworks and models. jisc e-learning models study report. 2004.
[32] M. McCreadie and R. E. Rice. Trends in analyzing access to informa-tion. Part I: Cross-disciplinary conceptualizations of access. Informa-tion processing & management, 35(1):45–76, 1999.
[33] S. Papert. Mindstorms : children, computers and powerful ideas. Harvester Wheatsheaf, New York ; London, 2nd ed. ed., 1993. [34] J. Pereda. Online Cultural Heritage. Facilitating Cultural Heritage
Queries on the Web through Tangible User Interfaces. Phd thesis, University of Southampton, 2017.
[35] J. Pereda and L. Isaksen. Developing downloadable TUIs for online pedagogic activities. InProceedings of TEI’14 Eighth International Conference on Tangible, Embedded, and Embodied Interaction, Febru-ary 2014.
[36] R. Perlman. Using computer technology to provide a creative learning environment for preschool children. 1976.
[37] J. Piaget.Origin of intelligence in the child. Penguin books, 1936. [38] J. Piaget and M. Cook.The origins of intelligence in children, vol. 8.
International Universities Press New York, 1952.
[39] T. Reuters. Web Of Science - Citation Map. [Online]. Available:https://images.webofknowledge.com/WOKRS512B4/ help/WOS/hp_citation_map.html, 2013. [Accessed: 20-July-2017].
[40] S. R¨ucker, M. Radzikowska, and S. Sinclair. Visual interface design for digital cultural heritage: A guide to rich-prospect browsing, 2011. [41] T. M. Savage and K. E. Vogel.An introduction to digital multimedia.
Jones & Bartlett Learning, Burlington, MA, second edition. ed., 2014. [42] D. W. Seo and J. Y. Lee. Physical query interface for tangible aug-mented tagging and interaction.Expert Syst. Appl., 40(6):2032–2042, 2013. doi: 10.1016/j.eswa.2012.10.020
[43] O. Shaer, N. Leland, E. H. Calvillo-Gamez, and R. J. K. Jacob. The TAC paradigm: specifying tangible user interfaces. Personal and Ubiquitous Computing, 8(5):359–369, 2004.
[44] A. Spink, D. Wolfram, M. B. J. Jansen, and T. Saracevic. Searching the web: The public and their queries.Journal of the American society for information science and technology, 52(3):226–234, 2001. [45] T. Sumner. Report on the fifth ACM/IEEE joint conference on
dig-ital libraries-cyberinfrastructure for research and education. D-Lib Magazine, 11(7/8), 2005.
[46] C. Sylla, P. Branco, C. Coutinho, and E. Coquet. TUIs vs. GUIs: comparing the learning potential with preschoolers. Personal and Ubiquitous Computing, 16(4):421–432, 2012. doi: 10.1007/s00779 -011-0407-z
[47] Tangible Display SAS.Tangible Display. [Online]. Available:http: //tangibledisplay.com/, 2013. [Accessed: 20-July-2017]. [48] R. S. Taylor. Question-negotiation and information seeking in libraries.
College & Research Libraries, 76(3):251–267, 2015. doi: 10.5860/crl. 76.3.251
[49] B. Ullmer, H. Ishii, and R. J. K. Jacob. Tangible query interfaces: Physically constrained tokens for manipulating database queries. In Proc. of INTERACT, vol. 2003, pp. 279–286.
[50] B. Zaman, V. Vanden Abeele, P. Markopoulos, and P. Marshall. Ed-itorial: The evolving field of tangible interaction for children: the challenge of empirical validation.Personal and Ubiquitous Computing, 16(4):367–378, 2012. doi: 10.1007/s00779-011-0409-x
![Figure 2: Complex query produced by a non digital expert through Pereda’s [34] TUI Query System](https://thumb-us.123doks.com/thumbv2/123dok_us/11087484.2995779/2.918.86.439.406.616/figure-complex-query-produced-digital-expert-pereda-query.webp)