Technological University Dublin
Technological University Dublin
ARROW@TU Dublin
ARROW@TU Dublin
Articles
School of Computing
2017
Assessment of Mental Workload: a Comparison of Machine
Assessment of Mental Workload: a Comparison of Machine
Learning Methods and Subjective Assessment Techniques
Learning Methods and Subjective Assessment Techniques
Karim Moustafa
Technological University Dublin
Saturnino Luz
University of Edinburgh
Luca Longo
Technological University Dublin, [email protected]
Follow this and additional works at: https://arrow.tudublin.ie/scschcomart Part of the Computer Engineering Commons
Recommended Citation
Recommended Citation
Moustafa, K., Saturnino, L. & Longo, L. (2017). Assessment of Mental Workload: A Comparison of
Machine Learning Methods and Subjective Assessment Techniques. International Symposium on Human Mental Workload: Models and Applications, 28-30 June, Dublin, Ireland. doi:10.1007/978-3-319-61061-0_3 This Conference Paper is brought to you for free and
open access by the School of Computing at ARROW@TU Dublin. It has been accepted for inclusion in Articles by an authorized administrator of ARROW@TU Dublin. For more information, please contact
[email protected], [email protected], [email protected].
This work is licensed under a Creative Commons Attribution-Noncommercial-Share Alike 3.0 License
See discussions, stats, and author profiles for this publication at: https://www.researchgate.net/publication/318145280
Assessment of Mental Workload: A Comparison of Machine Learning Methods
and Subjective Assessment Techniques
Conference Paper in Communications in Computer and Information Science · June 2017
DOI: 10.1007/978-3-319-61061-0_3 CITATIONS 7 READS 469 3 authors, including:
Some of the authors of this publication are also working on these related projects: Mental workload modelingView project
Karim Moustafa
Dublin Institute of Technology
3PUBLICATIONS 8CITATIONS
SEE PROFILE
Luca Longo
Dublin Institute of Technology
52PUBLICATIONS 309CITATIONS
SEE PROFILE
All content following this page was uploaded by Luca Longo on 23 September 2017. The user has requested enhancement of the downloaded file.
Assessment of mental workload: a comparison of
machine learning methods and subjective
assessment techniques
Karim Moustafa1, Saturnino Luz2, Luca Longo1,3∗
1
School of Computing, Dublin Institute of Technology
2 Usher Institute of Population Health Sciences and Informatics,
The University of Edinburgh
3 The ADAPT Centre
∗
Abstract. Mental workload (MWL) measurement is a complex
multi-disciplinary research field. In the last 50 years of research endeavour, MWL measurement has mainly produced theory-driven models. Some of the reasons for justifying this trend includes the omnipresent uncertainty about how to define the construct of MWL and the limited use of data-driven research methodologies. This work presents novel research focused on the investigation of the capability of a selection of supervised Machine Learning (ML) classification techniques to produce data-driven compu-tational models of MWL for the prediction of objective performance. These are then compared to two state-of-the-art subjective techniques for the assessment of MWL, namely the NASA Task Load Index and the Workload Profile, through an analysis of their concurrent and conver-gent validity. Findings show that the data-driven models generally tend to outperform the two baseline selected techniques.
1
Introduction
Mental Workload (MWL) is a fundamental concept in human performance pre-diction. It is a complex construct that is affected by several factors measurable with various methods [38,43]. Different approaches have been proposed to ag-gregate these factors towards an index of MWL. However, difficulties exist in defining MWL, in understanding which factors best describe it and in build-ing a robust model for predictbuild-ing performance that have a general applicability [25,28]. State-of-the-art computational models are rather ad-hoc and their ap-plicability is confined to specific application fields [22,23,26]. Additionally, the vast majority of these models are mainly theory-driven. This means from a set of measurable factors, theoretically related to MWL, and a computational model to aggregate these factors, an inference is made. This is usually an index of mental workload that can be theoretically related to human performance [29,30]. Not a lot has been done in the development of data-driven models of MWL, which means computational models induced by learning from a set of data that are
capable of fitting human performance. One reason is that MWL is still an ill-defined construct, justifying the application of deductive research methods [40]. Another reason is that MWL is a 50-year old construct, and at its origins, induc-tive non-linear computational methodologies were not as popular and developed as nowadays. Only in the last two decades, with the acceleration and spread of Machine Learning (ML), researchers initiated to investigate MWL using induc-tive data-driven research methodologies [3,12,52,44,20].
This paper is one of the few recent attempts to apply modern inductive data-driven research methodologies, namely supervised Machine Learning, to induce mental workload models from data acquired through subjective self-report mea-sures. In particular, a unique comparison of the inferential capacity of two state-of-the-art subjective MWL measurement techniques is performed, namely the popular NASA Task Load Index and the Workload Profile instruments, against the inferential capacity of novel inductive data-driven models of MWL, built using Machine Learning.
The rest of the paper is organised as follows. Section 2 describes related work in the specific field of MWL measurement, with an emphasis on subjective self-reporting measurement methods, extracting relevant gaps and motivating the need for data-driven methods for MWL. Section 3 focuses on the design of an experiment and the description of the research methodology adopted for the development of inductive data-driven MWL models. Section 4 presents the results and critically evaluate these models through a rigorous comparison of their concurrent and convergent validity against the ones of the two selected baseline theory-driven MWL models. Finally, section 5 concludes this research study highlighting the contribution to the body of knowledge and suggesting future research paths.
2
Related Work
Mental workload (MWL) is a fundamental design concept in Human-Computer Interaction (HCI) and Ergonomics (Human Factors) and it is sometimes referred to as Cognitive Load (CL), specifically in Cognitive Psychology. It is intrinsi-cally complex and multifaceted [39,25]. There is no widely accepted definition of MWL, however, it can be intuitively described as the total cognitive load needed to accomplish a specific task under a finite period of time [5].
2.1 Mental workload measurement methods
Measuring MWL is essential in predicting human performance and in turn in-forming the design of technologies, interfaces, information-based procedures and instructions. There are different methods that have been proposed for measuring MWL. These can be clustered in three main classes:
– Subjective measures - this class relies on the analysis of the subjective feedback provided by humans interacting with an underlying task and sys-tem. The feedback usually takes the form of a survey or questionnaire, of-ten post-task. The most known methods are the NASA Task Load Index (N ASA−T LX) [15], the Workload profile (W P) [48], and the Subjective Workload Assessment Technique (SWAT) [38];
– Task performance measures - this class is often referred to as primary and secondary tasks measures and it focuses on the objective performance mea-surement related to an underlying task. The time to complete a task, the reaction time to secondary tasks and the number of errors on the primary task are examples of measures, as well as the tracking and analysing of the different actions performed by a user during a primary task;
– Physiological measures - this class is based upon the analysis of physiolog-ical indicators and responses of the human body. Examples include EEG (electroencephalogram), eye tracking and heart rate measures.
2.2 Subjective measurements methods
This study is particularly focused on two subjective measures of MWL that have been widely employed by several researchers in the last four decades: the NASA-Task Load Index (NASA-TLX) [15] and the Workload Profile (WP) [48] based on the Multiple Resource Theory [49]. The MWL instrument developed by the NASA agency was originally conceived to support the measurement of the men-tal workload of pilots during aviation tasks. Subsequently, the NASA-TLX was adopted in many other fields and used as a benchmark in many research stud-ies [41,40]. The NASA-TLX scale is built upon six factors and their individual weights. The associated formula is shown in equation (1) wheredi represents the
rating provided by a person after the execution of an underlying task whilewiis
the weight associated with that dimension and achieved by a pairwise procedure. The questionnaire used by NASA can be found in [15].
N ASA−T LXM W L= 6 X i=1 di×wi ! 1 15 (1)
The Workload Profile (WP) is another subjective MWL assessment method based upon the Multiple Resource Theory (MRT) proposed by Wickens [49]. The WP index is built upon 8 dimensions: perceptual/central processing, response processing, spatial processing, verbal processing, visual processing, auditory pro-cessing, manual responses and speech responses. An operator is asked to rate the proportion of attentional resources, in the range [0..1]∈ <. The final MWL index is a simple sum of the 8 factors as shown in equation 2.
W PM W L=
8 X
i=1
di (2)
For a further analysis of the questionnaires associated with the two aforemen-tioned measurements methods, we refer the reader to [25].
2.3 Criteria for the development of MWL measurement methods There are different criteria that have emerged in the last few decades in the literature of mental workload for the evaluation of measurement methods and for assessing their inferential capacity [35]. A method adhering to all the criteria below is ideal, but unfortunately it is not always the case.
– Sensitivity:the method should be responsive to variations in task difficulties and other factors believed to influence mental workload on the task level; – Diagnosticity:the method should be diagnostic and be capable of identifying
the changes in workload variation and the causes of these changes;
– Intrusiveness: the method should not be intrusive or interfere with the pri-mary task performance;
– Requirements: the method should demand minimum equipment to avoid influencing the performance of humans during primary task execution; – Acceptability: the method should achieve high acceptance from humans; – Selectivity: the method should be highly sensitive to MWL factors and not
affected by other factors that are not related to MWL;
– Bandwidth and reliability: the method should be reliable during the tests and should be able to detect changes in MWL;
– Validity: the capacity of the method to measure MWL (sometimes referred to as reliability).
2.4 Gaps in measurement methods
The vast majority of the procedures for measuring MWL are theory-driven and deductive in nature. Deductive inference of mental workload follows a top-down approach. It starts with a hypothesis, or a set of hypotheses, based on existing knowledge and theories, and then it moves towards the measurement and quan-tification of those factors believed to influence mental workload, their aggregation and a final inference, usually an index or score. However, as in other scientific fields, inductive research methodologies can be applied to create models of mental workload from data and produce alternative inferences. An inductive data-driven inference of mental workload follows a bottom-up approach that starts with the measurement and quantification of those factors believed to influence mental workload. It then applies inductive learning classification techniques that can learn from these quantities and produce computational models capable of fitting human performance. Nowadays, one of the most popular research fields devoted to the development of inductive models is Machine learning (ML), a sub-field of Artificial Intelligence (AI). ML aims to develop algorithms and procedures that can learn from data, extract trends, patterns and make predictions.
In MWL measurement, the need to use Machine Learning arises because of the multifaceted characteristics of MWL itself, the ambiguity and uncertainty associated with the many non-linear factors shaping this construct and the diffi-culties associated with their aggregation and the development of computational models. Not a lot has been done in the application of ML techniques to the automatic construction of MWL models that consider subjective measures.
2.5 Machine Learning and Inductive data-driven methods for MWL Generally speaking, an inductive data-driven research approach is driven by an observation and analysis of available data toward the extraction of meaning, patterns, relationship and eventually the development of theories. From its in-ception, Machine Learning (ML) has gone far beyond the pattern recognition capabilities. Nowadays, ML algorithms are able to adapt, encode, decode and induce models from heterogeneous data not linearly related, with different char-acteristics, types, ranges and scales.
Recent studies revealed that most of the applications of Machine Learning in the field of Mental Workload focused on the processing of signals of physiological measures and as a form of benchmark for other measurement techniques [42]. For instance, [33,10,45] focused on the analysis of eye-gaze patterns of humans, while interacting with computer screens, and with other devices. Other stud-ies focused on behavioural measures for assessing mental workload [9,13] and on modelling techniques for representing this construct [19]. Some researchers applied linguistic and keyboard dynamics for mental workload detection [34] or functional near-infrared spectroscopy for mental workload classification [36,16]. Yet, others tackled the problem of mental workload modelling through simula-tion, in multitask contexts [11], or in driving situations [51] employing Machine Learning.
3
Design and Methodology
This section is devoted to the design of a comparative study that consider mod-els of mental workload, existing in the literature, and novel data-driven modmod-els developed using Machine Learning classification techniques. An existing dataset is employed for such purposes and the CRISP-DM methodology (the Cross In-dustry Standard Process for Data Mining)[7] is followed.
3.1 Comparative research design
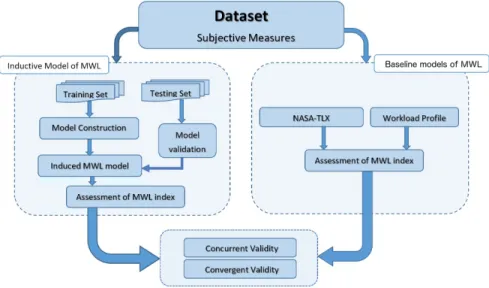
As described in figure 1, the main aim of the experiment is to compare the in-ferential capacity of two state-of-the-art models of MWL, used as a baseline, against novel inductive models built upon an existing dataset [25]. On one hand, the baselines are the MWL subjective assessment techniques described in the previous sections: the NASA task load index (NASA-TLX) [15] (equation 1) and the Workload profile (WP) [48] (equation 2). On the other hand, the in-ductive data-driven models are developed employing different Machine Learning classification techniques, as described in section 3.3. Baselines models and data-driven models will generate different inferences, in the form of indexes of mental workload, given the same input set, and these will be subsequently compared through an analysis of their validity.
Fig. 1: Experiment Design Diagram.
3.2 Dataset
An existing dataset containing self-reporting measures, provided by users who executed a set of typical tasks over three popular web-sites, has been used [27]. The dataset contains data from more than 40 volunteers performing 9 web-based tasks of varying difficulty and contexts, and requiring different human modalities for processing information. A description of the tasks as well as the self-reporting measures collected during the experiment can be found in [25]. The participants, after each task, were asked to fill in the NASA-TLX questionnaire, the Workload Profile questionnaire and another set of questions believed to be useful for modelling mental workload. This last set of questions is not accounted for in this research study. At the end of each task, a finalobjective performance class was assigned to each volunteer:
– 0: the task was not completed as the user gave up;
– 1: the execution of the task was terminated because available time was over; – 2: the task was completed and no answer was required by the user;
– 3: the task was completed, the user provided an answer, but it was wrong; – 4: the task was completed and the user provided the correct.
3.3 Implementation of Machine Learning MWL models
In order to build inductive MWL models from the chosen dataset, the Cross In-dustry Standard Process for Data Mining (CRISP-DM) approach was followed [7]. This process is built upon six stages; business goals, data understanding, data preparation, modelling, and eventually model evaluation and deployment.
Goals:the aim is to induce models of mental workload, from data, capable of predicting as best as possible the previously describedobjective performance class (dependent feature, section 3.2) through a set of independent features. These are exactly the same features employed in the selected baseline models (NASA-TLX, WP). Induced models are expected to perform better than the baseline models in the prediction of the objective performance class.
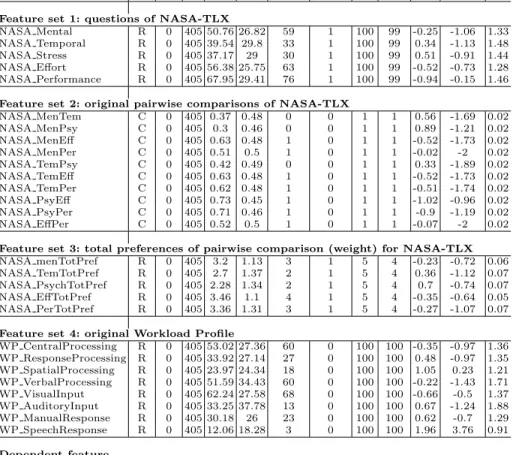
Data Understanding:the data involved in the creation of inductive MWL models includes the information associated with the original NASA-TLX and WP instruments. Data exploration is the first part in which an Analytic Base Table (ABT) is built for discovering the nature of data and investigating its characteristics, such as the type of features, their values and ranges. Likewise, it highlights the quality of data, missing values and outliers (table 1). It is possible to observe that the target feature follows an imbalanced distribution (figure 2a).
Independent feature type miss n mean sd median min max range skew kurtosis se Feature set 1: questions of NASA-TLX
NASA Mental R 0 405 50.76 26.82 59 1 100 99 -0.25 -1.06 1.33 NASA Temporal R 0 405 39.54 29.8 33 1 100 99 0.34 -1.13 1.48
NASA Stress R 0 405 37.17 29 30 1 100 99 0.51 -0.91 1.44
NASA Effort R 0 405 56.38 25.75 63 1 100 99 -0.52 -0.73 1.28 NASA Performance R 0 405 67.95 29.41 76 1 100 99 -0.94 -0.15 1.46 Feature set 2: original pairwise comparisons of NASA-TLX
NASA MenTem C 0 405 0.37 0.48 0 0 1 1 0.56 -1.69 0.02 NASA MenPsy C 0 405 0.3 0.46 0 0 1 1 0.89 -1.21 0.02 NASA MenEff C 0 405 0.63 0.48 1 0 1 1 -0.52 -1.73 0.02 NASA MenPer C 0 405 0.51 0.5 1 0 1 1 -0.02 -2 0.02 NASA TemPsy C 0 405 0.42 0.49 0 0 1 1 0.33 -1.89 0.02 NASA TemEff C 0 405 0.63 0.48 1 0 1 1 -0.52 -1.73 0.02 NASA TemPer C 0 405 0.62 0.48 1 0 1 1 -0.51 -1.74 0.02 NASA PsyEff C 0 405 0.73 0.45 1 0 1 1 -1.02 -0.96 0.02 NASA PsyPer C 0 405 0.71 0.46 1 0 1 1 -0.9 -1.19 0.02 NASA EffPer C 0 405 0.52 0.5 1 0 1 1 -0.07 -2 0.02
Feature set 3: total preferences of pairwise comparison (weight) for NASA-TLX
NASA menTotPref R 0 405 3.2 1.13 3 1 5 4 -0.23 -0.72 0.06
NASA TemTotPref R 0 405 2.7 1.37 2 1 5 4 0.36 -1.12 0.07
NASA PsychTotPref R 0 405 2.28 1.34 2 1 5 4 0.7 -0.74 0.07
NASA EffTotPref R 0 405 3.46 1.1 4 1 5 4 -0.35 -0.64 0.05
NASA PerTotPref R 0 405 3.36 1.31 3 1 5 4 -0.27 -1.07 0.07
Feature set 4: original Workload Profile
WP CentralProcessing R 0 405 53.02 27.36 60 0 100 100 -0.35 -0.97 1.36 WP ResponseProcessing R 0 405 33.92 27.14 27 0 100 100 0.48 -0.97 1.35 WP SpatialProcessing R 0 405 23.97 24.34 18 0 100 100 1.05 0.23 1.21 WP VerbalProcessing R 0 405 51.59 34.43 60 0 100 100 -0.22 -1.43 1.71 WP VisualInput R 0 405 62.24 27.58 68 0 100 100 -0.66 -0.5 1.37 WP AuditoryInput R 0 405 33.25 37.78 13 0 100 100 0.67 -1.24 1.88 WP ManualResponse R 0 405 30.18 26 23 0 100 100 0.62 -0.7 1.29 WP SpeechResponse R 0 405 12.06 18.28 3 0 100 100 1.96 3.76 0.91 Dependent feature Objective performance C 15 390 3.22 1.1 4 0 4 4 -1.28 0.63 0.06 Table 1: ABT table and features (R=Range, C=Categorical)
Data Preparation: the main aim of this stage is to construct the final dataset for subsequent modelling. Here, the dataset is divided into two segments: independent features and target (dependent) feature. The independent continu-ous features and answers of the experimental questionnaires ([1..100]∈N), have been normalised into a scale of unit norm [0..1]in <[17]. The following sets of independent features were extracted:
– Raw-NASA- it contains the original NASA-TLX factors excluding the phys-ical factor as it was not part of task activities (feature set 1 of table 1); – Original-NASA- it contains all the NASA-TLX factors in addition to the
binary preferences among the factors, which emerged from the pairwise com-parison of the original NASA-TLX (feature sets 1+2 of table 1);
– Weighted-NASA - it contains the NASA-TLX factors and the calculated weight for each factor – number of times a factor has been preferred over the others, in the original NASA-TLX pairwise comparison procedure (feature sets 1+3 of table 1).
– WP - it includes the eight WP features (feature set 3 of table 1).
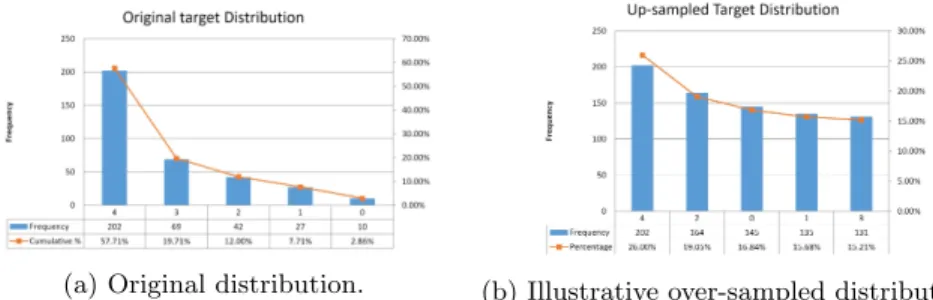
Often, in Machine Learning, the imbalance of the target class can likely affect the creation of robust models, which will tend to be better in predicting the majority classes but not the minority classes. In order to solve this issue, an over-sampling technique has been selected and applied to restore the target class balance. In simple words, the concept of over-sampling is to reproduce relative samples for only one minority class. However, in this specific case, four minority classes exist (figure 2a) and hence the oversampling algorithm has been executed for all the 4 minority classes. The Density-Based SMOTE (DBSMOTE) algorithm was selected [4] among others tested in the preparation phase because of its higher capacity to avoid overfitting of data [6]. Figure 2b shows a distribution obtained using the oversampling method over the full dataset.
(a) Original distribution. (b) Illustrative over-sampled distribution.
Fig. 2: Original and oversampled distribution of target using the DB-SMOTE
Data Modelling:this stage is aimed at inducing computational models by learning from data. This is a non-trivial task not only because the modelling algorithm(s) must be selected from a large number of Machine Learning algo-rithms, but also because an optimal configuration of these algorithms have to
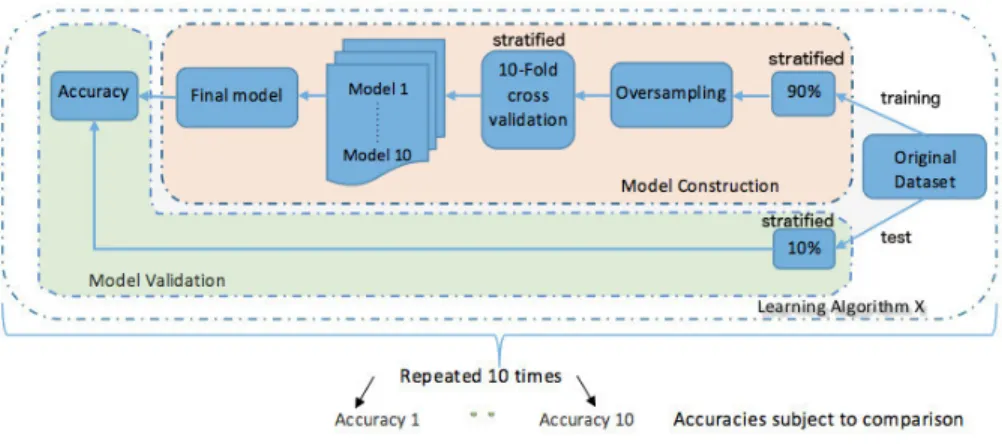
Fig. 3: Detailed design schema: model construction, validation and testing
be found. The selection of supervised learning techniques is done by type. The rationale behind selecting different types is to tackle the MWL modeling prob-lem from different perspectives to allow subsequent triangulation of results and achieve robust findings. Four Machine Learning classification techniques have been chosen:
– Probability based: Naive Bayes – Similarity based: K-nearest Neighbors
– Information based: Random Forest (based on Decision Trees)
– Error Based: Support Vector Machines (with Radial Basis Function Kernel) In order to induce robust models with a higher degree of generalisability, a com-mon way of training models is to split the original data into training and test sets (figure 3). Because of the limited dataset size (|dataset|= 405instances), the split ratio selected is 90% instances for training and 10% for testing. Addi-tionally, because the original distribution of the independent feature is highly imbalanced, random stratified sampling [46] is used to perform the split. This technique allows to representatively sample even the smallest and most inacces-sible subgroups both in training and test sets. Once the training set has been formed, oversampling is applied to it. Subsequently, theK-folds cross validation technique is used as the training method [18,1,37], always justified by the limited size of available data. This technique divides the dataset intoksubsets and, for kiterations, one of theksubsets is used as the validation set and the otherk−1 subsets are textcolorredcombined to form the training set. Usually, the average error across allktrials is computed. In this research,kis set to 10 and the best model emerged out of 10, in term of accuracy, is selected as the final representa-tive model. Eventually, this final model is tested against generalisability with the 10% of instances held-out originally. The overall process is eventually repeated again 10 times, shifting the test set, thus producing 10 accuracies for a given selected learning algorithmX.
Model Evaluation:this is the last stage aimed at evaluating the induced models from the previous phase and their inferential capacity and performance. Overall, 16 final models have been built (4 classifiers for 4 feature sets) each having 10 associated accuracies. The metrics selected for evaluating these final models are: prediction accuracy (observed accuracy) and the Kappa coefficient. Accuracy is required for the overall interpretation of an induced model while the Kappa coefficient provided a more in-depth interpretation, as it is sensitive to imbalanced data. Several studies relied on the Kappa coefficient for evaluating inductive multi-class models [2,14,8]. As shown in equation 3 and 4, the P0 is the probability of overall agreement for a specific label across all classes, the PC
e represents the sum of the proportion of the number of samples assigned to a
class, times the proportion of true labels of that class.Ni:andN:iare the sums of
number in the i-th column and the i-th row of the confusion matrix, respectively. The Kappa statistic is a metric that compares an observed accuracy with an expected accuracy (random chance). It accounts for random chance (agreement with a random classifier), which generally means it is less misleading than simply using accuracy as a metric. An observed accuracy of 90% is less impressive with an expected accuracy of 70% versus an expected accuracy of 50%.
κ= (P0−P C e ) (1−PC e ) (3) PeC= PI i=1Ni:N:i (N2 T otal) (4) The criteria selected for the comparison of the inferential capacity of the base-line models (NASA-TLX, WP) and the inductive data-driven models (emerged from the previous modeling phase) are as follows.
– concurrent validity: the extent to which a technique can explain objective performance measures, as in this case, theobjective performance class [25]; – convergent validity: aims at determining whether different MWL assessment
techniques relate to each other [40].
4
Results and Evaluation
4.1 Concurrent validity of baseline MWL models
To measure the concurrent validity of the selected baseline models (NASA-TLX, WP), the Spearman’s correlation coefficient has been selected as it evaluates the monotonic relationship between the two continuous MWL indexes with the objective performance class. Table 2 depicts the correlations highlighting a weak statistically significant correlation (P <0.01) between the NASA-TLX and the objective performance class and a non-significant correlation (P = 0.72) between the WP and the objective performance class.
*significant at the 0.01 level (2-tailed) WP NASA-TLX
OBJECTIVE PERFORMANCE -.019 -.246*
Sig. (2-tailed) .720 <0.0001
Table 2: Concurrent validity: correlation of NASA-TLX, WP vs performance
4.2 Concurrent validity of data-driven MWL models
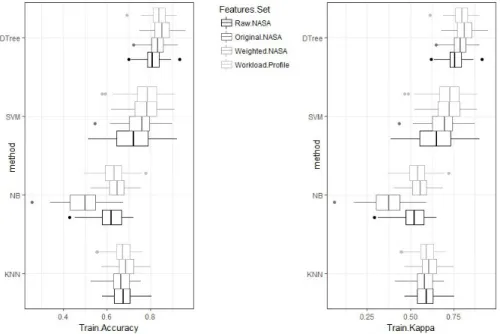
The concurrent validity of the Machine Learning data-driven models is computed by analysing the distribution of the accuracies and the Kappa scores obtained with the 10-fold cross-validation technique used in the training phase, as high-lighted in figure 3 (Model construction phase), across the different features sets (1, 2, 3, 4 of table 1) and the different learning techniques (Naive Bayes, K-nearest Neighbours, Random Forest, Support Vector Machines).
Fig. 4: Training accuracies, kappa scores grouped by Machine Learning classifier
From the boxplots of the accuracies and the kappa-scores of figure 4, it is possible to assess that the classification methods Random Forest and Support Vector Machines (using a radial kernel) are the most robust methods emerged from the training phase (model construction phase of figure 3). In details, ac-cording to the distribution of accuracies, the Random Forest method is capable of producing more accurate models of mental workload, for all the feature sets, and the distributions of the kappa scores confirm that these models are more reliable and not in agreement with a random classifier (section 3.2).
Fig. 5: Training accuracies, kappa scores grouped by independent feature set
From the boxplots of figure 5, a clear picture does not emerge, and it is not possible to clearly assess which feature sets are more useful in allowing the construction of inductive MWL models from data with higher accuracy. As a consequence, the models built with the Random Forest and the Support Vector Machine methods have been extracted, as depicted in figure 6.
Fig. 6: Training accuracies and kappa scores grouped by independent feature set for the best models induced by Random Forest and Support Vector Machines
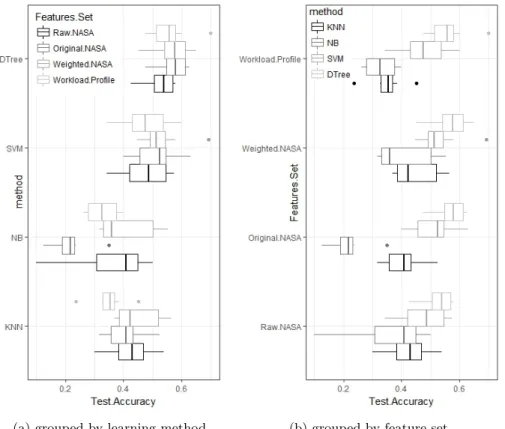
The boxplots of figure 6 suggest that the features set 4 (Workload profile of the ABT table 1) and the feature set 3 (Weighted Nasa of the ABT table 1) are slightly better than the others, although a statistical significance is not present. These results refer to the model construction phase of the diagram of figure 3. In this phase, 10% of the dataset instances was held out at each itera-tion, for 10 times, and this 10% was used to test the accuracies of the best model emerged from each iteration, as depicted in the model validation phase (figure 3). Models validation results:figure 7 depicts the distributions of the accu-racies achieved by the best models (out of 10), both grouped by the Machine Learning methods used (a), and by the features sets (b).
(a) grouped by learning method (b) grouped by feature set
Fig. 7: Accuracies obtained by the best final models, emerged from the model construction phase, using the held out validation sets
The accuracies obtained (figure 7 a) with the test sets, are on average lower than those which emerged in the model construction phase. This is reasonable given that each held out validation set contains instances of the original dataset never used in the model construction phase. However, the results show the same
trends emerged during the model construction phase, confirming how Random Forest and Support Vector machines are the most robust learning methods to build MWL models with the underlying dataset. This can be further grasped from figure 8 (a) which plots the density distributions of all the best final mod-els, obtained across all the features sets (4 sets x 10 iterations=40 points per method). From figure 7 (b), it seems that the feature set 3 (the weighted-NASA as described in section 3.3) is the richest in terms of the information it carries for building MWL models when compared to the other features sets. This is also confirmed from the density plots of accuracies of figure 8 (b) with the ‘weighted NASA’ feature set showing a more compact and taller curve, meaning on av-erage superior than the other features sets. It is important to note that, even considering the best modelling methods (Random Forest and Support Vector Machines), the testing accuracies varies from 0.4 to 0.6 (40% to 60%) indicating that either more data is needed to build better MWL models or more descriptive (independent) features, carrying other information, are needed to increase their accuracies. These results are in line with current research on mental workload and the well known difficulties in predicting human performance.
(a) grouped by earning method (b) grouped by feature set
Fig. 8: Accuracy densities, emerged from the model construction phase, using the held out validation sets
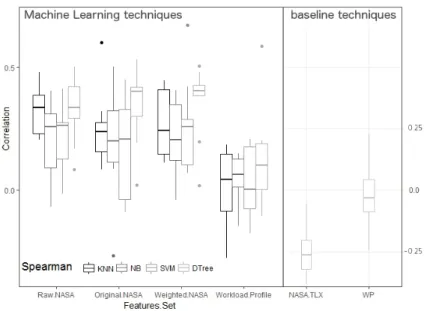
Finally, to summarise the findings related to the concurrent validity of the inductive data-driven models produced in this study, and the baseline state-of-the-art models – namely the NASA-TLX and the Workload profile – an investi-gation of the correlation of their assessments against objective performance has been carried out, as depicted in figure 9.
Fig. 9: Concurrent validity: distributions of the spearman correlations of the MWL inductive and deductive models against objective performance
In details, the following correlations were computed:
– theobjective performance class (section 3.2) predicted by the induced learn-ing models against theobjective real performance class assigned to a volun-teer executing an underlying task (the ground truth, section 3.2);
– theMWL scores, produced by the baseline models (NASA-TLX, WP, in the range [0..100]∈N) against theobjective real performance class assigned to a volunteer executing an underlying task (the ground truth, section 3.2). Due to the fact that at least one of the two variables, in each correlation analysis, is always a categorical variable, the Spearman correlation method has been adopted instead of the Pearson correlation method, as the former does not require the variables being normally distributed, and the latter requires both continuous variables. From figure 9, it is possible to note that, on one hand, the box plots associated with the baseline models are closer to 0, suggesting that there is no real correlation between their assessment and the objective performance experienced by the volunteer in the experimental task. A similar result is achieved by the data-driven models produced using the features set 4 (containing the attributes of the original Workload Profile instrument). On the other hand, this situation is improved by the data-driven models of MWL built using the feature sets 1,2,3 (section 3.3, containing the attributes of the original NASA-TLX). Correlations are more far away from 0, indicating that a clearer and better relationship between the predicted objective performance class, and the observed objective real performance experience by the volunteer in the experimental task can be obtained.
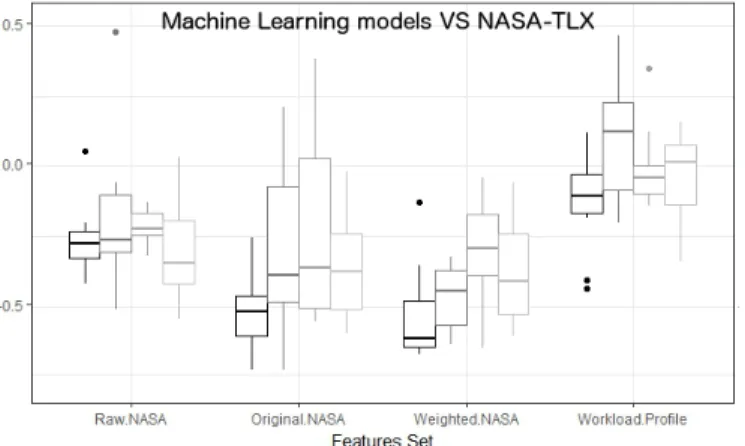
4.3 Convergent validity of baseline and data-driven MWL models The convergent validity of the Machine Learning-based induced models is com-puted by analysing their correlation with the original NASA Task Load Index and the Workload Profile instruments, baseline models. Figures 10 and 11 de-pict the correlations and, as before, the Spearman correlation coefficient has been preferred over the Pearson correlation coefficient because of the presence of categorical data and a relaxation of the assumptions of normality of variables.
Fig. 10: Convergent validity: distributions of the spearman correlations of the MWL data-driven models against the NASA-TLX model
Fig. 11: Convergent validity: distributions of the Spearman correlations of the MWL data-driven models against the WP model
The box-plots of figure 10 and 11 show a weak correlation between the base-line and inductive data-driven MWL models. In detail, the Machine-Learning based induced models correlate better to the assessments produced by the orig-inal NASA-TLX and have nearly null correlation with those produced by the Workload Profile instrument. This suggests that incorporating the features of the original NASA-TLX (or their manipulation) in a data-driven model is more use-ful than using the features of the original Workload Profile instrument. In other words, induced models, built using Machine Learning classification techniques are closer to the NASA-TLX assessment instrument rather than the Workload Profile instrument.
4.4 Summary of Findings
The findings achieved in this empirical research showed that:
– the concurrent validity achieved by the inductive data-driven models of MWL, built using Machine Learning classification techniques, outperform the concurrent validity of two state-of-the-art baseline models of MWL, namely the NASA-TLX and the Workload Profile. In detail, figure 9 high-lights the capacity of the inductive data-driven models to correlate to human performance better than the selected baseline models.
– theconvergent validity of the inductive data-driven models, built using Ma-chine Learning classification techniques, and the baseline models of MWL, namely the NASA-TLX and the Workload Profile assessment techniques, is rather weak.
The weak convergent validity of the inductive data-driven models and the baseline MWL models would suggest that, if the NASA-TLX and the WP in-struments are taken as benchmarking, then the assessments produced by the inductive models is poorly assessing mental workload as a construct. However, the concurrent validity of the induced models better explain human performance than the NASA-TLX and WP instruments. Thus, because the main reason of assessing MWL is to predict human performance, then the inferential capacity of the inductive models is argued to be superior than the baseline models, high-lighting the potential of Machine Learning as a method for modelling MWL and increasing its understanding as construct.
5
Conclusion
This unique research study, the first of its kind to the best of our knowledge, was aimed at comparing the inferential capacity of two baseline mental workload (MWL) assessment techniques using self-reporting data – namely the NASA Task Load Index and the Workload Profile instruments – against inductive data-driven models of mental workload built using Machine Learning classifi-cation techniques. The Cross Industry Standard Process for Data Mining was followed for building inductive models using four Machine Learning classification
techniques of different types: Naive Bayes, based on probability measures; the K-nearest Neighbors classifier, based on similarity measures; Random Forest, based on Decision Trees and information measures; and Support Vector Machines, based on error measures. The underlying dataset [27], used for the comparison, is part of a bigger study [24] and already used in literature [32,25,31,40]. This includes self-reporting data, obtained from human volunteers, after executing typical web-based tasks upon three popular websites. The findings confirm the original hypothesis in which MWL models, built using classification techniques, were expected to outperform baseline theory-driven models in the prediction of human performance (concurrent validity). In this context, concurrent validity was the capacity of a MWL assessment technique to predict an objective per-formance class (categorical variable) which was a real behavioural indicator of the performance achieved by humans on experimental tasks. Findings, although promising, cannot be generalised as only one dataset of small size has been used. Further investigations and empirical research needs to be carried out to strengthen this contribution and confirm the potential of Machine Learning as a novel methodology for building data-driven models of mental workload and increasing our understanding of this fascinating complex construct.
Future work will be devoted to collect novel data, not using only self-reporting assessment techniques, but also primary and secondary task measures as well as physiological measures. Different contexts of application will be explored, in-cluding for example virtual reality applications [21], simulation in safety critical environments [47], in educational settings [50] and clinical environments [28]. Additional Machine Learning classification techniques will be selected and fur-ther existing theory-driven models of mental workload will be considered for additional comparison.
References
1. Arlot, S., Celisse, A., et al.: A survey of cross-validation procedures for model selection. Statistics surveys 4, 40–79 (2010)
2. Ben-David, A.: About the relationship between ROC curves and Cohen’s kappa. Engineering Applications of Artificial Intelligence 21(6), 874–882 (2008)
3. Blankertz, B., Curio, G., M¨uller, K.R.: Classifying single trial EEG: Towards brain
computer interfacing. Advances in Neural Information Processing Systems 1(c), 157–164 (2002)
4. Bunkhumpornpat, C., Sinapiromsaran, K., Lursinsap, C.: DBSMOTE: Density-based synthetic minority over-sampling technique. Applied Intelligence 36(3), 664– 684 (2012)
5. Cain, B.: A Review of the Mental Workload Literature. In: Defence research and development Toronto (Canada). pp. 4–1–4–34 (2007),
6. Cawley, G.C., Talbot, N.L.: On over-fitting in model selection and subsequent selection bias in performance evaluation. Journal of Machine Learning Research 11(Jul), 2079–2107 (2010)
7. Chapman, P., Clinton, J., Khabaza, T., Reinartz, T., Wirth, R.: The crisp-dm process model. The CRIP–DM Consortium 310 (1999)
8. Choudhury, S., Bhowal, A.: Comparative analysis of machine learning algorithms along with classifiers for network intrusion detection. 2015 International Confer-ence on Smart Technologies and Management for Computing, Communication, Controls, Energy and Materials (ICSTM) (May), 89–95 (2015),
9. Cinaz, B., Arnrich, B., La Marca, R., Tr¨oster, G.: Monitoring of mental
work-load levels during an everyday life office-work scenario. Personal and Ubiquitous Computing 17(2), 229–239 (2013)
10. Cortes Torres, C.C., Sampei, K., Sato, M., Raskar, R., Miki, N.: Workload As-sessment with Eye Movement Monitoring Aided by Non-invasive and Unobtrusive Micro-fabricated Optical Sensors. Adjunct Proceedings of the 28th Annual ACM Symposium on User Interface Software & Technology pp. 53–54 (2015),
11. Di Stasi, L.L., Marchitto, M., Antol´ı, A., Baccino, T., Ca˜nas, J.J.: Approximation
of on-line mental workload index in ATC simulated multitasks. Journal of Air Transport Management 16(6), 330–333 (2010),
12. Dornhege, G., Blankertz, B., Curio, G., M´uller, K.R.: Boosting bit rates in
non-invasive EEG single-trial classifications by feature combination and multiclass paradigms. IEEE Transactions on Biomedical Engineering 51(6), 993–1002 (2004) 13. Elkin-Frankston, S., Bracken, B.K., Irvin, S., Jenkins, M.: Are behavioral measures useful for detecting cognitive workload during human-computer interaction? In: Advances in Intelligent Systems and Computing, vol. 494, pp. 127–137. Springer (2017),
14. Fatourechi, M., Ward, R.K., Mason, S.G., Huggins, J., Schl´ogl, A., Birch, G.E.:
Comparison of evaluation metrics in classification applications with imbalanced datasets. In: Proceedings - 7th International Conference on Machine Learning and Applications, ICMLA 2008. pp. 777–782 (2008)
15. Hart, S.G., Staveland, L.E.: Development of NASA-TLX (Task Load Index): Re-sults of Empirical and Theoretical Research. Advances in Psychology 52(C), 139– 183 (1988)
16. Hincks, S.W., Afergan, D., Jacob, R.J.K.: Using fNIRS for real-time cognitive workload assessment. In: Lecture Notes in Computer Science (including subseries Lecture Notes in Artificial Intelligence and Lecture Notes in Bioinformatics). vol. 9743, pp. 198–208 (2016),
17. Juszczak, P., Tax, D., Duin, R.P.: Feature scaling in support vector data descrip-tion. In: Proc. ASCI. pp. 95–102. Citeseer (2002)
18. Kohavi, R., et al.: A study of cross-validation and bootstrap for accuracy estimation and model selection. In: Ijcai. vol. 14, pp. 1137–1145 (1995)
19. Kumar, M., Arndt, A., Kreuzfeld, S., Thurow, K., Stoll, N., Stoll, R.: Fuzzy tech-niques for subjective workload-score modeling under uncertainties. IEEE Trans-actions on Systems, Man, and Cybernetics, Part B: Cybernetics 38(6), 1449–1464 (2008)
20. Lee, J.C., Tan, D.S.: Using a low-cost electroencephalograph for task classifica-tion in HCI research. Proceedings of the 19th ACM Symposium on User Interface Software and Technology pp. 81–90 (2006)
21. Leva, M., Kay, A., Mattei, F., Kontogiannis, T., De Ambroggi, M., Cromie, S.: A dynamic task representation method for a virtual reality application. Engineering psychology and cognitive ergonomics pp. 32–42 (2009)
22. Longo, L.: Human-computer interaction and human mental workload: Assessing cognitive engagement in the world wide web. In: INTERACT (4). pp. 402–405 (2011)
23. Longo, L.: Formalising human mental workload as non-monotonic concept for adap-tive and personalised web-design. In: UMAP, pp. 369–373 (2012)
24. Longo, L.: Formalising Human Mental Workload as a Defeasible Computational Concept. Ph.D. thesis, Trinity College Dublin (2014)
25. Longo, L.: A defeasible reasoning framework for human mental workload repre-sentation and assessment. Behaviour and Information Technology 34(8), 758–786 (2015)
26. Longo, L.: Designing medical interactive systems via assessment of human mental workload. In: Int. Symposium on Computer-Based Medical Systems. pp. 364–365 (2015)
27. Longo, L.: Subjective usability (system usability scale) and subjective mental work-load (nasa-tlx and workwork-load profile) of web-based tasks and interfaces (2015), 28. Longo, L.: Mental workload in medicine: Foundations, applications, open problems,
challenges and future perspectives. In: 2016 IEEE 29th International Symposium on Computer-Based Medical Systems (CBMS). pp. 106–111 (June 2016)
29. Longo, L., Barrett, S.: A Computational Analysis of Cognitive Effort pp. 65–74 (2010),
30. Longo, L., Barrett, S.: Cognitive effort for multi-agent systems. Lect. Notes Com-put. Sci. (including Subser. Lect. Notes Artif. Intell. Lect. Notes Bioinformatics) 6334 LNAI, 55–66 (2010)
31. Longo, L., Dondio, P.: On the relationship between perception of usability and subjective mental workload of web interfaces. In: IEEE/WIC/ACM International Conference on Web Intelligence and Intelligent Agent Technology, WI-IAT 2015, Singapore, December 6-9, Volume I. pp. 345–352 (2015)
32. Longo, L., Rusconi, F., Noce, L., Barrett, S.: The importance of human mental workload in web-design. In: 8th International Conference on Web Information Sys-tems and Technologies. pp. 403–409 (April 2012)
33. Mannaru, P., Balasingam, B., Pattipati, K., Sibley, C., Coyne, J.: Cognitive context detection in UAS operators using eye-gaze patterns on computer screens. In: SPIE 9851, Next-Generation Analyst IV. vol. 9851, p. 98510F (2016),
34. Ott, T., Wu, P., Paullada, A., Mayer, D., Gottlieb, J., Wall, P.: ATHENA A zero-intrusion no contact method for workload detection using linguistics, keyboard dynamics, and computer vision. In: Communications in Computer and Information Science. vol. 617, pp. 226–231 (2016),
35. ODonnell, R., Eggemeier, F.: Workload assessment methodology. Handbook of Per-ception and Human Performance. Volume 2. Cognitive Processes and Performance. KR Boff, L. Kaufman and JP Thomas. John Wiley and Sons, Inc (1986)
36. Pham, T.T., Nguyen, T.D., Van Vo, T.: Sparse fNIRS feature estimation via un-supervised learning for mental workload classification. In: Bassis, S., Esposito, A., Morabito, C.F., Pasero, E. (eds.) Smart Innovation, Systems and Technologies, vol. 54, pp. 283–292. Springer International Publishing, Cham (2016),
37. Rao, R.B., Fung, G., Rosales, R.: On the dangers of cross-validation. an experi-mental evaluation. In: Proceedings of the 2008 SIAM International Conference on Data Mining. pp. 588–596. SIAM (2008)
38. Reid, G.B., Nygren, T.E.: The Subjective Workload Assessment Technique: A Scal-ing Procedure for MeasurScal-ing Mental Workload, vol. 52. North-Holland (1988), 39. Reid, G.B., Nygren, T.E.: The Subjective Workload Assessment Technique: A
Scal-ing Procedure for MeasurScal-ing Mental Workload, vol. 52. North-Holland (1988), 40. Rizzo, L., Dondio, P., Delany, S.J., Longo, L.: Modeling Mental Workload Via
Rule-Based Expert System: A Comparison with NASA-TLX and Workload Profile, pp. 215–229. Springer International Publishing, Cham (2016),
41. Rubio, S., Daz, E., Martn, J., Puente, J.M.: Evaluation of subjective mental work-load: A comparison of swat, nasa-tlx, and workload profile methods. Applied Psy-chology 53(1), 61–86 (2004),
42. Solovey, E., Schermerhorn, P., Scheutz, M., Sassaroli, A., Fantini, S., Jacob, R.: Brainput: Enhancing Interactive Systems with Streaming fNIRS Brain Input. In: Proceedings of the 2012 ACM annual conference on Human Factors in Computing Systems - CHI ’12. p. 2193. ACM (2012),
43. Stassen, H.G., Johannsen, G., Moray, N.: Internal representation, internal model, human performance model and mental workload. Automatica 26(4), 811–820 (1990)
44. Stevens, R., Galloway, T., Berka, C.: Integrating EEG models of cognitive load with machine learning models of scientific problem solving. Proceedings of 2nd Annual Augmented Cognition International Conference (September) (2006) 45. Su, J., Luz, S.: Predicting cognitive load levels from speech data. Smart Innovation,
Systems and Technologies 48, 255–263 (2016)
46. Thompson, S.K.: Stratified Sampling, pp. 139–156. John Wiley & Sons, Inc. (2012),
47. Trucco, P., Leva, M.C., Str¨ater, O.: Human error prediction in atm via cognitive
simulation: Preliminary study. In: Proceedings of the 8th International Conference on Probabilistic Safety Assessment and Management (PSAM8). pp. 1–9 (2006) 48. Tsang, P.S., Velazquez, V.L.: Diagnosticity and multidimensional subjective
work-load ratings. Ergonomics 39(3), 358–381 (1996)
49. Wickens, C.D.: Multiple resources and mental workload. Hum. Factors 50(3), 449– 455 (2008),
50. Wiebe, E.N., Roberts, E., Behrend, T.S.: An examination of two mental work-load measurement approaches to understanding multimedia learning. Computers in Human Behavior 26(3), 474 – 481 (2010),
51. Yoshida, Y., Ohwada, H., Mizoguchi, F., Iwasaki, H.: Classifying Cognitive Load and Driving Situation with Machine Learning. Int. J. Mach. Learn. Comput. 4(3), 210–215 (2014)
52. Zhang, Y.Z.Y., Owechko, Y., Zhang, J.Z.J.: Driver cognitive workload estimation: a data-driven perspective. Proceedings. The 7th International IEEE Conference on Intelligent Transportation Systems (IEEE Cat. No.04TH8749) pp. 642–647 (2004)
View publication stats View publication stats