Open Research Online
The Open University’s repository of research publications
and other research outputs
Heuristic Non Parametric Collateral Missing Value
Imputation: A Step Towards Robust Post-Genomic
Knowledge Discovery
Book Section
How to cite:
Sehgal, M. Shoaib; Gondal, Iqbal; Dooley, Laurence S. and Coppel, Ross (2008).
Heuristic Non Parametric
Collateral Missing Value Imputation: A Step Towards Robust Post-Genomic Knowledge Discovery. In: Chetty, Madhu;
Ngom, A. and Ahmad, S. eds. Pattern Recognition in Bioinformatics. Lecture Notes in Computer Science, 5265.
Berlin: Springer-Verlag, pp. 373–387.
For guidance on citations see FAQs.
c
[not recorded]
Version: [not recorded]
Link(s) to article on publisher’s website:
http://dx.doi.org/doi:10.1007/978-3-540-88436-1
Copyright and Moral Rights for the articles on this site are retained by the individual authors and/or other copyright
owners. For more information on Open Research Online’s data policy on reuse of materials please consult the policies
page.
M. Chetty, A. Ngom, and S. Ahmad (Eds.): PRIB 2008, LNBI 5265, pp. 369–384, 2008. © Springer-Verlag Berlin Heidelberg 2008
Imputation: A Step Towards Robust Post-Genomic
Knowledge Discovery
Muhammad Shoaib B. Sehgal1,*, Iqbal Gondal2, Laurence S. Dooley3, and Ross Coppel4,5
1
ARC Centre of Excellence in Bioinformatics at IMB, University of Queensland, St Lucia, QLD 4067, Australia
2
Faculty of Information Technology, Monash University, Churchill, VIC. 3842, Australia
3
Department of Communications and Systems, The Open University, Milton Keynes, MK7 6AA, United Kingdom
4
Department of Microbiology and 5Victorian Bioinformatics Consortium, Clayton, VIC. 3800, Australia
Abstract. Microarrays are able to measure the patterns of expression of thousands of genes in a genome to give profiles that facilitate much faster analysis of biological processes for diagnosis, prognosis and tailored drug discovery. Microarrays, however, commonly have missing values which can result in erroneous downstream analysis. To impute these missing values, various algorithms have been proposed including Collateral Missing Value Estimation (CMVE), Bayesian Principal Component Analysis (BPCA), Least Square Impute (LSImpute), Local Least Square Impute (LLSImpute) and K-Nearest Neighbour (KNN). Most of these imputation algorithms exploit either the global or local correlation structure of the data, which normally leads to larger estimation errors. This paper presents an enhanced Heuristic Non Parametric Collateral Missing Value Imputation (HCMVI) algorithm which uses CMVE as its core estimator and Heuristic Non Parametric strategy to compute optimal number of estimator genes to exploit optimally both local and global correlations.
1 Introduction
Microarrays are used to measure expression levels of a myriad of genes under a variety of conditions and the resulting expression profiles have been utilized in a wide range of biological applications from diagnosis to drug discovery [1]. Depending on the application, this expression data may be analyzed by statistical, mathematical and machine learning algorithms [2-4] such as data dimension reduction, class prediction [5] and clustering [6]. Despite its pervasive usage, microarray data frequently contains at least 5% erroneous spots and in most datasets, at least 60% of genes have either one
*
or more erroneous values [7]. These spots are identified as missing values for a variety of reasons, including slide scratches, spotting problems, blemishes on the chip, hybridization error, image corruption or simply dust on the slide [8]. Sometimes for instance, a background colour has a higher intensity than a foreground colour due to hybridization failure or bleeding from neighboring spots, while background subtraction may also produce negative values which are subsequently marked as missing. These missing values can seriously impact upon subsequent data analysis methods such as significant gene selection and clustering algorithms [9, 10].
Several approaches to solving the missing data problem have been proposed, with the simplest being either the repetition of the experiment, though this is often not feasible for economic reasons or ignoring samples containing missing values, but again this is not recommended due to limited number of samples. Other alternatives include, row average/median impute (replacement by the corresponding row average/median) and zero impute (replacing the missing values by zero) though both these approaches are high variance approaches as neither takes advantage of inherent data correlations, so leading to higher estimation errors [11]. It has been well accepted that a better strategy is to attempt to accurately estimate the missing values by exploiting the underlying correlation structure of the data [10, 12]. This has been the catalyst for a number of imputation techniques including Collateral Missing Value Imputation (CMVE) [13], K-Nearest Neighbor (KNN), Least Square Imputation (LSImpute) [12], Local LSImpute (LLSImpute) [10] and Bayesian PCA (BPCA) [8]. The resulting estimation errors can still be high however, as some algorithms focus mainly on global data correlation (BPCA), while others exploit local correlations in the data (KNN) by using a fixed number of predictor genes. This provided the motivation for the development of new generic techniques that minimise prediction errors by optimising the number of predictor genes. Moreover, the comparative imputation performances of CMVE, BPCA, LSImpute, LLSImpute and KNN has traditionally been numerically evaluated using the Normalized Root Mean Square Error (NRMSE) measure, which is partial indicative of the estimation impact on any subsequent biological analysis.
This paper presents a Heuristic Non Parametric Collateral Missing Value Imputation (HCMVI) algorithm that employs a combination of correlated genes to estimate missing values by multiple imputation matrices. The basis of HCMVI is CMVE technique that has been demonstrated both theoretically and empirically, to be better than established algorithms including KNN, LSImpute and BPCA [14]. However, like KNN and LSImpute, CMVE does not automatically determine the optimal number of predictor genes k from the dataset and this can lead to higher estimation errors. For data with a local correlation structure, if a large k value is used then it may include genes which have no correlation with the gene that has missing values. Similarly, if data has a global correlation structure, then a small value of k ignores correlated genes in the prediction again resulting in a higher estimation error. It is therefore intuitive to try and calculate the best value of k, based upon the underlying correlation structure of the data. LLSImpute automatically determines k using computational intensive exhaustive search method, hence provides improved results than other LS regression based methods [10], though since this approach is based upon LS regression, therefore, estimation error is still high because LS regression is sensitive to outliers [15, 16] (See Section 2). HCMVI uses CMVE as its
core kernel together with a heuristic non-parametric estimator, to automatically determine k, thereby combining the intrinsic benefits of heuristics and CMVE with a strategy to automatically estimate the optimal number of predictor genes. The estimation performance of HCMVI has been rigorously tested and compared with four other well-established imputation techniques, namely CMVE, KNN, LLSImpute (An enhanced version of LSImpute [12] ) and BPCA in predicting randomly introduced missing values with probabilities ranging from 0.01 to 0.2 for six different ovarian and breast cancer datasets [17, 18]. To cross validate the performance of the different imputation strategies, six separate biological and statistical (both parametric and non-parametric) measures have been used to eliminate any bias towards a particular metric for a certain imputation methodology. The study in particular compared the impact of estimation on significant gene selection where HCMVI clearly demonstrated improved capability for both the breast cancer (locally correlated) and ovarian cancer (globally correlated) datasets. For instance, the KIAA1025 gene which is expressed in breast cancer cell lines and is co-regulated with several cancer causing genes such as estrogen receptors [19] was not selected when missing values were imputed using KNN, LLSImpute, BPCA and CMVE, but was correctly identified across a range of missing values when gene selection was preceded by HCMVI imputation (See supplementary materials1). For completeness, results are also compared using the conventional NRMSE [20] and Wilcoxon Ranksum Significance Test metrics to quantitatively assess the estimation performance of each imputation method, with results again consistently demonstra-ting the improved accuracy and robustness of HCMVI over the entire missing value range. The next Section presents an overview of the existing imputation strategies with their respective merits and demerits.
2 Overview of Existing Imputation Methods
The following nomenclature is adopted in describing different imputation methods. A microarray gene expression matrix Y, contains m genes and n samples. In Y, every gene i is represented by gi. A missing value in gene i for sample j is thus expressed asY i j( , )=g ji( )= Ξ. A short overview is now provided of the main features of the four imputation methods (KNN, LLSImpute, BPCA and CMVE) which are used in this paper to compare the performance of HCMVI.
KNN [11] estimates missing values by searching for the k nearest genes normally using a Euclidean distance function, and then taking the weighted average of the k nearest genes. The method however, does not consider negative correlations [21] and has the drawback of using a predetermined value of k regardless of the dataset being used. Kim et al [10], introduced an improved Least Square regression based algorithm called Local Least Square Impute (LLSimpute), which automatically selects the number of predictor genes k using computational intensive exhaustive search method and then regresses using LS techniques to impute the missing values, though this regression makes the technique highly sensitive to outliers [15, 16] which leads to higher estimation errors (Section 1). BPCA [8] uses Bayesian Principal Component
1
Analysis to impute missing values, though this only exploits global correlations within the data structure, which can lead to erroneous estimates if data possesses a strong local correlation [8]. CMVE algorithm generates multiple estimation matrices using Non-Negative Least Squares (NNLS), Linear Programming (LP) and LS regression techniques to approximate missing values, however despite its enhanced estimation capability, it still relies upon a preset parametric value of k, which limits its applicability. Importantly, despite their respective merits these imputation algorithms have not been analyzed on a-priori biological knowledge, which is ultimately a true evaluation for comparing imputation performance. This was the motivation to develop a new strategy to automatically determine the best value of k directly from the correlation structure of the data, while concomitantly providing significant improvement on both biological and statistical grounds. The next Section presents the HCMVI imputation technique which combines the estimation capability of CMVE with a strategy for deriving the optimal value of k directly from the correlation structure of the data.
3 Heuristic Non Parametric Collateral Missing Value Imputation
Method
The HCMVI algorithm, which is formally presented in Fig. 1, imputes missing values in three stages. Firstly, the number of estimator genes k is computed using a Heuristic Non-Parametric algorithm that exploits data correlation structures. Secondly, the k most correlated genes with the gene (gi) containing missing value are selected from a given dataset, before gi is approximated using the CMVE algorithm and finally value is imputed using Non Negative Least Square and Linear Programming.
To select the number of estimator genes k, the set of sub-matrices SM is chosen
(Step 1, Fig. 1) which has the highest correlation with the rest of data, since this best represents the underlying correlation structure for the entire data Y. To construct such correlated sub-matrix which optimally represents the correlation of the entire data Y is
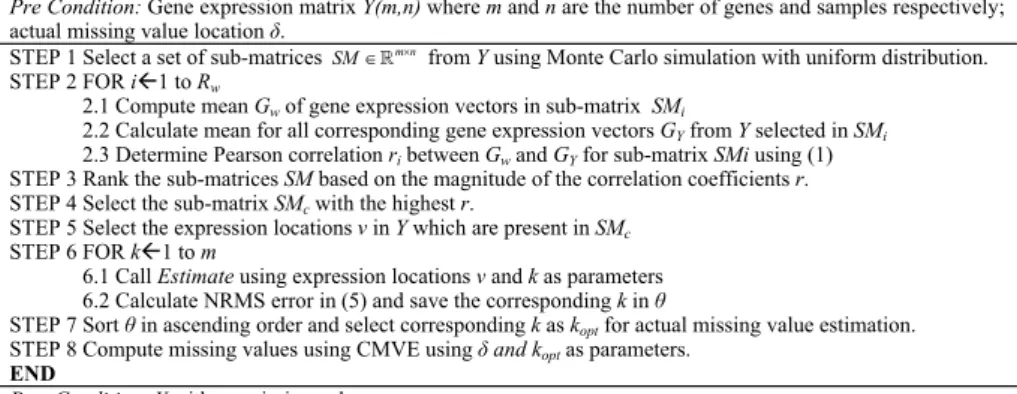
Pre Condition: Gene expression matrix Y(m,n) where m and n are the number of genes and samples respectively; actual missing value location į.
STEP 1 Select a set of sub-matrices SM m nu
\ from Yusing Monte Carlo simulation with uniform distribution. STEP 2 FOR iÅ1 to Rw
2.1 Compute mean Gw of gene expression vectors in sub-matrix SMi
2.2 Calculate mean for all corresponding gene expression vectors GY from Yselected in SMi
2.3 Determine Pearson correlation ri between Gw and GY for sub-matrix SMi using (1)
STEP 3 Rank the sub-matrices SM based on the magnitude of the correlation coefficients r. STEP 4 Select the sub-matrix SMc with the highest r.
STEP 5 Select the expression locations vin Y which are present in SMc
STEP 6 FOR kÅ1 to m
6.1 Call Estimate using expression locations v and k as parameters 6.2 Calculate NRMS error in (5) and save the corresponding k in ș
STEP 7 Sort ș in ascending order and select corresponding kas koptfor actual missing value estimation.
STEP 8 Compute missing values using CMVE using į and koptas parameters. END
Post Condition: Y with no missing values.
12 11 12 13 1 21 22 2 21 22 23 2 31 32 33 3 1 2 3 1 3 ... , , ... ... . . . . ... . . ... , n n n
Select Sub-Matrix mean
n I w m m m mn m m g g g g g g g g g g g g g g g g SM G g g g g g g ª º ª º « » « » « » « » « » « » o o « » « » « » « » « » « » ¬ ¼ ¬ ¼
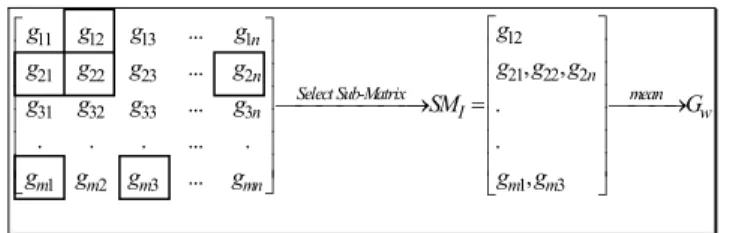
Fig. 2. A selected Sub-Matrix SM for determining the optimal value of k
an NP hard problem, so a pseudo-random generation strategy is adopted to select gene expressions from Y (Step 1, Fig. 1). A statistically conservative selection probability of 0.05 [22] is chosen for the objective function, such that there will be no missing values in the SM (See Fig. 2). In each sub-matrix SMi, genes G that are present in SMi (Step 2) are selected, such as [ 1... ]
T m n n
G= G G ∈× (Step 2). For example in Fig. 2, the SMI contains one gene expression value g12 from gene 1, three expression values {g21, g22, g2n} from gene 2, and two expression values from gene m {gm1, gm3}, while no expression was selected from gene 3 (which is normally very rare). All selected genes are represented by boxes in Fig. 2. This example highlights two key limitations for computing the correlation between Y and SMi: 1)The number of columns of SMiand Y are not equal 2) The number of rows of SMiand Y are unequal because not all the genes in Y are present in SMi, so in order to determine the correlation between Y and any sub-matrix SMi, only those genes that are selected from Y and also present in SMi, are chosen. Thus, in the Fig. 2 example, genes 1, 2 and m would be selected while gene 3 is ignored. The mean values GSM and GY of the genes vector in both Y and SMi are then computed (Step2.1). The Pearson correlation of the data is calculated (Step 2.3) to determine the maximum correlation between each selected SMi and Y from:
2 2 2 ( ) 2 ( ) w y w y i w y w y G G G G N r G G G G N N − = ⎛ ⎞ ⎛ ⎞ ⎜ − ⎟ ⎜ − ⎟ ⎜ ⎟ ⎜ ⎟ ⎝ ⎠ ⎝ ⎠
∑
∑
∑
∑
(1)The reason for selecting Pearson correlation is that it has been consistently proven to provide better performance for microarray data compared with other similarity measures [23].
The sub-matrix SMc with the maximum absolute correlation with Y represents the best correlation of Y (Step 4). Each individual value of SMc is then treated as a missing value and iteratively estimated for a range of different k values (Step 5). Since, these values are already known; the NRMSE can be computed for these estimations, so the k value which generates the minimum Root Mean Square Error (RMSE) is designated as the optimal value (kopt). This is subsequently used in the actual estimation of missing value Yij of gene i and sample j, which involves three separate estimates Ф1, Ф2 and Ф3 being generated, and the final estimate χ computed by their fusion using CMVE [13]. The CMVE technique is explained in the context of HCMVI in Appendix A (See supplementary material).
4 Analysis and Discussion of Results
4.1 Test Data
To analyze and compare the performance of the proposed HCMVI algorithm with CMVE, BPCA, LLSImpute and KNN, six microarray cancer datasets from two different studies on breast and ovarian cancer tissues were used. The data was log transformed and normalized to x=0 and σ2=1 to remove experimental variations.
The rationale behind selecting these particular datasets is that in general, cancer data lacks molecular homogeneity in tumour tissues so missing values are hard to predict in cancerous data [24].
The locally correlated breast cancer data set contained 7, 7, 8 samples of BRCA1, BRCA2 and Sporadic mutations (neither BRCA1 nor BRCA2) respectively [18], while the globally correlated ovarian cancer dataset contained 16, 16 and 18 samples respectively of BRCA1, BRCA2, Sporadic mutations [17]. Each breast cancer data sample contained microarray data of 3226 genes and there were 6445 genetic expressions per sample for the ovarian dataset.
To compare the performance of the HCMVI algorithms with CMVE and KNN, k=10 was used throughout the experiments, since the insensitivity of KNN to values of k in the range from 10 to 20 was observed by Troyanskaya et al, [11] who confirmed that the best estimation results were achieved in this interval and using a similar rationale CMVE [13] employed k=10. In contrast, LLSImpute determines the value of k using computational intensive exhaustive search method, while HCMVI automatically determines the optimal value of kopt using a non-parametric heuristic algorithm (Fig. 1), which exploits the underlying correlation structure of the data, thereby reducing the computational complexity and avoiding problems of large and small values of k highlighted in Section 1. Following six metrics are used to evaluate the performance of the new HCMVI algorithm.
4.2 Gene Regulatory Network Reconstruction
To further evaluate the influence of missing values on GRN reconstruction, the ARACNe has been employed because a study in [25] demonstrated its improved performance compared to the commonly used algorithms, like Bayesian networks [26]. Moreover the method has been tested for mammalian gene network reconstruction and compared with other techniques that are normally applied to simple eukaryotes, such as Saccharomyces cerevisiae [27].
ARACNe firstly computes gene-gene co-regulation using mutual information. The method then prunes indirect regulatory relationships that are co-regulated by one or more intermediate genes using data processing inequality. To comparatively evaluate the respective imputation performances on GRN reconstruction, the number of Conserved Links was determined, which represents whether a particular co-regulation link is present in both GRNorg and GRNimputed. The gene network GRNorg was initially constructed from the original data Y with no missing values using ARACNe. Iteratively, up to 20% missing values were randomly introduced and then respectively estimated using imputation methods. The corresponding gene networks GRNimputed
HCMVI AMVI CMVE LLSImpute BPCA KNN ZeroImpute 0 10 20 30 40 50 60 70 80 90 % A ccu ra cy Imputation Methods
% Accuracy of Conserved Links in BRCA2-Breast Cancer Data
HCMVI AMVI CMVE LLSImpute BPCA KNN ZeroImpute 0 5 10 15 20 25 30 35 % A ccu ra cy Imputation Methods
% Accuracy of Conserved Links in BRCA1-Ovarian Cancer Data
(b) (a)
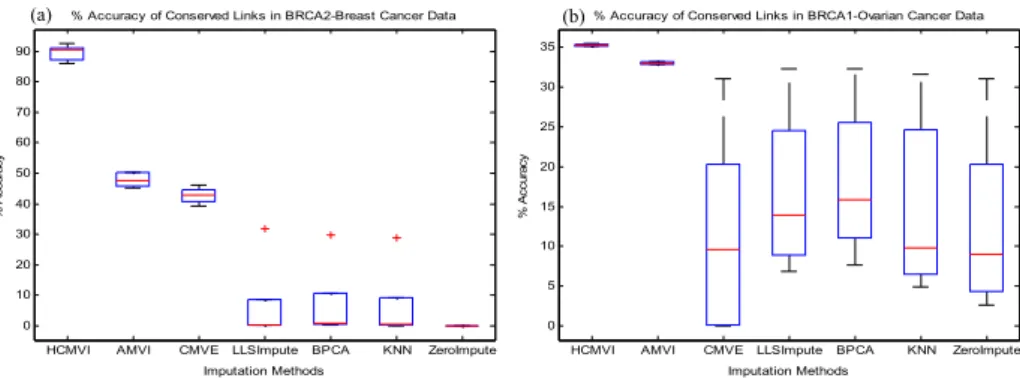
Fig. 3. Comparison of original GRN and the GRN constructed after imputation where missing values were randomly introduced in a) BRCA2-breast cancer data b) BRCA1-ovarian cancer data
were then constructed from the imputed data and GRNorg and GRNimputed compared, to ascertain the conserved links.
Fig.3 shows that the ARACNe method, which was reported to be robust [28] for GRN construction, could not maintain its performance in the presence of missing values, especially for ZeroImpute. In contrast, when HCMVI was applied, ARACNe conserved the number of links even at higher missing value probabilities. For example, in BRCA1 breast cancer data, the transcriptional link between ADP-Ribosylation Factor 3 (ARF3) and General Transcription Factor II, I, Pseudogene 1(GTF2IP1) was overlooked when missing values were imputed by comparative methods (Fig. 3(a)), but was correctly inferred when values were imputed using HCMVI. Similarly, the link between HS1 Binding Protein and Mitogen-Activated Protein Kinase 3 in BRCA2 breast cancer data was reconstructed when values were imputed using HCMVI but was neglected by all other imputation techniques. The results of Sporadic breast cancer data revealed similar observations. For example, the interaction between ARF3 and EST, which is similar to NSAP1 protein, was found when data was imputed using the HCMVI method. But it was missed by the other imputation strategies. These results further highlight the importance of accurate imputation in improving GRN reconstruction performance (See supplementary materials for details).
4.3 Gene Selection
This Section provides rigorous analytic review of gene selection results. Since, different gene selection methods produce different sets of significant genes [29] therefore; we compared the performance of imputation methods using two widely used methods namely: standard t-test and Between Sum of Squares to Within Sum of Squares (BSS/WSS).
4.3.1 Gene Selection Using t-Test
To investigate the impact of each estimation algorithm upon significant gene selection, genes were selected from both breast and ovarian cancer datasets using
HCMVI CMVE BPCA LLSImpute KNN ZeroImpute 0 0.1 0.2 0.3 0.4 0.5 0.6 0.7 0.8 0.9 Fa ls e Po s it iv e R a te (FPR ) Imputation Methods
FPR for Sporadic -BRCA1 Breas t Cancer Data using t-test
HCMVI CMVE BPCA LLSImpute KNN ZeroImpute 0 0.1 0.2 0.3 0.4 0.5 0.6 Fa ls e Po s it iv e R a te (FPR ) Imputation Methods
FPR for BRCA1-BRCA2 Ovarian Cancer Data using t-test
(a) (b)
Fig. 4. False Positive Rate of Gene Selection in a) Breast and b) Ovarian Cancer Data
t-test [30] with the established statistical P-value of 0.05 [24]. These selected genes were then, marked as StandardGenes. After that the values were randomly removed from the data with the probability range of 0.01 to 0.20 and were marked as missing. These missing values were then, imputed using above mentioned imputation methods and followed by gene selection using t-test using the same P-value of 0.05. The selected genes were then compared with the Standard Genes to compute False Positive Rate (FPR) [31] using:
False Positive FPR
True Positive + False Positive
= (2)
Fig.4 demonstrates FPR of gene selection results after imputation by the above mentioned estimation methods (See supplementary materials for the rest of the results). The results show that HCMVI had minimum FPR for both the datasets, in all the selected groups, while most of the imputation methods could not retain their performance for all the datasets. For instance, CMVE showed better FPR for Breast cancer data (Fig. 4(a)) but since the method doesn’t consider global correlations it could not hold similar performance for ovarian cancer data (Fig. 4(b)). Similarly, BPCA showed better performance for ovarian cancer data (Fig. 4(b)) due to its ability to exploit global correlation but couldn’t retain the same performance for breast cancer data (Fig. 4(a)). Both the LLSImpute and KNN methods also, showed mixed performance while not surprisingly, ZeroImpute method had highest FPR due to its inability to exploit latent correlation of the data.
4.3.2 Gene Selection Using BSS/WSS
To investigate the impact of each estimation algorithm upon significant gene selection, a set of p genes (Gorg) was selected from the original data Y using the BSS/WSS method [32], which identified those genes that concomitantly had large inter-class and small intra-class variations. For any gene i inY∈ m n×
, BSS/WSS is calculated as follows: 2 1 1 2 1 1 ( )( ) ( ) / ( ) , ( )( ) T Q t qi i t q T Q t it qi t q F L q Y Y BSS i WSS i F L q Y Y − − = = − = = = − = = −
∑ ∑
∑ ∑
(3)where T is the training sample size, Q the number of classes and F(•) is a Boolean function having value = 1 if the condition is TRUE and zero otherwise. Yidenotes the average expression level of gene i across all samples and Yq i
−
is the average expression level of gene i across all samples belonging to class q. Genes are then ranked from the highest to the lowest BSS/WSS ratio to form a significant gene expression matrix ϑ, where the first p genes are selected for subsequent analysis.
To fully test the robustness of the HCMVI algorithm, experiments were performed for missing values up to 20%, with values being iteratively removed from the original gene expression matrix Y. Missing values were then estimated using KNN, LLSImpute, BPCA, CMVE and HCMVI to form Yest, before respective sets of p genes Gest were selected using BSS/WSS, for each estimated matrix. Finally, these selected genes were compared with Gorgto give the %Accuracy.
HCMVI CM VE BPCA LLSImpute KNN ZeroImpute 0 10 20 30 40 50 60 70 80 90 100 % A c c u ra c y Imputation Methods
Gene Selection Accuracy for the First 50 Genes in Breast Cancer Data
HCMVI CM VE BPCA LLSImpute KNN ZeroImpute 0 10 20 30 40 50 60 70 80 90 100 % A c c u ra c y Imputation Methods
Gene Selection Acc uracy for the First 50 Genes in Ovarian Canc er Data
(a) (b)
Fig. 5. Gene Selection Accuracy for 50 Significant Genes in a) Breast and b) Ovarian Cancer
To eliminate performance variations with respect to the number of selected genes in the BSS/WSS method, all imputation techniques were tested for 1000 and 50 significant genes with the graphs in Fig. 5 displaying the gene selection performance for 50 significant genes (Supplementary materials for the results on 1000 significant genes). The results reveal the consistent better performance of HCMVI over the other imputation methodologies because of its ability to exploit both local and global correlations within the data. HCMVI performed equally well for both types of data with the average overall improvement being 60% and 48% for breast and ovarian cancer datasets respectively. The results also highlighted some other noteworthy points: even though HCMVI consistently performed better than comparative algorithms, its performance was better for the breast cancer dataset than ovarian cancer because the latter contained some actual missing values which influence gene selection. The CMVE algorithm using a fixed k performed better than BPCA, LLSImpute, KNN and ZeroImpute (Fig. 5(a)) for the locally correlated Breast cancer data, but was unable to maintain this performance for the ovarian cancer (globally correlated) data (Fig. 5(b)). Similarly, BPCA performed better than the aforementioned algorithms for the ovarian cancer data because of its inherent ability to exploit global correlations, though in contrast its performance deteriorated significantly for breast cancer data. The next Section focuses on non-parametric significance test results.
HCMVI CM VE LLSIm pute BPCA KNN ZeroImpute 0 0.1 0.2 0.3 0.4 0.5 0.6 0.7 0.8 0.9 1 P -V a lu e of S im il a ri ty B e tw een A c tual an d E s ti mat ed D a ta Imputation Methods
Significance Test Results for BRCA1 Breas t Canc er Data
HCMVI CM VE LLSIm pute BPCA KNN ZeroImpute 0 0.1 0.2 0.3 0.4 0.5 0.6 0.7 0.8 0.9 1 P -V a lu e of S im il a ri ty B e tw een A c tual an d E s ti mat ed D a ta Imputation Methods
Signific ance Test Res ults for BRCA2 Ovarian Cancer Data
(a) (b)
Fig .6. Significance Test Results for a) BRCA1-Breast and b) BRCA-2 Ovarian Cancer Data 4.4 Wilcoxon Rank Sum Significance Test
To evaluate the estimation performance of all the imputation algorithms on empirical grounds and variance stability, the two-sided Wilcoxon Rank sum statistical significance test was applied. The motivation for using this particular test is that compared to some other parametric significance tests such as t-test [33], it does not mandate the data has to have equal variance, which is vital given the variance of data can be disturbed due to erroneous estimation, especially for ZeroImpute. To test the hypothesis H0, Y = Yest where Y and Yest are the actual and estimated matrices respectively, the P-Value of the hypothesis is calculated as:
1 )
0, r r
H P-Value= −2P (R≤y (4)
where yr is the sum of the ranks of observations for Y and Ris the corresponding random variable. Fig. 6 plots the P-Value of similarity between the actual and estimated matrices. The results again corroborate that HCMVI performed better than all the other comparative algorithms for both locally and globally correlated datasets because of its better estimation capability. A similar trend is observed by the imputation strategies in terms of the statistical significance test results as witnessed for significant gene selection in the above Section. It is interesting to note that HCMVI performed consistently better for all the datasets, as shown in Fig. 6, where the performance of other algorithms was highly data dependent.
Interestingly, HCMVI proved to be robust for both cancer datasets which is certainly not the case for other imputation techniques who performed well for one data type, but failed for the other (Fig.3-6). For instance, CMVE, generally performed better than BPCA, KNN, ZeroImpute, and LLSImpute for breast cancer data (Figs. 3(a) - 6(a)), but this was not sustained for ovarian cancer data (Figs. 3(b) - 6(b)), where BPCA proved a better choice for this globally correlated dataset. Not surprisingly, ZeroImpute exhibited the widest disparity on statistical grounds, so inculcating the importance of estimating any missing values rather than simply imputing zeros.
4.5 Normalized Root Mean Square Error
For completeness the estimation performance of HCMVI and comparative imputation methods was also analyzed using the traditional parametric Normalized Root Mean
K NN B P CA LLS Im pute CM V E HCM V I 0 0.1 0.2 0.3 0.4 0.5 0.6 0.7 N R M SE Im putation M ethods NRM S E in S poradic -Ovarian Canc er Data
Fig. 7. NRMSE in Sporadic-Ovarian Cancer Data
Square Error (NRMSE) measure, despite its limitations in reflecting the true impact of missing values on subsequent biological analysis. NRMSE is defined as:
( ) ( ) est RMS Y Y RMS Y − Θ = (5)
where Y is the original data matrix and Yest is the estimated matrix using HCMVI, CMVE, BPCA, LLSImpute and KNN respectively. This particular measure has been used by Sehgal et al, [13], Ouyang et al, [20] and Tuikkala et al [7] for error estimation because Θ =1 for zero imputation.
Fig.7 shows boxplot of NMRS Error for different imputation algorithms (See supplementary material for the rest of the results). It again confirms the better performance of HCMVI and reiterates the value of accurately exploiting information about the underlying correlation structure of the data instead of using a preset value. Interestingly LLSImpute exhibited similar performance to HCMVI so justifying the merit of using other metrics to dispassionately compare the performance of different imputation strategies. As highlighted earlier, accurate imputation plays a crucial role in selecting the correct set of genes for a given biological process, so an analysis of the biological significance of the various imputation results has been undertaken with the key finings presented in the next Section.
4.6 Biological Significance
As alluded to earlier, different analytical methods will by virtue of their underlying assumptions generate differing gene lists, so an attempt has been made to assess the significance of the results for HCMVI from a biological perspective. Any superior imputation technique can be reasonably expected to return genes that have been implicated in the biological process when independent experiments are studied. Indeed, as microarray experiments effectively serve as a hypothesis generation step, it is constructive to ascertain whether a method not only identifies known genes, but also novel genes including hypothetical ones, about which little is known so that appropriate additional experiments can be performed. This may provide not only valuable information for the design of basic mechanistic, diagnostic and biomarker studies, but also further data for use in the construction of gene networks and pathways involved in processes like oncogenesis and resistance to tumour induction.
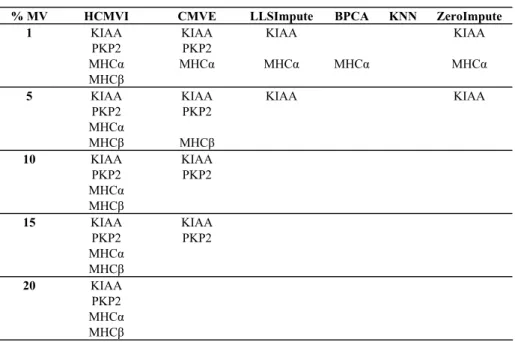
Table 1. KIAA1025 (KIAA) and Plakophilin2 (PKP2) Selection in Breast Cancer Dataset and MHC Class II=DQ alpha (MHCα) and MHC Class II=DQ beta (MHCβ) Selection in Ovarian Cancer across the Range of Missing Values Across the Range of Missing Values
% MV HCMVI CMVE LLSImpute BPCA KNN ZeroImpute
1 KIAA PKP2 MHCĮ MHCȕ KIAA PKP2 MHCĮ KIAA MHCĮ MHCĮ KIAA MHCĮ 5 KIAA PKP2 MHCĮ MHCȕ KIAA PKP2 MHCȕ KIAA KIAA 10 KIAA PKP2 MHCĮ MHCȕ KIAA PKP2 15 KIAA PKP2 MHCĮ MHCȕ KIAA PKP2 20 KIAA PKP2 MHCĮ MHCȕ
While the final validation of HCMVI as an imputation strategy will only be truly achieved when the role of newly predicted genes are validated in biological experiments, it is instructive to examine the list of candidate genes to determine whether any are independently validated.
In examining both the breast and ovarian cancer datasets, HCMVI identified a number of genes overlooked by all the other algorithms and which, independent experiments [34] confirm, alter expressions in tumor lines and so could be important in oncogenesis. This set of genes has not only been selected by BSS/WSS algorithm but has been revalidated using the modified t-test with greedy pairs method [35] which minimizes the bias of the gene selection strategy towards either a particular imputation technique or a set of genes.
For example, as the results in Table 1 reveal, the KIAA1025 protein has not been selected when values are imputed using KNN, LLSImpute, BPCA and CMVE, but has been identified when gene selection is preceded by HCMVI imputation (See also supplementary material). This is an important protein which is co-regulated with estrogen receptors for both in vivo and clinical data, which are expressed in more than 66% of human breast tumors [19]. Another gene selected by HCMVI across the range of missing values is plakophilin 2 (PKP2) which is a common protein and exhibits a dual role, appearing as both a constitutive karyoplasmic protein and a desmosomal
plaque component for all the desmosome-possessing tissues and cell culture lines. The gene is found in breast carcinoma cell lines [36] and furthermore, because of its significance it can serve as a marker for the identification and characterisation of carcinomas derived either from or corresponding, to simple or complex epithelia [37] (See Table 1).
Similar observations can be made in the study of significant genes in the ovarian cancer dataset. For instance, MHC Class II=DQ alpha (MHCα) and MHC Class II=DQ beta (MHCβ) genes are linked to the immune system and have been shown to be down-regulated for ovary syndrome [38]. Also, the allele gene is present at a higher frequency in patients with malignant melanoma than in Caucasian controls. These genes help in particular to diagnose melanoma patients in the relatively advanced stages of the disease and/or patients who are more likely to have a recurrence [39]. The results reveal that these genes have been correctly identified by HCMVI while being consistently missed by other imputation methods, especially for higher numbers of missing values (See Table 1 and supplementary material).
For both cancer datasets, in every case these regulated genes have been correctly identified when gene selection followed imputation by HCMVI for the full range of missing values from 1% to 20% as confirmed in Tables 1 and 2. Summarizing, these biological significance results demonstrate the robustness of the HCMVI algorithm in correctly estimating missing values for different data types by adapting to both the causal global and local correlation structures of the data in contrast to all other imputation algorithms, especially for higher numbers of missing values.
5 Conclusions
This paper has presented a new Heuristic Non Parametric Collateral Missing Value Imputation (HCMVI) algorithm based upon the concept of constructing an optimal sub-matrix of the most correlated genes to determine the optimal value of k predictor genes to be applied in the imputation process. HCMVI has demonstrated an ability to adapt to both the local and global correlations, with experimental results for gene selection, statistical significance tests, biological significance and the Normalized Root Mean Square Error measure proving that it provided lower estimation errors compared to existing missing value imputation algorithms including CMVE, KNN, LLSImpute, ZeroImpute and BPCA. In particular, GRN reconstruction results showed the improved performance of 90% and 35% for both breast and ovarian cancer data. Similarly, gene selection results revealed an overall improved selection performance of 60% and 48% respectively for breast and ovarian cancer data, while the biological significance results upon selected genes demonstrated that key breast cancer genes like plakophilin2, KIAA1025 and MHC Class II=DQ are consistently correctly identified by HCMVI for the full range of missing values, while being overlooked by other imputation methods. The HCMVI strategy of exploiting a combination of underlying correlations in a dataset together with the automatic selection of the optimal k using a Heuristic Non Parametric approach has proven to be more effective, less computational intensive and robust than using either a preset k value or determining its value by exhaustive search.
References
[1] T. S. Furey, N. Cristianini, N. Duffy, D. W. Bednarski, M. Schummer, and D.Haussler, "Support vector machine classification and validation of cancer tissue samples using microarray expression data," Bioinformatics, vol. 16(10), pp. 906-914, 2004.
[2] B. Gustavo and C. M. Monard, "An analysis of four missing data treatment methods for supervised learning," Applied Artificial Intelligence, vol. 17(5-6), pp. pp. 519-533, 2003. [3] S. Ramaswamy, P. Tamayo, R. Rifkin et al., "Multiclass cancer diagnosis using tumour
gene expression signatures," Proc. Natl. Acad. Sci, pp. 98(26):15149-15154, 2001. [4] M. A. Shipp, K. N. Ross, P. Tamayo et al., "Diffuse large B-cell lymphoma outcome
prediction by gene expression profiling and supervised machine learning," Nat Med, vol. 8(1), pp. 68-74, 2002.
[5] T. R. Golub, D. K. Slonim, P. Tamayo et al., "Molecular classification of cancer: class discovery and class prediction by gene expression monitoring," Science, pp. 286(5439):531-537, 1999.
[6] K. Munagala, R. Tibshiran, and P. O. Brown, "Cancer characterization and feature set extraction by discriminative margin clustering," BMC Bioinformatics, vol. 5, pp. 21, 2004.
[7] J. Tuikkala, L. Elo, O. S. Nevalainen, and T. Aittokallio, "Improving missing value estimation in microarray data with gene ontology," Bioinformatics, pp. 566-572, 2005. [8] S. Oba, M. A. Sato, I. Takemasa, M. Monden, K. Matsubara, and S. Ishii, "A Bayesian
Missing Value Estimation Method for Gene Expression Profile Data," Bioinformatics, vol. 19, pp. 2088-2096, 2003.
[9] E. Acuna and C. Rodriguez, "The treatment of missing values and its effect in the classifier accuracy," Classification, Clustering and Data Mining Applications, pp. 639-648, 2004.
[10] H. Kim, G. H. Golub, and H. Park, "Missing value estimation for DNA microarray gene expression data: local least squares imputation," Bioinformatics, vol. 21, pp. 187-198, 2005.
[11] O. Troyanskaya, M. Cantor, G. Sherlock, P. Brown, T. Hastie, R. Tibshirani, D. Botstein, and R. Altman, "Missing Value Estimation Methods for DNA Microarrays,"
Bioinformatics, vol. 17, pp. 520-525, 2001.
[12] T. H. Bø, B. Dysvik, and I. Jonassen, "LSimpute: Accurate estimation of missing values in microarray data with least squares methods," Nucleic Acids Res., pp. 32(3):e34, 2004. [13] M. S. B. Sehgal, I. Gondal, and L. Dooley, "Collateral Missing Value Imputation: a new
robust missing value estimation algorithm for microarray data," Bioinformatics, vol. 21(10), pp. 2417-2423, 2005.
[14] M. S. B. Sehgal, I. Gondal, and L. Dooley, "Missing Value Imputation Framework for Microarray Significant Gene Selection and Class Prediction," Lecture Notes in Bioinformatics (LNBI), Springer-Verlag, vol. 3916, pp. 131-142, 2006.
[15] J. P. Stevens, Applied Multivariate Statistics for the Social Sciences: LEA, Inc., 2001. [16] D. H. Voelker, P. Z. Orton, and S. Adams, Statistics: Cliffs Notes, 2001.
[17] A. J. Amir, C. J. Yee, C. Sotiriou et al., "Gene Expression Profiles of Brca1-Linked, Brca2-Linked, and Sporadic Ovarian Cancers," Journal of the National Cancer Institute, vol. 94 (13), 2002.
[18] I. Hedenfalk, D. Duggan, Y. Chen et al., A. Borg, and J. Trent, "Gene-expression profiles in hereditary breast cancer," N. Engl. J. Med, pp. 22; 344(8):539-548, 2001.
[19] D. M. E. Harvell, J. K. Richer, D. C. Allred, C. A. Sartorius, and K. B. Horwitz, "Estradiol Regulates Different Genes in Human Breast Tumor Xenografts Compared with the Identical Cells in Culture," Endocrinology, vol. 147, pp. 700-713, 2006.
[20] M. Ouyang, W. J. Welsh, and P.Georgopoulos, "Gaussian Mixture Clustering and Imputation of Microarray Data," Bioinformatics, vol. 20(6), pp. 917-923, 2004.
[21] M. S. B. Sehgal, I. Gondal, and L. Dooley, "A Collateral Missing Value Estimation Algorithm for DNA Microarrays," IEEE International Conference on Acoustics, Speech, and Signal Processing (ICASSP), USA, pp. 377-380, 2005.
[22] R. P. Abelson, Statistics as Principled Argument: Lawrence Erlbaum Associates, 1995. [23] G. Yona, W. Dirks, S. Rahman, and D. M. Lin, "Effective similarity measures for
expression profiles," Bioinformatics, vol. 22, pp. 1616-1622, 2006.
[24] R. Jornsten, H.-Y. Wang, W. J. Welsh, and M. Ouyang, "DNA microarray data imputation and significance analysis of differential expression," Bioinformatics, vol. 21, pp. 4155-4161, 2005.
[25] K. Basso, A. A. Margolin, G. Stolovitzky, U. Klein, R. Dalla-Favera, and A. Califano, "Reverse engineering of regulatory networks in human B cells," Nature Genetics, vol. 37, pp. 382-390, 2005.
[26] F. V. Jensen, Bayesian Networks and Decision Graphs, 2 ed: Springer, 2002.
[27] J. Ihmels, R. Levy, and N. Barkai, "Principles of transcriptional control in the metabolic network of Saccharomyces cerevisiae," Nature Biotechnology, vol. 22, pp. 86-92, 2003. [28] A. A. Margolin, I. Nemenman, K. Basso et al., "ARACNE: An Algorithm for the
Reconstruction of Gene Regulatory Networks in a Mammalian Cellular Context," BMC Bioinformatics, vol. 7, 2006.
[29] I. B. Jeffery, D. G. Higgins, and A. C. Culhane2, "Comparison and evaluation of methods for generating differentially expressed gene lists from microarray data," BMC Bioinformatics, vol. 7, 2006.
[30] S. Eschrich and T. J. Yeatman, "DNA Microarrays and Data Analysis: An Overview,"
Surgery, ELSEVIER, vol. 136, pp. 500-503, 2004.
[31] R. Jornsten, H.-Y. Wang, W. J. Welsh, and M. Ouyang, "DNA microarray data imputation and significance analysis of differential expression," Bioinformatics, vol. 21, pp. 4155-4161, 2005.
[32] S. Dudoit, J. Fridlyand, and T. P. Speed, "Comparison of discrimination methods for the classification of tumors using gene expression data," Journal of the American Statistical Association, pp. 77-78, 2002.
[33] Z. Sidak, P. K. Sen, and J. Hajek, Theory of Rank Tests (Probability and Mathematical Statistics): Academic Press, 1999.
[34] S. Salceda, C. Drumright, A. DiEgidio et al."Identification of differentially expressed genes in breast cancer," Nature Genetics, vol. 27, pp. 83-84, 2001.
[35] T. H. Bø and I. Jonassen, "New feature subset selection procedures for classification of expression profiles," Genome Biology, vol. 3(4), pp. research0017.1–research0017.11, 2002.
[36] C. Mertens, C. Kuhn, and W. Franke, "Plakophilins 2a and 2b: constitutive proteins of dual location in the karyoplasm and the desmosomal plaque," J. Cell Biol., vol. 135, pp. 1009-1025, 1996.
[37] C. Mertens, C. Kuhn, R. Moll, I. Schwetlick, and W. W. Franke, "Desmosomal plakophilin 2 as a differentiation marker in normal and malignant tissues,"
[38] E. Jansen, J. S. E. Laven, H. B. R. Dommerholt et al., "Abnormal Gene Expression Profiles in Human Ovaries from Polycystic Ovary Syndrome Patients," Mol Endocrinol, vol. 18, pp. 3050-3063, 2004.
[39] M. Lu, W. A. Thompson, D. A. Lawlor, J. D. Reveille, and J. E. Lee, "Rapid direct determination of HLA-DQB1 * 0301 in the whole blood of normal individuals and cancer patients by specific polymerase chain reaction amplification," Journal of Immunological Methods, vol. 199, pp. 61-68, 1996.