MODELLING UNCERTAINTY OF COST AND TIME IN INFRASTRUCTURE PROJECTS
by
Alireza Moghayedi
Thesis Presented for the Degree of DOCTOR OF PHILOSOPHY
in the
Department of Construction Economics and Management
UNIVERSITY OF CAPE TOWN
FACULTY OF ENGINEERING AND THE BUILT ENVIRONMENT
SUPERVISED BY
A/PROFESSOR ABIMBOLA OLUKEMI WINDAPO
OCTOBER 2019
University
of
Cape
The copyright of this thesis vests in the author. No
quotation from it or information derived from it is to be
published without full acknowledgement of the source.
The thesis is to be used for private study or
non-commercial research purposes only.
Published by the University of Cape Town (UCT) in terms
of the non-exclusive license granted to UCT by the author.
University
of
Cape
i
ABSTRACT
The construction of infrastructure projects is characterised by cost overruns and time delays. Scholars view that the estimation approach and inappropriate tools and techniques used to forecast possible uncertainty in the construction processes are a primary cause of cost overruns and time delays on construction projects. Uncertainties encountered in the construction process are underestimated and these impact on the final cost and time of construction projects through a combination of individual construction activities. The study, therefore, examines the initial and final cost of construction activities, towards developing a hybrid tool that captures and models’ different sources of uncertainty in infrastructure projects and their effect on cost and time underestimation.
The study adopted a sequential exploratory mixed method research approach that went beyond the basic mixed method approaches, employing a combination of sequential and concurrent aspects of mixed methods. Data was gathered through a series of expert panel estimation sessions, technical brainstorming of experienced professionals (with 30 years’ experience and more) in the construction of infrastructure projects, and a structured self-administered questionnaire survey distributed to project managers of South African highway projects. The developed hybrid tool models the main structures from the activity level to the entire highway project. Consequently, three identified uncertainties in the construction process of infrastructures, namely variability in the construction process, correlations between the costs, times and cost-time of construction activities and disruptive events, are modelled jointly at the construction activity level.
Data obtained from both qualitative and quantitative approaches were analysed using various techniques. The probability distribution function of cost and time were modelled using the lognormal and triangular probability distributions; while Monte Carlo Simulation (MCS), Copula analysis technique, the Markov processes, and Adaptive Neuro-Fuzzy Inference System (ANFIS) analytical technique were used in modelling the variability of the cost and time activity, correlation between costs, time and cost-time activities, and to model the occurrence of disruptive events, so that the impact size of disruptive events on the cost and time of activities respectively, can be intelligently assessed. The developed uncertainty model was validated against the final cost and time of a project case study, as well as against historical data of construction cost overruns and time delays in infrastructure projects.
The study found that the different uncertainties had a distinct influence on construction cost and time of different project structures. Furthermore, the comparison of the deterministic estimates with the uncertainty estimates shows that the accumulated impact of the three uncertainty sources significantly increases the construction cost and time of infrastructure projects. Based on these findings, the research concludes that the disruptive event is the main cause of cost overruns and time delays in infrastructure projects. In the scale of activity, the correlation between the costs of different activities in the same structure causes the largest increase in the cost of activity, while
ii
the correlation between the times of repeated activity in the same structure causes the largest increase in time of the activity. Furthermore, the study concludes that the improvement in the accuracy of cost and time estimation of infrastructure projects depends on a combination of probability analysis and intelligent machine learning. The contributions of the study to construction management knowledge include a clear definition of uncertainty and the sources of uncertainties in the construction of infrastructure projects; an in-depth understanding of the construction process of linear infrastructure projects; and an improvement in the quality of data used (combination of experts’ estimation and historical data) for research in the area of project performance. The developed uncertainty model based on three sources of uncertainty at the activity level provides infrastructure project planners with a hybrid dynamic tool to accurately model and predict the construction cost and time of infrastructure projects at any stage of the project. Also, the uncertainty model has three other purposes: it is the preparatory point for allocation of budget, it facilitates the update of the impact of uncertainties and evaluates the effectiveness of countermeasures to mitigate against the threat of uncertainties.
iii
DECLARATION STATEMENT
I declare that the contents of this thesis signify my own work, except for the specific and acknowledged references to the published work of others made in the text. I declare that it contains neither material previously published, nor material submitted in parts or whole for the award of any other degree or qualification.
Signed:
Moghayedi A.
iv
DEDICATION
This thesis is dedicated to my parents who have always loved me unconditionally. This thesis is also dedicated to my wife, for her love, endless support and encouragement
مردپ ناتسد بر سهوب اب میدقت
ربز زا مناد یمن هک وا به
.شتواخس یگنادرم ای میوگب شا یگ
.میگدنز مامت هروطسا مردپ
مناج زا تریززع درام به میدقت
.تسود تمراد یتسه و متسه تا تسوت یتسه ز نم یتسه مدرام
.مدرام ینادواج راسگمغ
منابرهم رسمه به میدقت
متسه شنطاب یافص نویدم ار مشمارآ و یتخبشوخ هک
v
ACKNOWLEDGEMENTS
I would love to thank God Almighty for being my strength through this PhD journey.
First and foremost, I would like to express my heartiest gratitude to my PhD supervisor Associate Professor Abimbola Olukemi Windapo for her incredible patience, motivation and unconditional support throughout this journey. Her immense knowledge and skill that she’s shared with me throughout this journey, is but one of the many things I deeply grateful for. I am extremely grateful for what she has offered me in the discipline of research and undertaking the process in a fun and enthusiastic way, I could not have imagined having a better mentor and supervisor than her. Thank you.
I consider myself very fortunate to have undertaken my PhD research journey in the Construction Economics and Management Department at University of Cape Town (UCT). Along the journey I have had the great pleasure of crossing paths with great acquaintances, many of whom contributed to the successful completion of my PhD through their sheer support and motivation and sometimes, words of encouragement. I would like to thank the Head of Department, A/Professor Kathy Michell for giving me the opportunity to undertake this project in the (CEM) department and her unrelenting support. I would also love to thank Professor Paul Bowen for his constructive comments and suggestions.
I would love to extend my gratitude to A/Professor Francois Viruly, A/Professor Manya Mooya, Mrs Karen Le Jeune, Mrs Amanda Mtya, Mr Mark Massyn, Mr Saul Nurick, Mr Uche Ordor and lastly, Mr Mochelo Lefoka for their continuous support and encouragement in completing this work. I would love to additionally thank the entire staff in the Construction Economics and Management department, particularly Mrs Thompsett, Mareldia Fagodien and Mrs Daries, for their support.
I am most grateful to Dr A. Adediran for his help with my transferring process to Cape Town. I also like to thank all my fellow postgrad colleagues for their moral support throughout this journey. A big thanks to Ms Val Bruce and Ms Pauline de Villiers for editing and proofreading this thesis. I would love to express my profound gratitude to my parents and sisters for their love, prayers, and consistent encouragement they so graciously extended to me to ultimately bring this study to completion.
Finally, most special and unending appreciations to my loving wife Pegah for being my pillar of strength and for being so understanding and patient with me through this journey. I would love to thank my daughter, my little princess Mah Arya and my son, the little prince Medrik; I am eternally indebted to you for all of success.
vi
The financial assistance from the Postgraduate Funding Office, University of Cape Town, South Africa and the National Research Foundation (NRF Grant Number 105301) towards this research is hereby acknowledged. Opinions expressed, and conclusions arrived at, are those of the author and are not necessarily to be attributed to the University of Cape Town or the NRF.
vii
PUBLICATIONS ARISING FROM THE THESIS
Journal articles
Moghayedi, A. and Windapo, A. 2018. Identification of the uncertain events impacting on construction time of South African highway projects. Journal of Construction Project Management and Innovation. 8(1). Pp 2146-2163.
Moghayedi, A. and Windapo, A. 2019. Key disruptive events impacting on the completion time of highway construction projects. Frontiers of Engineering Management. Accepted for publication.
Moghayedi, A. and Windapo, A. 2018. Modelling uncertainty of infrastructure projects to improving the prediction of construction cost and time using intelligent machine learning. Journal of Construction Engineering and Management. (Under review).
Chapter of book
Moghayedi, A. and Windapo, A. 2019. Validity and reliability of intelligent machine learning on predicting construction cost and time of infrastructure projects. Validity and Reliability in Built Environment Research: A Selection of Case Studies. Routledge-Taylor & Francis Group.
Conference papers
Moghayedi, A. and Windapo, A. 2019. Predicting the impact size of disruptive events on construction cost and time of highway projects using ANFIS technique, Construction in the 21st Century (CITC 11), September 9-11, 2019, UK.
Moghayedi, A. and Windapo, A. 2019. Modelling correlations in highway construction projects, Construction in the 21st Century (CITC 11), September 9-11, 2019, UK.
Moghayedi, A. and Windapo, A. 2019. Assessing the impact of disruptive events on construction cost of highway projects using Artificial intelligent, European Conference on Computing in Construction, July 10-12, 2019, Greece.
Moghayedi, A. and Windapo, A. 2018. A Technique for Accurately Predicting the Impact Size of Disruptive events on construction Time, 42nd Australasian Universities Building Education Association Conference, Singapore, September 2018.
Moghayedi, A. and Windapo, A. 2018. Identification of the Uncertain Events Impacting on Construction Time of South African Highway Projects, 10th cidb Postgraduate Conference, Port Elizabeth, South Africa, February 2018.
viii
Moghayedi, A. and Windapo, A. 2017. Developing a Data Gathering Tool for Modelling Uncertainty in Highway Projects, Construction in the 21th Century (CITC-9), Dubai, United Arab Emirates, March 2017.
Moghayedi, A. and Windapo, A. 2016. Modelling Uncertainty of Cost and Time in Infrastructure Projects, International Conference on Infrastructure Development and Investment Strategies for Africa (DII 2016), Zambia, August 2016.
ix
TABLE OF CONTENTS
ABSTRACT ... I DECLARATION STATEMENT ... III DEDICATION ... IV ACKNOWLEDGEMENTS ... V PUBLICATIONS ARISING FROM THE THESIS ... VII TABLE OF CONTENTS ... IX LIST OF TABLES ... XVII LIST OF FIGURES ... XX
CHAPTER ONE : GENERAL INTRODUCTION ... 1
1.1 INTRODUCTION ... 1
1.2 BACKGROUND TO THE RESEARCH ... 1
1.3 STATEMENT OF THE PROBLEM ... 4
1.4 RESEARCH QUESTIONS ... 4
1.5 AIM OF THE RESEARCH ... 5
1.6 OBJECTIVES OF THE RESEARCH ... 5
1.7 SIGNIFICANCE OF THE STUDY... 5
1.8 OVERVIEW OF THE RESEARCH METHODOLOGY ... 7
1.9 SCOPE AND LIMITATIONS OF THE STUDY ... 10
1.10 THESIS STRUCTURE ... 10
1.11 SUMMARY OF THE CHAPTER ... 11
CHAPTER TWO : LITERATURE REVIEW ... 13
2.1 INTRODUCTION ... 13
2.2 CONSTRUCTION OF INFRASTRUCTURE PROJECTS ... 13
2.3 COST AND TIME UNDERESTIMATION IN THE CONSTRUCTION OF INFRASTRUCTURE PROJECTS ... 14
2.4 STATISTICAL STUDIES OF COST AND TIME UNDERESTIMATION IN THE CONSTRUCTION OF INFRASTRUCTURE PROJECTS ... 16
2.4.1 Overview of cost underestimation ... 16
2.4.2 Overview of time underestimation ... 17
2.5 CAUSES OF COST AND TIME UNDERESTIMATION IN THE CONSTRUCTION OF INFRASTRUCTURE PROJECTS AND MITIGATION STRATEGIES ... 17
2.5.1 Causes of cost and time underestimation on infrastructure projects... 18
2.5.2 Mitigation measures ... 19
2.5.2.1 Reference Class Forecasting (RCF) ... 20
x
2.6 UNCERTAINTY VERSUS RISK ... 22
2.7 RISK IN THE CONSTRUCTION OF INFRASTRUCTURE PROJECTS ... 23
2.7.1 Risk definition ... 23
2.7.2 Risk strategy... 24
2.7.2.1 Risk identification ... 25
2.7.2.2 Risk analysis ... 27
2.7.2.3 Risk planning and mitigation ... 28
2.7.2.4 Risk allocation ... 28
2.7.2.5 Risk monitoring and controlling ... 28
2.8 UNCERTAINTY IN THE CONSTRUCTION OF INFRASTRUCTURE PROJECTS .. 29
2.8.1 Variability in the construction process ... 29
2.8.2 Correlation between construction activities’ cost and time ... 30
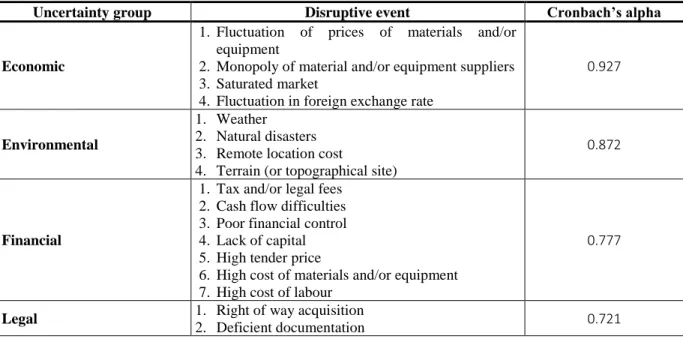
2.8.3 Disruptive events ... 30 2.8.3.1 Economic factors ... 34 2.8.3.2 Environmental factors ... 34 2.8.3.3 Financial factors ... 34 2.8.3.4 Legal factors ... 35 2.8.3.5 Political factors ... 35 2.8.3.6 Social factors ... 35 2.8.3.7 Technical factors ... 35
2.9 ESTIMATION OF COST AND TIME IN INFRASTRUCTURE PROJECTS ... 36
2.9.1 Estimation evolution and accuracy ... 36
2.9.2 Estimation methods ... 38
2.9.2.1Expert judgment estimation ... 38
2.9.2.2Analogous estimation ... 38
2.9.2.3Engineering build-up estimation ... 39
2.9.2.4Parametric estimating ... 39
2.9.2.5Hybrid estimating models ... 40
2.9.3 Cost Estimation Validation Process (CEVP) ... 41
2.10 SUMMARY OF THE CHAPTER ... 43
CHAPTER THREE : THEORETICAL AND CONCEPTUAL FRAMEWORK ... 44
3.1 INTRODUCTION ... 44
3.2 THEORETICAL PERSPECTIVES ON ESTIMATION OF COST AND TIME OF INFRASTRUCTURE PROJECTS ... 44
3.2.1 Deterministic theory... 44
3.2.3 Probabilistic theory ... 45
3.3 MODERN PORTFOLIO THEORY ... 46
3.4 CONCEPTUAL FRAMEWORK OF THE STUDY ... 47
xi
3.5.1 The association between project characteristics, cost and duration of infrastructure
projects ... 51
3.5.2 The association between the impacts of different sources of uncertainty and the cost of infrastructure projects. ... 52
3.5.3 The difference between the estimations of cost and time and actual cost and time of the construction of infrastructure projects ... 53
3.6 SUMMARY OF THE CHAPTER ... 54
CHAPTER FOUR : RESEARCH DESIGN AND METHODOLOGY ... 55
4.1 INTRODUCTION ... 55
4.2 RESEARCH PHILOSOPHY ... 56
4.2.1 Ontology ... 56
4.2.2 Epistemology ... 56
4.2.3 Axiology ... 57
4.3 THE RESEARCH PARADIGMS IN CONSTRUCTION MANAGEMENT ... 57
4.3.1 Positivism ... 58
4.3.2 Realism ... 59
4.3.3 Interpretivism ... 59
4.3.4 Pragmatism ... 59
4.4 RESEARCH APPROACH ... 60
4.4.1 Qualitative research approach ... 60
4.4.2 Quantitative research approach ... 61
4.4.3 Mixed method research approach ... 62
4.4.4 Research approach adopted in this study ... 63
4.5 STUDY POPULATION ... 66
4.6 SAMPLING TECHNIQUE AND SAMPLE SIZE ... 66
4.7 UNIT OF ANALYSIS ... 66
4.8 METHOD OF DATA COLLECTION ... 69
4.8.1 Questionnaire ... 69
4.8.2 Experts’ estimation ... 69
4.8.2.1Panel estimation of variability ... 70
4.8.2.2Panel estimation of correlation ... 70
4.8.3 Group experts’ brainstorming ... 70
4.9 METHODS OF DATA ANALYSIS ... 70
4.9.1 Qualitative data analysis ... 71
4.9.2 Quantitative data analysis ... 71
4.9.2.1 Construction model of the highway infrastructure project ... 71
4.9.2.2 Bibliometrics ... 84
4.9.2.3 Probability distribution ... 85
4.9.2.4 Copula analysis ... 87
xii
4.9.2.6 The Markov process ... 88
4.9.2.7 Stepwise regression analysis ... 89
4.9.2.8 Wilcoxon signed rank test ... 89
4.9.2.9 Chi-Square test for independence ... 90
4.9.3 Mixed data analysis... 90
4.9.3.1 ANFIS ... 90
4.9.4 Modelling of variability in the construction process ... 91
4.9.5 Modelling of correlation between construction activities’ cost/time ... 92
4.9.6 Modelling of disruptive events ... 96
4.9.6.1 Modelling the impact size of disruptive events using intelligent machine learning . 96 4.9.6.2 Developing ANFIS structure ... 99
4.10 INSTRUMENTS OF DATA COLLECTION ... 104
4.10.1 Quantitative strand ... 104
4.10.1.1Questionnaire ... 104
4.10.1.2Expert estimation ... 105
4.10.2 Qualitative strand ... 106
4.10.3 Criteria for judging the quality of research design ... 107
4.10.3.1Validity and reliability in quantitative research ... 107
4.10.3.2Validity and reliability in qualitative research ... 113
4.11 ETHICAL CONSIDERATIONS ... 114
4.12 SUMMARY OF THE CHAPTER ... 114
CHAPTER FIVE : DATA PRESENTATION AND ANALYSIS ... 115
5.1 INTRODUCTION ... 115
5.2 CASE STUDY PROJECT ... 115
5.2.1 Description of the case study ... 115
5.3 DATA ANALYSIS ... 116
5.3.1 Variability in construction process of highway project ... 116
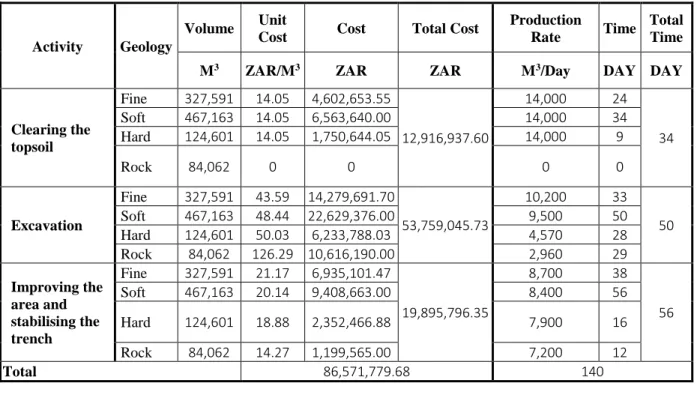
5.3.1.1 Deterministic estimation of earthwork structure ... 116
5.3.1.2 Variability estimation of earthwork structure ... 117
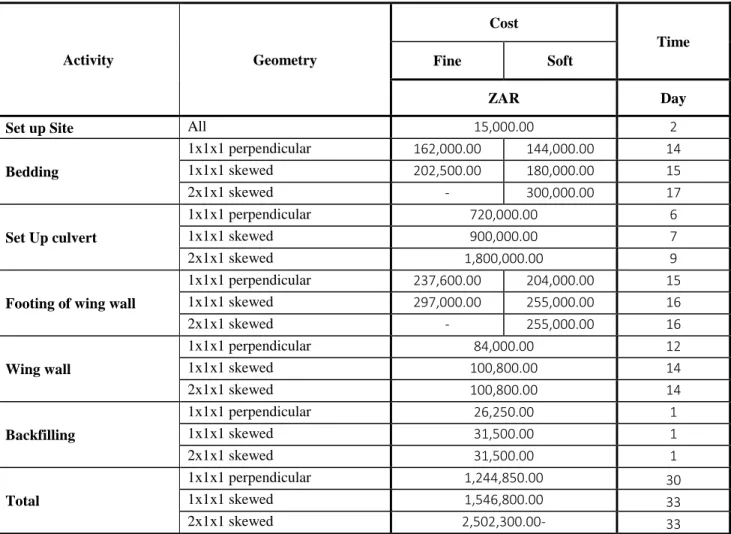
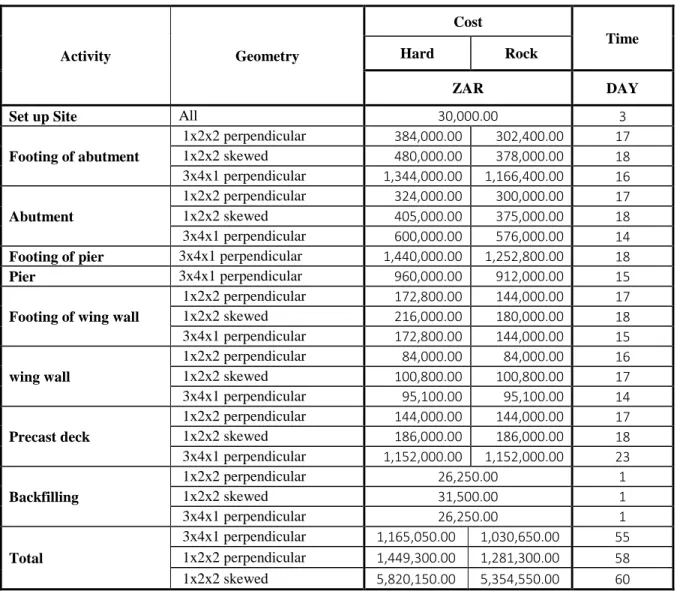
5.3.1.3 Deterministic estimation of bridge structure ... 119
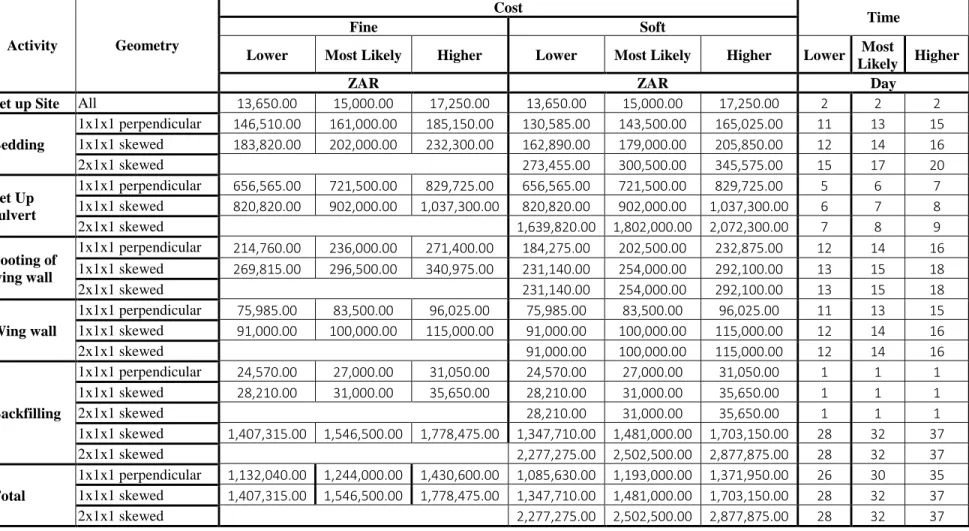
5.3.1.4 Variability estimation of bridge structure ... 121
5.3.1.5 Deterministic estimation of pavement structure ... 124
5.3.1.6 Variability estimation of pavement structure ... 124
5.3.2 Correlation between the activities cost and times of the highway project ... 124
5.3.2.1 Correlation between the costs/times of a repeated activity in a structure ... 125
5.3.2.2 Correlation between the costs/times of the various activities in a structure ... 125
5.3.2.3 Correlation between the costs/times of activities in adjacent structures ... 127
5.3.2.4 Correlation between the costs/times of same activities in the same type of structures ... 127
xiii
5.3.3 Disruptive events ... 128
5.3.3.1 General profile of the project managers surveyed ... 128
5.3.3.2 The probability of occurrence and the effect of the severity of an event ... 129
5.4 SUMMARY OF THE CHAPTER ... 132
CHAPTER SIX : APPLICATION OF THE UNCERTAINTY MODEL TO AN INFRASTRUCTURE PROJECT ... 133
6.1 INTRODUCTION ... 133
6.2 MODELLING VARIABILITY IN THE CONSTRUCTION PROCESS OF HIGHWAY PROJECTS ... 133
6.2.1 Variability related to the earthwork structure ... 133
6.2.1.1 Modelling variability of the cost of the earthwork structure ... 133
6.2.1.2 Modelling variability of time of the earthwork structure... 135
6.2.2 Variability related to the bridge structure ... 136
6.2.2.1 Modelling variability of cost of the bridge structure ... 137
6.2.2.2 Modelling variability of time of the bridge structure... 138
6.2.3 Variability related to the pavement structure ... 139
6.2.3.1 Modelling variability of cost of the pavement structure ... 139
6.2.3.2 Modelling variability of time of the pavement structure ... 140
6.2.4 Assessment of the variability impact on the overall project ... 142
6.2.5 Assessment of the impact of variability of cost and time ... 144
6.3 MODELLING CORRELATION IN CONSTRUCTION OF HIGHWAY PROJECTS 149 6.3.1 Correlations in the earthwork structure ... 149
6.3.1.1 Modelling probabilistic cost and time of the earthwork structure ... 149
6.3.1.2 Modelling the correlation between a repeated activity in the earthwork structure 151 Modelling correlation between a repeated activity in different geologies of cutting construction ... 152
6.3.1.3 Modelling correlation between the different activities in the earthwork structure 159 6.3.1.4 Modelling correlation between the cost and the time of an activity in earthwork structure ... 162
6.3.2 Correlations in the bridge structure ... 164
6.3.2.1 Modelling probabilistic cost and time of the bridge structure ... 164
6.3.2.2 Modelling correlation between a repeated activity in a bridge structure ... 167
6.3.2.3 Modelling correlation between a repeated activity in different geologies of the culvert ... 167
6.3.2.4 Modelling correlation between a repeated activity in the slab bridge construction .... ... 171
6.3.2.5 Overall modelling correlation between a repeated activity in the bridge structure... ... 174
xiv
6.3.2.7 Modelling correlation between the cost and the time of an activity in the bridge
structure ... 179
6.3.3 Correlations in the pavement structure ... 182
6.3.3.1 Modelling probabilistic cost and time of the pavement structure ... 182
6.3.3.2 Modelling correlation between a repeated activity in the pavement structure ... 182
6.3.3.3 Modelling correlation between the different activities in the pavement structure . 185 6.3.3.4 Modelling correlation between the cost and the time of an activity in the pavement structure ... 186
6.3.4 Sensitivity analysis of the different types of correlation ... 188
6.3.4.1 Evaluation of the impact of different types of correlation on the earthwork structure ... 188
6.3.4.2 Evaluation of the impact of different types of correlations in the bridge structure 190 6.3.4.3 Evaluation of the impact of different types of correlations on the pavement structure ... 192
6.3.4.4 Evaluation of the impact of different types of correlations on the overall construction project ... 194
6.4 DISRUPTIVE EVENTS IN THE CONSTRUCTION OF HIGHWAY PROJECTS .... 196
6.4.1 Identification of disruptive events in highway construction projects ... 196
6.4.2 Modelling disruptive events ... 197
6.4.2.1 Prediction of disruptive events’ impact on construction cost and time of highway projects ... 197
6.4.2.2 Evaluation of the performance of predicted impact size ... 202
6.4.2.3 Validation of the ANFIS model ... 205
6.4.2.4 Modelling the occurrence of disruptive events on construction of the highway project ... 211
6.4.2.5 Simulation of the effect of the cost and time of disruptive events on the highway structures ... 211
6.5 CUMULATIVE IMPACTS OF THE UNCERTAINTY MODEL ON CONSTRUCTION COST AND TIME OF PROJECTS ... 214
6.6 TEST OF RESEARCH HYPOTHESES ... 218
6.6.1 The association between the characteristics of infrastructure projects and the cost and time of infrastructure projects ... 218
6.6.1.1 Test of Hypothesis 1.1 ... 219
6.6.1.2 Test of Hypothesis 1.2 ... 220
6.6.2 The association between the impacts of different sources of uncertainty and the cost of infrastructure projects ... 221
6.6.2.2 Test of Hypothesis 2.2 ... 223
6.6.3 The difference between the estimations of cost and time and actual cost and time of the construction of infrastructure projects ... 224
xv
6.6.3.2 Test of hypothesis 3.2 ... 227
6.7 SUMMARY OF THE CHAPTER ... 230
CHAPTER SEVEN : VALIDATION OF THE UNCERTAINTY MODEL AND DISCUSSION OF THE RESULTS AND FINDINGS... 231
7.1 INTRODUCTION ... 231
7.2 VALIDATION OF THE UNCERTAINTY MODEL ... 231
7.2.1 First-order: validation of input data and methods used ... 231
7.2.2 Second-order: expert estimation validation ... 232
7.2.3 Third-order: comparing the model predictions with other observed data... 232
7.2.4 Fourth-order: comparing pre-implementation model predictions with observed post-implementation model predictions ... 233
7.3 DISCUSSION OF FINDINGS ... 234
7.3.1 Construction model of the highway infrastructure projects development ... 234
7.3.2 Key sources of uncertainty in the construction process of infrastructure projects ... 235
7.3.3 Uncertainty model development ... 236
7.3.3.1 Impacts of variability on construction cost and time of infrastructure projects .... 236
7.3.3.2 Impacts of correlation on the construction cost and time of infrastructure projects ... ... 237
7.3.3.3 Impacts of disruptive events on the construction cost and time of infrastructure projects ... 238
7.3.3.4 Cumulative impacts of different sources of uncertainty on construction cost and time of infrastructure projects ... 240
7.3.4 Improving the estimation of construction cost and time of infrastructure projects by incorporating the construction model and uncertainty model ... 241
7.4 SUMMARY OF THE CHAPTER ... 241
CHAPTER EIGHT : SUMMARY, CONCLUSIONS AND RECOMMENDATIONS ... 242
8.1 INTRODUCTION ... 242
8.2 RESTATING THE AIM AND OBJECTIVES OF THE STUDY ... 242
8.3 SUMMARY OF RESEARCH FINDINGS ... 243
8.3.1 Objective 1: ... 243 8.3.2 Objective 2: ... 243 8.3.3 Objective 3: ... 244 8.3.4 Objective 4: ... 244 8.3.5 Objective 5: ... 245 8.3.6 Objective 6: ... 245
8.3.5 Revisiting the hypotheses of the study... 246
8.4 CONCLUSIONS... 248
8.5 CONTRIBUTION TO KNOWLEDGE ... 249
8.6 RECOMMENDATIONS ... 251
xvi
8.8 FUTURE RESEARCH ... 253
8.9 CRITICAL REFLECTION ON THE STUDY ... 253
REFERENCES ... 255
APPENDIX A: QUESTIONNAIRE ... 270
APPENDIX B: ETHICS APPROVAL ... 280
APPENDIX C: PLAN AND PROFILE OF HIGHWAY PROJECT ... 281
xvii
LIST OF TABLES
Table 2.1: Causes and mitigation measures ... 18
Table 2.2: Applicable cost escalation due to optimism bias ... 20
Table 2.3: Applicable capital expenditure increases ... 21
Table 2.4: Risk identification and risk analysis tools ... 25
Table 2.5: Disruptive events most frequently mentioned in the literature review (top 20) ... 33
Table 2.6: Estimation classification ... 36
Table 4.1: Comparison of research paradigms in construction management ... 58
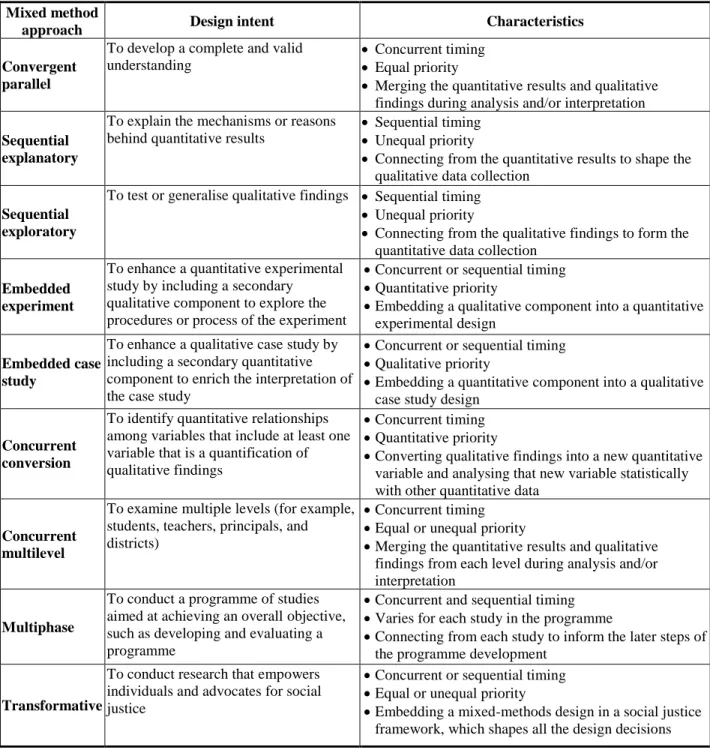
Table 4.2: Overview of the design intent and characteristics of the different mixed method research approaches ... 63
Table 4.3: Linguistic and fuzzy values of the probability, severity, and impact size ... 98
Table 4.4: Conversion value of linguistic to numerical ... 98
Table 4.5: ANFIS membership functions for performance evaluation for cost ... 102
Table 4.6: ANFIS membership functions for performance evaluation for time ... 102
Table 4.7: Spearman correlation between Part 2.1 and 2.2 of cost questionnaire ... 108
Table 4.8: Spearman correlation between Part 2.1 and 2.2 of time questionnaire ... 108
Table 4.9: Cronbach’s alpha coefficient range ... 110
Table 4.10: Reliability value of disruptive events for the cost component ... 110
Table 4.11: Reliability value of disruptive events for the time component ... 112
Table 5.1: Initial estimation and actual construction cost and time of study highway project ... 115
Table 5.2: Deterministic unit costs and production rates of cutting activities in the different types of geological conditions ... 117
Table 5.3: Deterministic unit costs and production rates of filling activities ... 117
Table 5.4: Variability unit cost of cutting activities in the different types of geological conditions ... 118
Table 5.5: Variability unit cost of filling activities ... 119
Table 5.6: Number of bridges with different geometry in four geological conditions ... 119
Table 5.7: Deterministic costs and times of box culvert activities with different geometry in the different types of geological conditions. ... 120
Table 5.8: Deterministic costs and time of slab bridge activities with different geometry in the different types of geological conditions ... 121
Table 5.9: Variability costs of culvert activities with different geometry in different geological conditions ... 122
Table 5.10: Variability costs and times of slab bridge activities with different geometry in different geological conditions ... 123
Table 5.11: Deterministic unit costs and production rate volume of pavement activities ... 124
Table 5.12: Variability unit costs and production rates of pavement activities ... 124
Table 5.13: General profile of surveyed project managers ... 129
Table 5.14: Frequencies of response for input on disruptive events ... 130 Table 6.1: Total variability of cost of cutting and filling construction and earthwork structure 134
xviii
Table 6.2: Total variability of time of cutting and filling construction and the earthwork structure
... 135
Table 6.3: Total variability of cost of culverts, slab bridges and overall bridge structure ... 137
Table 6.4: Total variability of time parameters of the culvert, slab bridge and overall bridge structure ... 138
Table 6.5: Total variability of cost of pavement activities and overall pavement structure ... 139
Table 6.6: Total variability of time of pavement activities and pavement structure ... 141
Table 6.7: Deterministic total cost and time of project ... 142
Table 6.8: Total variability of cost and time of project ... 142
Table 6.9: Deterministic cost and time and variability distributions parameters of the three structures and the project ... 147
Table 6.10: Correlations types and coefficients between the cost and time in the construction of highway projects ... 149
Table 6.11: Probability costs and time parameters of cutting activities in different types of geological conditions ... 150
Table 6.12: Probability costs and time parameters of filling activities ... 150
Table 6.13: Correlation between a repeated activity in different geologies of cutting construction ... 152
Table 6.14: Correlation between a repeated activity in construction filling ... 155
Table 6.15: The overall correlation between a repeated activity in the earthwork structure ... 156
Table 6.16: Correlation between the different activities in construction cutting and filling and overall earthwork structure. ... 159
Table 6.17: Correlation between the cost and time of activity in the construction cut and fill and the overall earthwork structure ... 162
Table 6.18: Probability costs and time parameters of box culvert activities with different geometry and geological conditions ... 165
Table 6.19: Probability costs and time parameters of slab bridge activities with different geometry and geological conditions ... 166
Table 6.20: Correlation between a repeated activity in different geometry and geology of culvert construction ... 168
Table 6.21: Correlation between a repeated activity in different geometries and geologies of slab bridge construction ... 171
Table 6.22: Overall correlation between a repeated activity in the bridge structure. ... 174
Table 6.23: Correlation between the different activities in culvert construction, slab bridges construction and overall bridge structure. ... 177
Table 6.24: Correlation between the cost and time of activity in the construction of a culvert and a slab bridge and the overall bridge structure. ... 179
Table 6.25: Probability costs and time parameters of the pavement structure ... 182
Table 6.26: Correlation between a repeated activity in the pavement structure ... 183
xix
Table 6.28: Correlation between the cost and time of an activity in the pavement structure ... 187
Table 6.29: Impact of different types of correlations on total cost and total time of the earthwork structure ... 188
Table 6.30: Impact of different types of correlations on total cost and total time of the bridge structure ... 190
Table 6.31: Impact of different types of correlations on total cost and total time of the pavement structure ... 192
Table 6.32: Impact of different types of correlations on total cost and total time of the overall construction project ... 194
Table 6.33: ANFIS models predicted impact size of disruptive events on cost and time of a highway project ... 199
Table 6.34: ANFIS prediction cost and time performance evaluation ... 202
Table 6.35: Correlation coefficients among inputs and output variables ... 205
Table 6.36: Regression Test Details ... 205
Table 6.37: Estimated impact size of disruptive events on time of highway projects ... 206
Table 6.38: Evaluation of RSA cost and time of highway project performance models... 208
Table 6.39: Effect values of disruptive events on the cost and time of a construction project... 211
Table 6.40: The distribution parameters of disruptive events... 212
Table 6.41: Impact of uncertainty sources on construction cost and time ... 215
Table 6.42: Chi-square test of hypothesis 1.1 ... 219
Table 6.43: Chi-square test of hypothesis 1.2 ... 220
Table 6.44: Chi-square test of Hypothesis 2.1 ... 222
Table 6.45: Chi-square test of Hypothesis 2.2 ... 223
Table 6.46: Wilcoxon signed rank tests of Hypothesis 3.1.1... 225
Table 6.47: Wilcoxon signed rank tests of Hypothesis 3.1.2... 226
Table 6.48: Wilcoxon signed rank tests of Hypothesis 3.1.3... 226
Table 6.49: Wilcoxon signed rank tests of Hypothesis 3.2.1... 227
Table 6.50: Wilcoxon signed rank tests of Hypothesis 3.2.2... 228
Table 6.51: Summary of the results of the research hypotheses. ... 229
Table 7.1: Comparison of the forecasted results with actual observed data of comparable projects ... 233
xx
LIST OF FIGURES
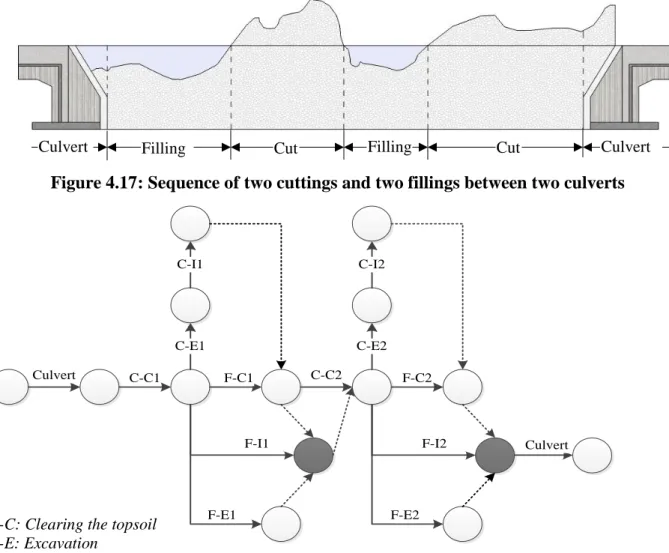
Figure 1.1: Research overview ... 9 Figure 2.1: Cost overruns and time delays in the most disreputable infrastructure projects ... 15 Figure 2.2: Classification of uncertainty in a project ... 22 Figure 2.3: Disruptive events in infrastructure projects ... 32 Figure 2.4: Project estimation maturity and evolution... 37 Figure 3.1: Probabilistic theory concept ... 46 Figure 3.2: Modern portfolio theory concept ... 47 Figure 3.3: Conceptual framework of the study ... 49 Figure 3.4: Assessment of coverage of three estimation approaches ... 50 Figure 4.1: Summary of research methodology of the study ... 55 Figure 4.2: Sequential exploratory mixed method research approach design for the study ... 65 Figure 4.3: Disruptive events in South African highway construction ... 68 Figure 4.4: Structure hierarchy of a highway project ... 72 Figure 4.5: Series activities ... 73 Figure 4.6: Parallel activities ... 73 Figure 4.7: OR node activity ... 73 Figure 4.8: AND node activity... 74 Figure 4.9: Dummy Activity ... 74 Figure 4.10: Cross section of cutting activity ... 74 Figure 4.11: Cross section of the filling activity... 75 Figure 4.12: Sequential and parallel excavation in the construction of a cut ... 75 Figure 4.13: Sequential and parallel embankment in the construction of filling ... 75 Figure 4.14: Lateral sequential and parallel embankment in the construction of filling ... 76 Figure 4.15: Activity network of cutting construction... 76 Figure 4.16: Activity network of filling construction ... 76 Figure 4.17: Sequence of two cuttings and two fillings between two culverts... 78 Figure 4.18: Activity network of two cuttings construction and two fillings construction ... 78 Figure 4.19: Elements of box culvert ... 79 Figure 4.20: Activity network of a box culvert... 79 Figure 4.21: Elements of a single span slab bridge ... 80 Figure 4.22: Activity network of a single span slab bridge ... 81 Figure 4.23: Elements of a multispan slab bridge ... 81 Figure 4.24: Activity network of a multispan slab bridge ... 82 Figure 4.25: Cross section of the pavement structure ... 83 Figure 4.26: Sequential and parallel layers in the pavement structure ... 84 Figure 4.27: Activity network of the pavement structure ... 84 Figure 4.28: Lognormal probability distribution ... 85 Figure 4.29: Triangular probability distribution ... 86
xxi
Figure 4.30: Markov process based on the transitional probability for the probability of
occurrence and non-occurrence of an event... 88 Figure 4.31: Fuzzy system diagram ... 91 Figure 4.32: Variability model flowchart ... 94 Figure 4.33: Correlation model flowchart ... 95 Figure 4.34: Impact size matrix ... 96 Figure 4.35: Fuzzy system for disruptive events assessment ... 97 Figure 4.36: Proposed Takagi and Sugeno ANFIS structure ... 99 Figure 4.37: Proposed ANFIS structure model... 100 Figure 4.38: 3D Surface Diagram of Rules in the FIS. ... 101 Figure 4.39: Disruptive event model flowchart ... 103 Figure 6.1: Cost variability model of the earthwork structure ... 134 Figure 6.2: Cumulative cost distribution of the earthwork structure ... 135 Figure 6.3: Time variability model of the earthwork structure ... 136 Figure 6.4: Cumulative distribution of time in earthwork structure ... 136 Figure 6.5: Cost variability model of the bridge structure ... 137 Figure 6.6: Cumulative cost distribution of the bridge structure ... 138 Figure 6.7: Time variability model of the bridge structure ... 138 Figure 6.8: Cumulative time distribution of the bridge structure ... 139 Figure 6.9: Cost variability model of the pavement structure ... 140 Figure 6.10: Cumulative cost of the pavement structure ... 140 Figure 6.11: Time variability model of the pavement structure ... 141 Figure 6.12: Cumulative time distribution of the pavement structure ... 141 Figure 6.13: Cost variability model of the overall project ... 142 Figure 6.14: Time variability model of the overall project ... 143 Figure 6.15: Cumulative cost distribution of the project ... 143 Figure 6.16: Cumulative time distribution of the project ... 144 Figure 6.17: Deterministic and variation cost and time of the earthwork structure ... 145 Figure 6.18: Deterministic and variation cost and time of the bridge structure ... 145 Figure 6.19: Deterministic and variation cost and time of the pavement structure ... 146 Figure 6.20: Deterministic and variation cost and time of the project... 146 Figure 6.21: Overlay scatterplot of total cost and total time of base case and three correlation
scenarios of cutting construction in overall geologies ... 154 Figure 6.22: Overlay scatterplot of total cost and total time of base case and the three correlation
scenarios of construction filling ... 155 Figure 6.23: Overlay scatterplot of total cost and total time of the base case and the three
correlation scenarios of the earthwork structure ... 157 Figure 6.24: Scatterplot of correlated total cost and total time of construction cutting and the
xxii
Figure 6.25: Scatterplot of correlated total cost and total time of construction filling and the correlation between different activities (Type 2) ... 160 Figure 6.26: Scatterplot of correlated total cost and total time of earthwork construction, the
correlation between different activities (Type 2) ... 161 Figure 6.27: Scatterplot of correlated total cost and total time of the construction cutting, the
correlation between cost and time (Type 3) ... 162 Figure 6.28: Scatterplot of correlated total cost and total time of the construction filling, the
correlation between cost and time (Type 3) ... 163 Figure 6.29: Scatterplot of correlated total cost and total time of the earthwork structure, the
correlation between cost and time (Type 3) ... 163 Figure 6.30: Overlay scatterplot of total cost and total time of the base case and the three
correlation scenarios, for culvert construction ... 170 Figure 6.31: Overlay scatterplot of total cost and total time of the base case and three correlation
scenarios of the slab bridge construction ... 174 Figure 6.32: Overlay scatterplot of total cost and total time of the base case and the three
correlation scenarios of the bridge structure ... 175 Figure 6.33: Scatterplot of correlated total cost and total time of the culvert construction, the
correlation between different activities (Type 2) ... 177 Figure 6.34: Scatterplot of correlated total cost and total time of the slab bridge construction, the
correlation between different activities (Type 2) ... 178 Figure 6.35: Scatterplot of correlated total cost and total time of the bridge structure, the
correlation between different activities (Type 2) ... 178 Figure 6.36: Scatterplot of correlated total cost and total time of culvert construction, the
correlation between cost and time (Type 3) ... 180 Figure 6.37: Scatterplot of correlated total cost and total time of the slab bridge construction, the
correlation between cost and time (Type 3) ... 180 Figure 6.38: Scatterplot of correlated total cost and total time of the bridge structure, the
correlation between cost and time (Type 3) ... 181 Figure 6.39: Overlay scatterplot of total cost and total time of the base case and the three
correlation scenarios of the pavement structure... 184 Figure 6.40: Scatterplot of correlated total cost and total time of the pavement structure, the
correlation between different activities (Type 2) ... 186 Figure 6.41: Scatterplot of correlated total cost and total time of the pavement structure, the
correlation between cost and time (Type 3) ... 187 Figure 6.42: Impact of different types of correlations on the total cost of the earthwork structure
... 189 Figure 6.43: Impact of different types of correlations on the total time of the earthwork structure
... 189 Figure 6.44: Impact of different types of correlations on the total cost of the bridge structure . 191
xxiii
Figure 6.45: Impact of different types of correlations on the total time of the earthwork structure ... 191 Figure 6.46: Impact of different types of correlations on the total cost of the pavement structure
... 193 Figure 6.47: Impact of different types of correlations on the total time of the pavement structure
... 193 Figure 6.48: Impact of different types of correlations on the overall construction project cost . 195 Figure 6.49: Impact of different types of correlations on the overall construction project time 195 Figure 6.50: Disruptive events networks of South African highway construction projects ... 197 Figure 6.51: Rules viewer display for event, price of materials and equipment (EC1) ... 198 Figure 6.52: Impact size of disruptive events on the cost of highway projects ... 201 Figure 6.53: Impact size of disruptive events on the time of highway projects ... 202 Figure 6.54: Performance of FIS in prediction of EC1 event impact size ... 204 Figure 6.55: Scatterplot of total cost and total time of disruptive events on the earthwork
structure ... 212 Figure 6.56: Scatterplot of total cost and total time of disruptive events on the bridge structure
... 213 Figure 6.57: Scatterplot of total cost and total time of disruptive events on the pavement structure ... 213 Figure 6.58: Scatterplot of total cost and total time of disruptive events on the overall
construction project ... 214 Figure 6.59: The impact of sources of uncertainty on total cost of the different structures and the
overall construction project ... 215 Figure 6.60: The impact of sources of uncertainty on the total time of the different structures and the overall construction project ... 216 Figure 6.61: The impact of each source of uncertainty on total cost of the highway structures and the overall project ... 217 Figure 6.62: The impact of each source of uncertainty on the total time of the highway structures and the overall project ... 217
1
CHAPTER ONE
:GENERAL INTRODUCTION
1.1 INTRODUCTION
This research examines the influence of uncertainty in the construction process of infrastructure projects and whether there are key uncertainties that impact on estimated cost and completion time of infrastructure projects. The study further develops appropriate techniques to estimate accurate cost and time of infrastructure projects by modelling the uncertainty of cost and time. This chapter provides an outline of the relevance and rationale of this research study. It also presents an overview of the background of the research study, describes the problem statement, and states the research questions. The chapter further defines the scope and the objectives, gives an overview of the research methodology and outlines the structure of this thesis.
1.2 BACKGROUND TO THE RESEARCH
The construction of infrastructure projects has been characterised by costs exceeding budgetary limits and completion times extending further than what was set out initially (Flyvbjerg, 2014, Flyvbjerg et al., 2003, Adam et al., 2015). Providing accurate estimating cost and duration of infrastructure projects is a difficult task because infrastructure projects are subject to risks and uncertainties, especially in the planning phase of the project, when very limited data and information about the project is available (Ökmen and Öztaş, 2010, Commission, 2013). As an infrastructure project progresses, additional data and information become available to allow costs and times of the project to be predicted with a greater degree of accuracy (Commission, 2013). Cost and time estimation is the procedure of calculating the costs and duration of construction activities required to complete all the construction activities within the scope of the project. Accurate estimation of project cost and time is crucial to ensure the successful completion of a construction project (Kerzner and Kerzner, 2017). Estimating construction costs and times at the early stage of project development represents a prediction provided by the estimator based on available information and data. Cost and time estimating are defined as that area of construction practice where estimators’ experience and judgment are utilised in the application of scientific principles and techniques to the problem of predicting and controlling costs and times of projects (Brook, 2016).
One of the leading pieces of research in the field of cost overruns and time delays in infrastructure projects was done by Flyvbjerg et al. (2002). They conducted a statistical study of the construction costs of 258 infrastructure projects worldwide, and their research found cost underestimation (final construction cost is larger than initially estimated cost) was far more common than cost overestimation. More specifically, on average, a project cost was underestimated by 27.6%. The probability of cost underestimation was 86%, while the probability of overestimation was 14%. The cost underestimation was substantially larger (maximum of +280%) than the cost overestimation (maximum -80%).
2
According to Flyvbjerg et al. (2002), infrastructure construction projects are frequently characterised by cost overruns and time delays. Two examples provided are the Central Artery/Tunnel Project and the transalpine tunnels in Switzerland. The (CA/T) in Boston was estimated to cost six billion US dollars and to be completed in 2001, but on completion, it cost nearly fifteen billion US dollars and was completed in 2007, six years after the initial forecast (Ehrbar, 2013). The transalpine tunnels, namely the Lotschberg and Gotthard base tunnels, connected Italy to central Europe. The Lotschberg base tunnel cost 4,365 million Swiss francs instead of the estimated 3,214 million and was completed according to schedule. The initial estimated cost of the Gotthard base tunnel was 7,716 million Swiss Francs, and the current additional cost amounts to 2,833 million Swiss francs. Initially, the Gotthard base tunnel was planned to be completed by 2012; however, it was completed by 2017 (Ehrbar, 2013, Amberg, 2014, Fabbri, 2017).
Estimating construction costs and times of projects is an example of a knowledge-intensive engineering task (Anderson et al., 2007) that is dependent on the expertise of the human professional. Shane et al. (2015) observed that the main problem is that the estimators’ expertise is often not documented or authenticated. Hence, this expertise is prone to subjectivity. There are different techniques that attempt to predict accurate cost and duration of construction projects. According to Anderson et al. (2007), cost and time estimation processes usually contain the following main steps: determining the basis of the estimate, preparing a base estimate, determining risk and setting contingency, reviewing the entire estimate, and lastly, communicating the estimate. Accuracy and comprehensiveness in estimating cost and time are sensitive issues and can be easily influenced by various parameters; with the aim of retaining a fair degree of accuracy during the estimating process, each parameter must be properly addressed (Shane et al., 2009). Ökmen and Öztaş (2010) emphasised that many parameters that influence project costs are undefined during the early stages of project development. Also, estimating construction cost and time to an acceptable level of accuracy is impossible to achieve manually.
On the other hand, inaccurate cost estimation leads to the incorrect evaluation of projects and misallocation of scarce resources, and the result is cost escalation and delay in total cost and duration of the project (Flyvbjerg, 2007). These two issues, namely, the impossibility of conducting cost and time estimation manually and the uncertainty of cost and time escalation parameters, illustrate the need to establish estimation methods that appropriately capture the uncertainties in the construction process of infrastructure projects, which have an impact on the final cost and duration of the projects.
Uncertainty means an unknown phenomenon. Typically, in the estimation of construction projects, several variables are not known since construction projects are populated by uncertainties. Compared to risk, the concept of uncertainty has a neutral connotation: uncertainty can have a positive or negative impact on the project objectives (Kurowicka and Cooke, 2006). It is an opportunity if it has a positive impact; a threat if it has a negative impact on the project objectives (Hirano and Wright, 2017).
3
The causes of infrastructure projects cost overruns and time delays have been considered by many industry and academic analysts. These causes have been attributed to poor planning and/or implementation of projects, inadequate budget of projects, incompatible organisionation of projects, lack of communication between project enterprises (Ahiaga-Dagbui et al., 2015), politics and inflation (Larsen et al., 2015), material price fluctuation, variation/additional works/reworks, and cost estimation method (Odediran and Windapo, 2016). Furthermore, sources of cost overruns and time delays can be classified into several major categories such as unreasonable estimation and adjustment of project costs and times, delays during construction, changes in scope, and no practical use of the earned value management system (Cantarelli et al., 2013).
The risk and uncertainty factors causing infrastructure projects’ cost and time underestimation have been identified in the literature (Anderson et al., 2007, Flyvbjerg, 2007, Flyvbjerg et al., 2002, Chai et al., 2009, Cantarelli et al., 2013, Memon et al., 2011, Sovacool et al., 2014a, Adam et al., 2017b, Moret and Einstein, 2016). Flyvbjerg (2007) and Cantarelli et al. (2013) identified technical, economic, psychological, and political risk factors as the frequent causes of cost and time underestimation in infrastructure projects. Anderson et al. (2007) identified 18 risk factors that lead to cost and time escalation in infrastructure projects, which were subdivided into factors stemming from internal and external sources.
To address the factors causing cost and time underestimation, Flyvbjerg (2007) suggested that cost underestimation should be limited with a policy change, improved forecasting techniques such as reference class forecasting, and debiasing techniques. In contrast, Cantarelli et al. (2013) proposed the following: delivery and procurement, management, document quality, scope and schedule, integrity, off-prism, and estimate quality strategies. Ahiaga-Dagbui et al. (2015) suggested the use of improved estimation tools, such as debiasing techniques, and a change in policy to counteract the identified causes.
Moret (2011), Brook (2016), Kim et al. (2004) studied most available estimation techniques such as: three-point estimating technique, analogous estimating technique, expert judgment estimating technique, parametric model estimating technique, published data estimating technique, reserve analysis technique, vendor bid analysis technique, and bottom-up analysis technique, and they found that the available estimation techniques do not capture the uncertainty in the construction process of projects. These conventional cost and time estimating techniques provide the finest scenario estimate, which is rarely the case in practice.
The American Association of State Highway and Transportation Officials (AASHTO) pointed out the conventional estimating approaches are preparing times and cost of construction projects with small variability. The cost and time estimate of infrastructure projects are generally prepared quickly with minimum effort because risks and uncertainties involved in the project are not quantified and this makes it extremely difficult to control as projects develop (AASHTO, 2013). In light of this, the construction process of infrastructure projects is often beset by cost and time overruns. The actual cost and duration of an infrastructure project are influenced by many variables and uncertainties, and that can affect the predicted cost and time significantly. However; scholars
4
(Moret, 2011, Mok et al., 2015, Ang and De Leon, 2005, El Khalek et al., 2016, Flyvbjerg, 2014) are of the view that the tools and techniques developed to counteract these variables and uncertainties lack an in-depth understanding of the construction process of infrastructure projects and their uncertainties, and modelling risks only without capturing the cumulative impact of different sources of uncertainty was a limitation. Moreover, Moret and Einstein (2016) identified two limitations on solutions proposed by Flyvbjerg (2007), Cantarelli et al. (2013), Anderson et al. (2007): the lack of an in-depth understanding of the construction process and its uncertainties, and the limitation of modelling risks only without capturing the cumulative impact of different sources of uncertainty. To overcome these limitations, they proposed the use of a construction model and an uncertainty model. In addition, limited research has been done holistically and in South Africa to evaluate the construction process and model the risks and uncertainties within the process, and their impact on estimated infrastructure project cost and time. Therefore, this research seeks to fill this knowledge gap.
1.3 STATEMENT OF THE PROBLEM
The construction process of infrastructure projects is frequently beset by cost overruns and time delays due to the estimation approach and inappropriate tools and techniques used to forecast possible risk and uncertainty in the construction processes (Moret and Einstein, 2016). Also, some of the solutions provided have been found to lack an in-depth understanding of the construction process and its uncertainties. There is also limited research done holistically and in South Africa to evaluate the construction process and model the uncertainties within the process and their impact on the estimated cost and duration of construction of infrastructure projects. Therefore, this research examines risks and uncertainties occurring at the single activities level of the construction processes of building infrastructure projects, and whether there are key uncertainties in the process that impact on the cost and duration of infrastructure projects. The study seeks to propose an estimation method consisting of two components: the construction model and the uncertainty model that captures cost and time uncertainty in infrastructure projects.
1.4 RESEARCH QUESTIONS
The main research question, which has been determined and will be answered through the development of the research is:
What are the key sources of uncertainty in the construction process of infrastructure projects and what are the levels of impact of these uncertainties individually and cumulatively on the cost and duration of infrastructure projects?
To address the main research questions, answers were sought to the following specific sub-questions:
Research question 1: What are the common processes used in the construction of infrastructure projects?
5
Research question 2: What is the association between the characteristics of infrastructure projects and cost and duration of infrastructure projects?
Research question 3: What are the key sources of uncertainty in the construction process of infrastructure projects that impact on cost and duration of infrastructure projects? Research question 4: What is the association between the impacts of different sources of uncertainty and cost and duration of infrastructure projects?
Research question 5: How can an uncertainty model be developed which will improve the accuracy of the estimation of cost and duration of infrastructure projects?
Research question 6: What is the difference in the construction cost and duration of infrastructure projects before and after applying the uncertainty?
1.5 AIM OF THE RESEARCH
This research examines the impacts of various sources of uncertainty in the construction process of infrastructure projects and whether the incorporation of the construction and uncertainty models improve the accuracy of the estimation of cost and duration of the projects.
1.6 OBJECTIVES OF THE RESEARCH
The research objectives are to:
Research objective 1: Investigate the construction process of infrastructure projects and develop a representative construction model.
Research objective 2: Determine the association between the characteristics of infrastructure projects and cost and duration of infrastructure projects.
Research objective 3: Identify the key sources of uncertainty in the construction process of projects that impact on cost and duration of infrastructure projects.
Research objective 4: Determine the association between the impacts of different sources of uncertainty and the cost and duration of infrastructure projects.
Research objective 5: Develop an uncertainty model, which will be used to forecast the impact size of different sources of uncertainty and model their cumulative impacts to improve the accuracy of construction cost and duration of infrastructure projects.
Research Objective 6: Apply the uncertainty model in the construction of infrastructure projects, validate and measure the effect of applying the model on the estimation of cost and duration of highway infrastructure projects.
1.7 SIGNIFICANCE OF THE STUDY
Infrastructure projects fuel economic growth by reducing the cost of production and transport of goods and services, increasing the productivity of input factors, creating indirect positive
6
externalities, and smoothing the business cycle (Ansar et al., 2016). However, nine out of ten infrastructure projects overrun their budgets and duration (Flyvbjerg et al., 2002).
Infrastructure projects are well-known for being poorly managed and unacceptably over budget and duration, rather than for stimulating economic growth and social integration of communication. The most important cause of this global phenomenon in infrastructure projects is that the actual cost and time of an infrastructure project are influenced by many uncertain and unforeseen events.
Therefore, infrastructure planners need a valid tool that provides accurate construction cost and duration of infrastructure projects. Such a predictive tool requires identifying the uncertainties in the construction process and modelling their impacts on construction cost and time of infrastructure projects, which is not currently popular among infrastructure planners, particularly in Africa.
The developed uncertainty model of cost and duration is such an advanced tool that it adds two novel contributions to the existing body of infrastructure management knowledge. First, it deepens the understanding of the construction process of infrastructure projects. The representation of the construction process of an infrastructure project with activity networks, deepens the understanding of the construction process and provides insight when identifying the sources of uncertainty. Second, it contributes to the understanding of the sources of uncertainty by quantitatively modelling and capturing their cumulative impact.
In a novel approach, uncertainty is analysed at the activity level, from the perspective of its sources, and considering both positive and negative outcomes. Three sources of uncertainty have been identified: 1) the variability of the activity cost and time; 2) the correlations between the costs/times of the construction activities, and 3) the uncertainty events. For the first time, all three sources of uncertainty are modelled jointly at the activity level: the cost and the time of activity are variable; the cost/time of the activity is correlated with the costs/times of other activities; and, during the activity, one or more uncertainty event/s can occur. Analysing and modelling the sources of uncertainty shows the impact of a single source of uncertainty and, most importantly, captures the cumulative impact of different sources of uncertainty on project cost and time. The extended form of the tailormade simulation in a MATLAB environment integrates the construction and uncertainty models to simulate the uncertainty in the construction of a highway project. Implemented in the simulation are: 1) the probability distributions, which model the variability of the activity cost and time; 2) the copula, which represents the cost and time correlations; 3) the group of experts brainstorming (rapid idea generation) analysis, which justifies the identified uncertainty events from previous scholars by the technique of bibliometrics; 4) the Markov process, which models the occurrence of uncertainty events; 5) ANFIS, which models the impact size of uncertainty events; and 6) the Monte Carlo method to generate the sets of cost and time based on the specific conditions and assumptions.
7
Finally, the practical application of the construction and uncertainty models to the construction of a highway project shows the feasibility of the models and their effectiveness in capturing the uncertainty in the construction process and provides invaluable insight into the magnitude and the impact of the sources of uncertainty on the construction cost and duration of infrastructure projects.
1.8 OVERVIEW OF THE RESEARCH METHODOLOGY
This study is grounded in the field of construction economics, infrastructure construction cost and time estimation, and infrastructure project management, which fall into the infrastructure management paradigm.
To achieve the research objectives, the study adopted a sequential exploratory mixed method research approach, involving the collection, analysis, and interpretation of both qualitative and quantitative data (Creswell and Creswell, 2017). The data collection process in this study utilised the sequential exploratory method, where the qualitative data is collected first, followed by the collection and analysis of quantitative data. The rationale for the use of this method is to develop an instrument to assist in the identification and classification of variables for further analysis (Creswell and Creswell, 2017).
The research was initiated by an extant review of existing literature relating to the research concepts, particularly quantitative studies of cost overrun and time delay in infrastructure projects, causes of cost and time underestimation and mitigation strategies, the definition of uncertainty, and sources of uncertainties in the construction of infrastructure projects. The in-depth review of the literature revealed the existing limitations in available solutions, which helped to establish a theoretical background of the study and developed the research conceptual framework.
Once the research framework had been developed, a series of estimation sessions and technical interviews were held with five experts with more than 30 years of experience in the construction of linear infrastructure projects. The aim was to determine the unit prices and the amount of uncertainty in production rates in the construction of three structures of highway projects. Other required data, such as probability and severity of disruptive events, were collected from experts through a structured self-administered questionnaire based on their last three projects.
To pursue the research objectives, the collected data were analysed using the following steps:
• The construction process of the main types of structures of linear infrastructure projects is analysed at the level of single activities and represented in networks. The activity networks of the main types of structures are interconnected in a construction network that models the construction of a linear infrastructure project. The construction model of the project contains the activity networks, and their interconnection in the construction network is presented.
• Sources of uncertainty in the construction process of infrastructure projects are identified, and quantitative models of the sources of uncertainty are developed. The correlation is modelled with the copulas. The occurrence of disruptive events is modelled with Markov processes and the cost and time impacts are modelled with an Adaptive Neuro-Fuzzy Inference
8
System (ANFIS). These three sources of uncertainty and their quantitative models form the uncertainty model.
• The construction model and the uncertainty model are integrated into the application to the construction of a section of the highway project in South Africa. The construction of all the structures of three main structures of the highway (earthworks, bridge, and pavement) are modelled with activity networks, and the sources of uncertainty are modelled with probability distributions, Markov processes and ANFIS. The impacts of the different sources of uncertainty are compared, and the cumulative impact of the sources of uncertainty is analysed using sensitivity analysis technique.
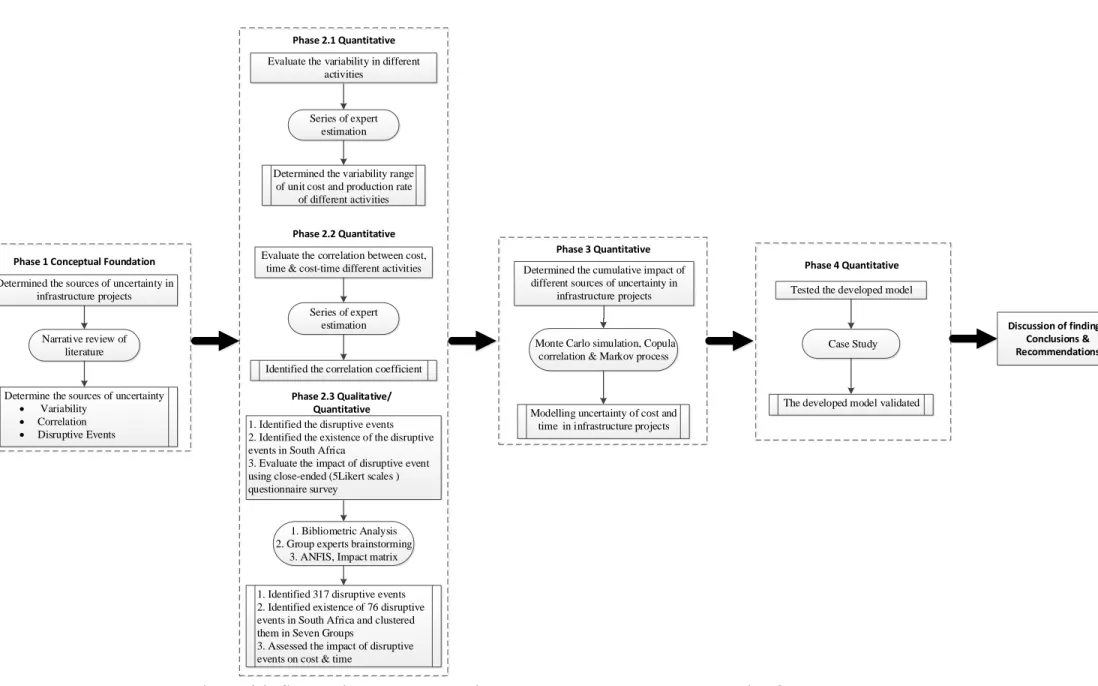
The study research overview is illustrated in Figure 1.1, and further discussion on the research approach and methodology is provided in Chapter Four.
9 Research Aim & Objectives Qualitative Approach Quantitative Approach Discussion of findings Conclusions & Recommendations Output
• Cost & time underestimation
• Underestimation causes & cures
• Sources of uncertainties
Output
• Variability model
• Correlation model
Data Collection ✓ Series of experts estimations
✓ Historical data analysis
Data Collection
✓ Scopus & ScienceDirect database
Data Analysis ➢ Literature review
➢ Bibliometrics (Social network analysis)
Case Study
Data Analysis
➢ Probability distribution (Lognormal & Triangular)
➢ Copula
➢ Monte Carlo simulation Mixed
Approach
Output
• Diruptive events model
Data Collection ✓ Self-administered questionnaire
✓ Group experts brainstorming (Rapid idea generation)
Data Analysis ➢ ANFIS
➢ Markov process
➢ Monte Carlo Simulation
CONSTRUCTION MODEL UNCERTAINTY MODEL
Conceptual Model