Impact of Insulin Resistance on HCV
Treatment Response and Impact of HCV
Treatment on Insulin Sensitivity Using
Direct Measurements of Insulin Action
DANIELLEBRANDMAN,MD, MAS1PETERBACCHETTI,PHD2 CLAUDIAE. AYALA,MS1
JACQUELYNJ. MAHER,MD1,3 MANDANAKHALILI,MD, MAS1,3
OBJECTIVEdInsulin resistance, as measured by surrogate markers, is associated with lower
response to hepatitis C virus (HCV) therapy and may improve with HCV eradication. We pro-spectively evaluated the impact of directly measured insulin resistance and abnormal glucose metabolism on achieving sustained virologic response (SVR) with HCV therapy and assessed whether SVR results in improved insulin sensitivity and fasting glucose.
RESEARCH DESIGN AND METHODSdA total of 50 noncirrhotic, nondiabetic,
HCV-infected patients (27 untreated, 23 treated with pegylated interferon/ribavirin, nonrandomized) underwent clinical and histologic evaluation and 75-g oral glucose tolerance test. Insulin sensi-tivity was assessed directly with insulin suppression test by measuring steady-state plasma glu-cose (SSPG) concentration during a 240-min infusion of octreotide, gluglu-cose, and insulin. Of the subjects, 43 had at least one follow-up evaluation.
RESULTSdPatient characteristics were median age 48, 57% male, and 52% white. SVR was
achieved in 61% (14 of 23) of treated subjects. SVR was independently associated with HCV genotypes 2 and 3 (odds ratio 8.8 [95% CI 1.2–61.7]) but was not strongly associated with insulin sensitivity. When controlling for elapsed time between measurements, being on inter-feron, and BMI, SSPG decreased by 36 mg/dL (288 to 16) in those with SVR and decreased by 28 mg/dL (293 to 38) in those without SVR, compared with the untreated group. BMI (coefficient 9.1 per 5 units; 95% CI 5.3–12.9) and interferon use (coefficient 56; 95% CI 6.8–105) were associated with SSPG.
CONCLUSIONSdInsulin resistance does not appear to be strongly associated with SVR.
HCV therapy may improve insulin resistance regardless of virologic response; however, BMI and interferon use were clearly associated with insulin resistance.
Diabetes Care35:1090–1094, 2012
I
ndividuals infected with chronic hep-atitis C virus (HCV) have two- to threefold greater odds of having dia-betes than the general population (1,2). HCV infection is an independent risk factor for incident diabetes, particularly in individuals who have other risk fac-tors for the development of diabetes (3). It is thought that the mechanism by which HCV is associated with diabetes is through induction or accentuation of insulin resistance (IR) (4).Although a definite cause-and-effect relationship between HCV and diabetes has not been established, the successful eradication of HCV may result in an improvement of IR, particularly in indi-viduals who achieve sustained virologic response (SVR) (5,6). However, the im-pact of viral eradication on downstream consequences of IR, such as impairment of glucose metabolism, has not been clearly established. Although SVR has been associated with reduced rates of
new-onset abnormalities in glucose me-tabolism with short-term follow-up (7), this has not been observed with longer follow-up (8).
IR and diabetes have consequences related to HCV-related liver disease and the response to HCV therapy. Specifically, IR and diabetes are associated with more advanced hepaticfibrosis in HCV-infected patients (9,10), as well as more rapid fibro-sis progression (11). In addition, several studies demonstrate that IR is associated with greater odds of not achieving SVR (12–16). These studies, however, use ho-meostasis model assessment (HOMA)-IR to assess insulin sensitivity, which is a sur-rogate measure of IR. We have recently shown that surrogate measurements of IR are inferior to direct measurements, such as the insulin suppression test (17). In addi-tion, IR may change over time in the setting of HCV infection (18). Therefore, our aims were to use direct measurements of insulin sensitivity to evaluate1) the impact of IR on achieving an SVR to HCV therapy and2) the impact of HCV eradication on IR in comparison with individuals who did not receive HCV therapy.
RESEARCH DESIGN AND METHODSdNondiabetic HCV-infected subjects between age 18 and 60 with de-tectable hepatitis C viral load (HCV RNA) were recruited from San Francisco Gen-eral Hospital (SFGH) at the University of California San Francisco (UCSF) and other UCSF-affiliated clinics. The American Diabetes Association criterion of fasting glucose of$126 mg/dL was used to define diabetes. Subjects coinfected with hepati-tis B virus or HIV, with other causes of liver disease, or with clinical or histologic evidence of cirrhosis or decompensated liver disease were excluded. Also excluded were patients treated previously for HCV, taking steroids or anabolic drugs, with alco-hol use$50 g/day, or with medical condi-tions that impaired their ability to participate in the study. Each subject pro-vided written informed consent prior to en-rollment. The study was approved by the c c c c c c c c c c c c c c c c c c c c c c c c c c c c c c c c c c c c c c c c c c c c c c c c c
From the1Department of Medicine, University of California San Francisco, San Francisco, California; the 2Department of Epidemiology and Biostatistics, University of California San Francisco, San Francisco, California; and the3Liver Center, University of California San Francisco, San Francisco, California. Corresponding author: Mandana Khalili, [email protected].
Received 22 September 2011 and accepted 3 January 2012. DOI: 10.2337/dc11-1837
© 2012 by the American Diabetes Association. Readers may use this article as long as the work is properly cited, the use is educational and not for profit, and the work is not altered. See http://creativecommons.org/ licenses/by-nc-nd/3.0/ for details.
UCSF Committee on Human Research and the SFGH Data Governance Committee.
Subjects underwent a medical interview, physical examination including anthropo-metric measurements, fasting laboratory evaluation, and liver biopsy at the screen-ing visit. Subjects were admitted to the UCSF Clinical and Translational Science Institute–Clinical Research Center at SFGH for metabolic testing. A nonrandom subset of subjects underwent standard anti-HCV therapy with pegylated inter-feron and ribavirin for 6 months (geno-type 2 or 3) or 12 months (geno(geno-type 1). All subjects, irrespective of HCV therapy, had a set of metabolic tests at baseline. Subjects then underwent metabolic test-ing at 6 months after study entry. At the time the study was performed, the standard of care stopping rule for HCV therapy was based on virologic response at 6 months. Therefore, all patients who received therapy were treated for a minimum of 6 months regardless of genotype. Patients infected with HCV genotype 1 who had detectable HCV RNA 6 months after initiation of therapy were considered nonresponders and had antiviral therapy discontinued. SVR was defined as undetectable HCV RNA 6 months after the completion of an-tiviral therapy. Subjects who did not achieve SVR (non-SVR) included nonresponders and relapsers. Subjects who received HCV therapy with or without SVR underwent an-other set of metabolic testing at 6 months after discontinuation of HCV therapy. Metabolic testing
An oral glucose tolerance test (OGTT) was performed after a 12-h fast, which con-sisted of plasma glucose and insulin meas-urements at 0, 30, 60, 120, and 180 min after ingestion of 75-g glucose. After an-other 12-h fast, each subject underwent a modified insulin suppression test. During this study, octreotide was infused at a rate of 0.27mgzm22zmin21to suppress endog-enous insulin secretion. Insulin and glucose were infused at rates of 6 mUzm22zmin21 and 50 mgzm22zmin21, respectively, dur-ing the low-dose period to simulate basal conditions and then at rates of 32 mU z m22zmin21and 267 mgzm22zmin21, respectively, during the high-dose period to achieve physiologic hyperinsulinemia. Blood was drawn for plasma glucose and insulin measurement at 0, 90, 100, 110, 120, 210, 220, 230, and 240 min. The four values obtained from 210 to 240 min were averaged to represent the steady-state plasma glucose (SSPG) and steady-state plasma insulin concentrations. Because
steady-state plasma insulin concentrations are similar in all patients given identical infusion rates of insulin, the SSPG concen-tration is a direct measure of the ability of insulin to mediate the disposal of the infused glucose load. Higher SSPG concentrations, reported in milligrams per deciliter, repre-sent higher degrees of peripheral IR. Laboratory evaluation
Plasma glucose concentrations were mea-sured by the glucose oxidase method (YSI 2300 STAT-Plus Analyzer, Yellow Springs Instruments, Yellow Springs, OH). Plasma insulin was measured by using a single-antibody radioimmunoassay without cross-reactivity with human proinsulin (Millipore, Billerica, MA). The intra- and interassay coefficients of variation for plasma insulin measurements were averaged at 3.2 and 3.9%, respectively. HCV RNA was mea-sured using a branched-DNA signal am-plification nucleic-acid probe assay (Versant HCV RNA Assay, version 3.0; Siemens). The lower limit of detection of this assay is 615 IU/mL.
Statistical analysis
Baseline characteristics of subjects were summarized using mean 6 SD, median (range), and frequencies. Univariable analysis was performed using Mann-WhitneyUtest for continuous variables andx2tests (or Fisher exact test when ap-propriate) for dichotomous and categorical variables. Multiple logistic regression was used to evaluate variables associated with achievement of SVR. Mixed effects multiple linear regression, with a random intercept term to account for within-patient correla-tion, was used to evaluate variables that may influence SSPG and its changes over time, including achievement of SVR. Simi-lar models were also used to evaluate vari-ables that may influence fasting glucose. Variables that were deemed clinically rel-evant, as well as others with univariate Pvalues,0.1, were considered for inclu-sion in multivariable models.P , 0.05 was considered statistically significant. All analyses were performed using SAS version 9.2 (SAS Institute, Cary, NC). RESULTS
Cohort characteristics
A total of 50 subjects were enrolled and underwent baseline insulin suppression tests and OGTT. In all subjects, the 2-h postglucose load was,200 mg/dL during OGTT, confirming their nondiabetic sta-tus by OGTT. Next, 23 subjects received
anti-HCV therapy, and 22 of these pa-tients and 24 of the untreated papa-tients un-derwent liver biopsies at baseline. Of the patients who underwent HCV therapy, 14 achieved SVR. The overall cohort had a median age of 48 (interquartile range 34–57), 13 (57%) were male, and 12 (52%) were white. The host and viral character-istics of the cohort were mostly similar be-tween those who underwent treatment and those who did not (Table 1). The SSPG levels were 149680 and 122672 mg/dL in the treated and untreated groups, re-spectively (P= 0.17). In addition, the pro-portion of subjects with IR (SSPG.180 mg/dL) was 32 and 22%, respectively, in those who did and did not receive anti-HCV therapy (P = 0.53). Although the proportion of white subjects was similar in the treated and untreated groups, the proportion of black subjects was higher (33 vs. 0%) in the untreated group, and the proportion of Latinos was higher (43 vs. 11%) in the treated group. In addition, a higher proportion of untreated subjects had mild degrees of liver inflammation (P= 0.02), but the degrees offibrosis and proportion with steatosis were similar among the treated and untreated groups. Host, metabolic, and viral factors associated with SVR
SVR was achieved in 36% of individuals infected with genotype 1 and in 83% of those infected with genotypes 2 and 3 (P= 0.03). The odds of achieving SVR were 8.8 times higher (95% CI 1.2–61.7; P= 0.03) in subjects infected with HCV genotypes other than 1. Other host and vi-ral factors, including age, sex, race, BMI, alanine aminotransferase (ALT), HCV RNA, lipid profile, severity of liver disease, and presence of impaired fasting glucose ($100 mg/dL) or glucose intolerance ($140 and,200 mg/dL at 120 min after OGTT), were similar between subjects who did or did not achieve SVR (Table 2). When pretreatment IR (SSPG) was evaluated as a predictor of SVR, the odds of achieving SVR were only 1.02 times higher for each 10 mg/dL decrease in SSPG, and this was not statistically significant (0.91–1.15;P= 0.68). Controlling for genotype did not alter the odds ratio for the association between IR and SVR (1.02 [0.89–1.16];P= 0.81). Impact of HCV therapy on glucose metabolism
Of the patients, 43 (27 untreated, 11 SVR, and 5 non-SVR) underwent at least one follow-up evaluation with repeat metabolic testing. Average SSPG did not change
substantially at the 6-month follow-up visit (21.3 mg/dL [95% CI222 to 19]) in those who did not receive antiviral therapy (Fig. 1). SSPG decreased from baseline by 33 mg/dL (95% CI2102 to 36) at 6 months and 44 mg/dL (95% CI2104 to 16) at the time of SVR (6 months after discontinuation of therapy) in those treated individuals who achieved an SVR. Subjects who
underwent antiviral treatment but did not achieve SVR initially had increases in mean SSPG (35 mg/dL [95% CI255 to 125]) at 6-month follow-up but subse-quently decreased at 6 months after dis-continuation of therapy, as compared with baseline values (222 mg/dL [95% CI
2109 to 66]). When controlling for elapsed time between SSPG measurements,
SSPG decreased by 17.2 mg/dL at 6 months after discontinuation of therapy (95% CI264 to 30; P= 0.46) in those with SVR and increased by 14.7 mg/dL (95% CI236.3 to 66;P= 0.56) in those without SVR compared with those who did not receive therapy. When addition-ally controlling for receiving interferon and for BMI at the time of the SSPG mea-surement, SSPG decreased by 36 mg/dL (95% CI287.6 to 15.5;P= 0.17) in those with SVR and decreased by 27.6 mg/dL (95% CI292.9 to 38;P= 0.40) in those without SVR compared with the untreated group, but these changes did not reach statistical significance. There was little differ-ence in SSPG between treated patients with or without SVR (coefficient 8.5 mg/dL [95% CI245.9 to 63.0];P= 0.75). BMI (coeffi-cient 9.1 mg/dL per 5 units [95% CI 5.3– 12.9];P,0.0001) and taking interferon at the time of SSPG measurement (coeffi-cient 56 [95% CI 6.8–105];P= 0.03) were positively associated with SSPG.
When controlling for the elapsed time between measurements, the fasting glucose decreased slightly by 1.5 mg/dL (95% CI
28.6 to 5.6;P= 0.68) in those with SVR and increased by 3.2 mg/dL (95% CI24.6 to 10.9; P= 0.42) in those without SVR compared with the untreated group. When also controlling for the presence of interferon use and BMI at the time of SSPG measurement, fasting glucose decreased by 5.2 mg/dL (95% CI213.5 to 3.1;P= 0.22) in those with SVR compared with un-treated patients, but those without SVR also had a decrease in fasting glucose (23.0 mg/dL [95% CI213.5 to 7.6];P= 0.57), and neither of these reached statisti-cal significance versus untreated patients. The fasting glucose was also not substan-tially different between those with SVR compared with those without SVR (2.2 mg/dL [95% CI 26.6 to 11]; P= 0.62). Only BMI at the time of glucose measure-ment (3.6 mg/dL per 5 units [95% CI 0.34– 6.8];P= 0.03) was statistically significantly associated with fasting glucose levels. CONCLUSIONSdThis is the largest study to date that has used direct measure-ments to evaluate IR in an ethnically diverse cohort of HCV patients and moni-tored the relationship between IR and HCV treatment response. We found that infection with HCV genotypes 2 and 3 predicted SVR, but baseline IR was not substantially associated with the achieve-ment of SVR. As expected in this study, higher BMI was positively associated with IR. Active interferon use was also associated
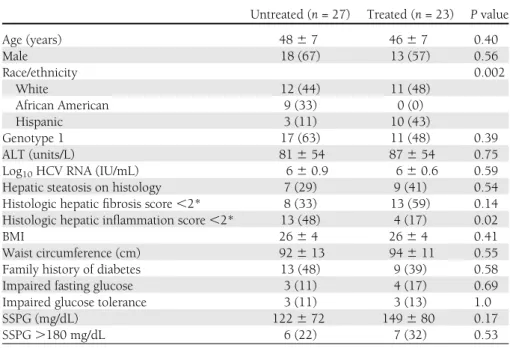
Table 1dPatient characteristics at study entry (n= 50)
Untreated (n= 27) Treated (n= 23) Pvalue
Age (years) 4867 4667 0.40 Male 18 (67) 13 (57) 0.56 Race/ethnicity 0.002 White 12 (44) 11 (48) African American 9 (33) 0 (0) Hispanic 3 (11) 10 (43) Genotype 1 17 (63) 11 (48) 0.39 ALT (units/L) 81654 87654 0.75
Log10HCV RNA (IU/mL) 660.9 660.6 0.59
Hepatic steatosis on histology 7 (29) 9 (41) 0.54
Histologic hepaticfibrosis score,2* 8 (33) 13 (59) 0.14 Histologic hepatic inflammation score,2* 13 (48) 4 (17) 0.02
BMI 2664 2664 0.41
Waist circumference (cm) 92613 94611 0.55
Family history of diabetes 13 (48) 9 (39) 0.58
Impaired fasting glucose 3 (11) 4 (17) 0.69
Impaired glucose tolerance 3 (11) 3 (13) 1.0
SSPG (mg/dL) 122672 149680 0.17
SSPG.180 mg/dL 6 (22) 7 (32) 0.53
Data are mean6SD orn(%) unless otherwise indicated. *By Metavir scoring system.
Table 2dComparison of individuals who received anti-HCV therapy by response type
SVR (n= 14) Non-SVR (n= 9) Pvalue Age (years) 46.5 (34–57) 50 (35–54) 0.23 Male 8 (57) 5 (56) 1.0 White race 7 (50) 5 (55.6) 1.0 Genotype 1 4 (28.6) 7 (77.8) 0.03 ALT (units/L) 76 (22–208) 91 (32–161) 0.80
Log10HCV RNA (IU/mL) 5.9 (4.4–6.8) 6.1 (5.3–6.3) 0.97
Hepatic steatosis 5 (38) 4 (44) 0.68
Histologic hepaticfibrosis score.2* 6 (46) 3 (33) 0.65
Histologic hepatic inflammation score.2* 3 (23) 1 (11) 0.50
BMI, mean (SD) 26 (3) 26 (4) 0.78
Waist circumference (cm), median (SD) 94 (3) 93 (4) 0.85
Total cholesterol (mg/dL) 164 (106–197) 164 (99–205) 1.0
LDL cholesterol (mg/dL) 99 (65–129) 88 (44–131) 1.0
HDL cholesterol (mg/dL) 50 (32–68) 41 (33–64) 0.57
Triglycerides (mg/dL) 106 (55–183) 95 (67–133) 0.44
Alcohol use at study entry 2 (14) 2 (22) 1.0
Family history of diabetes 7 (50) 2 (22) 0.23
Fasting glucose (mmol/L) 94.2 (81.8–104.5) 90.8 (76.5–107) 0.16
Impaired fasting glucose 1 (7) 2 (22) 1.0
Impaired glucose tolerance 3 (21) 0 (0) 0.25
SSPG (mmol/L) 127.1 (65.4–275) 101.3 (69.3–306.5) 0.81
SSPG.180 (mg/dL) 5 (36) 2 (25) 0.50
with higher degrees of IR. IR appeared to improve with HCV therapy, irrespective of viral eradication.
Several prior studies using surrogate measures of IR (mainly HOMA-IR) report IR as a predictor of nonresponse to anti-HCV therapy (9,12–16). In a study of 159 Spanish patients, individuals with SVR had lower baseline HOMA-IR scores com-pared with those with non-SVR (2.4 vs. 3.8) (16). In addition, after adjusting for genotype and liverfibrosis scores, the odds of nonsustained response to anti-HCV therapy were ;1.8 times higher with increasing HOMA-IR scores (16). In the Virahep-C Study, which compared African Americans and Caucasian Americans infected with HCV genotype 1, race, viral load, liverfibrosis score, and, once again, presence of IR and interferon dosage were negatively associated with SVR (19).
The reported association between SVR and IR, however, has not been con-sistently demonstrated (13,20). In a re-cent study of 412 Italian patients, SVR was associated with genotypes 2 and 3 and younger age, but baseline HOMA-IR scores between individuals who did and did not achieve SVR did not reach statis-tical significance (20). In another study, there were no improvements in SVR de-spite pharmacologically induced improve-ment of IR with metformin (21). In a similar manner, in our study, genotypes 2 and 3 were associated with SVR, but SSPG appeared to have little association. The discrepancies observed in reported associ-ations between IR and SVR may reflect ho-mogeneous patient populations with
limited ethnic diversity; variation in host factors that are well known to affect IR, such as BMI; and limitations in the surro-gate measurements of IR compared with direct measurements. For example, the patients in the Virahep-C Study had an especially high prevalence of obesity and high degrees of IR compared with other reports; the mean HOMA-IR in that study was 3.5 in individuals without hepatic steatosis and 6.1 in those with moderate degrees of steatosis (19). Other U.S. HCV cohorts with more ethnically diverse pop-ulations have reported lower mean HOMA-IR scores of 3.7 among the over-weight and 4.9 among the obese patients. In addition, it has been shown that the correlation between surrogate estimates and direct measurement of IR is affected by degrees of obesity and ethnicity (17). In addition, commonly used HOMA-IR cut-offs of.2 or.3 to define IR have high misclassification rates (17). Moreover, there is a significant within-person varia-tion in repeated HOMA-IR measurements in the obese individuals compared with normal weight patients.
Although studies report an associa-tion between HCV infecassocia-tion and diabetes, as well as IR, a cause-and-effect relation-ship has not been established. The proposed relationship between HCV infection and IR is complex. HCV appears to affect both IR and interferon signaling in the liver (22). The HCV core protein activates sup-pressor of cytokine signaling 3, which in turn inhibits the insulin receptor sub-strates (22). However, while some have shown a statistically significant decrease
in HOMA-IR scores with viral eradication and achievement of SVR (6,16), others have not shown a significant impact of vi-ral clearance on HOMA-IR (23). In our study, SSPG levels decreased during anti-viral therapy in all treatment anti-viral response categories compared with untreated pa-tients, but the difference in mean change in SSPG was not statistically significant be-tween SVR and non-SVR during and after treatment. SSPG.180 mg/dL has been associated with an increased risk of devel-opment of clinical syndromes associated with IR (24,25). The changes in SSPG re-sulting from HCV therapy may be suffi-cient to reduce SSPG to ,180 mg/L, thereby reducing the risk of these clinical sequelae. It has been shown that interferon use can directly increase IR (26,27). On the other hand, a potential adverse effect of interferon therapy may be weight loss, which can also influence metabolic pa-rameters (28). When considering the independent effect of both BMI and in-terferon at the time of metabolic testing, similar to other studies, higher BMI and taking interferon at the time of metabolic testing were associated with higher de-grees of IR. The inclusion of the control group of untreated patients in this study was important considering that it allowed for assessment of the influence of inter-feron use itself on IR. In addition, because IR is a known precursor to diabetes, prior studies have evaluated the impact of suc-cessful HCV therapy on incident diabetes but have failed to prove that there is an independent association between achieve-ment of SVR and risk of incident diabetes or impaired glucose tolerance with long-term follow-up of 8 years (8). In our study, while not reaching statistical significance, we did observe decreases in SSPG and fast-ing glucose levels with therapy regardless of SVR status. As observed with IR, higher BMI was associated with increases in fast-ing glucose levels on follow-up.
Similar to other studies using the direct measurements of IR, our study is limited by small sample size (29), which may not have allowed for detection of other known host and viral factors that influence SVR. However, accurate assess-ment of peripheral IR by direct measure-ment allows for meaningful comparisons, and performing this test would be logisti-cally challenging and impractical in a larger patient population. In addition, the main purpose of this study was to evaluate the influence of IR on SVR as well as SVR on improvement of IR, so use of direct measurement was important. Figure 1dMean (95% CI) change in SSPG measurements from baseline by treatment category
In conclusion, when using precise measurements of IR, IR did not appear to be substantially associated with achievement of SVR. Successful viral eradication did not appear to substantially influence IR when compared with HCV therapy that does not result in SVR. However, HCV therapy, re-gardless of achievement of SVR, appeared to improve IR. This suggests that individuals with higher degrees of IR may benefit from receipt of HCV therapy in an attempt to decrease their risk of clinical sequelae of IR. This study highlights the potential limita-tions of use of surrogate measures of IR within the context of HCV therapy and also the importance of controlling for change in BMI with antiviral therapy, which signifi-cantly influences insulin action. Further studies are necessary to determine if addi-tional changes in IR occur after successful viral eradication beyond 6 months after discontinuation of HCV therapy.
AcknowledgmentsdThis work was
sup-ported by National Institutes of Health (NIH) grants R01-DK-074673 (to M.K.), UL1-RR-024131 (NIH/National Center for Research Resources UCSF–Clinical and Translational Science Institute), Hepatology Training Grant DK-060414 (to D.B.), and P30-DK-026743 (UCSF Liver Center) and American Diabetes Association Grant 1-08-CR-30 (to M.K.).
No conflicts of interest relevant to this article were reported.
D.B. analyzed and interpreted data and wrote and revised the manuscript. P.B. performed sta-tistical analysis and critically reviewed and re-vised the manuscript. C.E.A. acquired data, performed study experiments, provided tech-nical support, and critically revised the manu-script. J.J.M. interpreted data and critically revised the manuscript. M.K. designed the study concept, acquired data, interpreted results, provided material support, supervised the study, and revised the manuscript. M.K. is the guarantor of this work and, as such, had full access to all the data in the study and takes responsibility for the integrity of the data and the accuracy of the data analysis.
References
1. Mason AL, Lau JY, Hoang N, et al. Asso-ciation of diabetes mellitus and chronic hepatitis C virus infection. Hepatology 1999;29:328–333
2. Mehta SH, Brancati FL, Sulkowski MS, Strathdee SA, Szklo M, Thomas DL. Prev-alence of type 2 diabetes mellitus among persons with hepatitis C virus infection in the United States. Ann Intern Med 2000; 133:592–599
3. Mehta SH, Brancati FL, Strathdee SA, et al. Hepatitis C virus infection and incident type 2 diabetes. Hepatology 2003;38:50–56
4. Sheikh MY, Choi J, Qadri I, Friedman JE, Sanyal AJ. Hepatitis C virus infection: mo-lecular pathways to metabolic syndrome. Hepatology 2008;47:2127–2133 5. Delgado-Borrego A, Kamegaya Y, Jordan
SH, Agrawal S, Valim C, Chung RT. HCV synergizes with body weight in the pro-motion of insulin resistance. J Viral Hepat 2011;18:135–141
6. Kawaguchi T, Ide T, Taniguchi E, et al. Clearance of HCV improves insulin re-sistance, beta-cell function, and hepatic ex-pression of insulin receptor substrate 1 and 2. Am J Gastroenterol 2007;102:570–576 7. Romero-Gómez M, Fernández-Rodríguez
CM, Andrade RJ, et al. Effect of sustained virological response to treatment on the incidence of abnormal glucose values in chronic hepatitis C. J Hepatol 2008;48: 721–727
8. Giordanino C, Bugianesi E, Smedile A, et al. Incidence of type 2 diabetes mellitus and glucose abnormalities in patients with chronic hepatitis C infection by response to treatment: results of a cohort study. Am J Gastroenterol 2008;103:2481–2487 9. D’Souza R, Sabin CA, Foster GR. Insulin
resistance plays a significant role in liver
fibrosis in chronic hepatitis C and in the response to antiviral therapy. Am J Gastroenterol 2005;100:1509–1515 10. Petta S, Cammà C, Di Marco V, et al.
In-sulin resistance and diabetes increase fi -brosis in the liver of patients with genotype 1 HCV infection. Am J Gastroenterol 2008; 103:1136–1144
11. Hui JM, Sud A, Farrell GC, et al. Insulin resistance is associated with chronic hep-atitis C virus infection and fibrosis pro-gression [corrected in: Gastroenterology 2004;126:634]. Gastroenterology 2003; 125:1695–1704
12. Khattab M, Eslam M, Sharwae MA, Shatat M, Ali A, Hamdy L. Insulin resistance predicts rapid virologic response to peginterferon/ ribavirin combination therapy in hepatitis C genotype 4 patients. Am J Gastroenterol 2010;105:1970–1977
13. Grasso A, Malfatti F, De Leo P, et al. In-sulin resistance predicts rapid virological response in non-diabetic, non-cirrhotic genotype 1 HCV patients treated with peginterferon alpha-2b plus ribavirin. J Hepatol 2009;51:984–990
14. Moucari R, Ripault MP, Martinot-Peignoux M, et al. Insulin resistance and geographical origin: major predictors of liverfibrosis and response to peginterferon and ribavirin in HCV-4. Gut 2009;58: 1662–1669
15. Poustchi H, Negro F, Hui J, et al. Insulin resistance and response to therapy in pa-tients infected with chronic hepatitis C virus genotypes 2 and 3. J Hepatol 2008; 48:28–34
16. Romero-Gómez M, Del Mar Viloria M, Andrade RJ, et al. Insulin resistance impairs sustained response rate to peginterferon plus
ribavirin in chronic hepatitis C patients. Gastroenterology 2005;128:636–641 17. Lam KD, Bacchetti P, Abbasi F, et al.
Com-parison of surrogate and direct measurement of insulin resistance in chronic hepatitis C virus infection: impact of obesity and eth-nicity. Hepatology 2010;52:38–46 18. Park SK, Cho YK, Park JH, et al. Change of
insulin sensitivity in hepatitis C patients with normal insulin sensitivity: a 5-year prospective follow-up study variation of insulin sensitivity in HCV patients. Intern Med J 2010;40:503–511
19. Conjeevaram HS, Kleiner DE, Everhart JE, et al.; Virahep-C Study Group. Race, insulin resistance and hepatic steatosis in chronic hepatitis C. Hepatology 2007;45:80–87 20. Fattovich G, Covolo L, Pasino M, et al.;
Italian Hepatitis C Cohort Study Collab-orative Group. The homeostasis model assessment of the insulin resistance score is not predictive of a sustained virological response in chronic hepatitis C patients. Liver Int 2011;31:66–74
21. Romero-Gómez M, Diago M, Andrade RJ, et al.; Spanish Treatment of Resistance to Insulin in Hepatitis C Genotype 1 Group. Treatment of insulin resistance with met-formin in naïve genotype 1 chronic hep-atitis C patients receiving peginterferon alfa-2a plus ribavirin. Hepatology 2009; 50:1702–1708
22. Douglas MW, George J. Molecular mech-anisms of insulin resistance in chronic hepatitis C. World J Gastroenterol 2009; 15:4356–4364
23. Kawaguchi Y, Mizuta T, Oza N, et al. Eradication of hepatitis C virus by in-terferon improves whole-body insulin resistance and hyperinsulinaemia in pa-tients with chronic hepatitis C. Liver Int 2009;29:871–877
24. Facchini FS, Hua N, Abbasi F, Reaven GM. Insulin resistance as a predictor of age-related diseases. J Clin Endocrinol Metab 2001;86:3574–3578
25. Yip J, Facchini FS, Reaven GM. Resistance to insulin-mediated glucose disposal as a predictor of cardiovascular disease. J Clin Endocrinol Metab 1998;83:2773–2776 26. Imano E, Kanda T, Ishigami Y, et al.
In-terferon induces insulin resistance in pa-tients with chronic active hepatitis C. J Hepatol 1998;28:189–193
27. Koivisto VA, Pelkonen R, Cantell K. Effect of interferon on glucose tolerance and in-sulin sensitivity. Diabetes 1989;38:641–647 28. Conjeevaram HS, Wahed AS, Afdhal N, Howell CD, Everhart JE, Hoofnagle JH; Virahep-C Study Group. Changes in in-sulin sensitivity and body weight during and after peginterferon and ribavirin therapy for hepatitis C. Gastroenterology 2011;140:469–477
29. Milner K, van der Poorten D, Trenell M, et al. Chronic hepatitis C is associated with pe-ripheral rather than hepatic insulin resistance. Gastroenterology 2010;138:932–941