First CMS results at 13 TeV
P. Ronchese1,
on behalf of the CMS Collaboration 1INFN and University of Padova, Italy
Abstract. Measurements of b-hadron and quarkonium production cross sections
pro-vide essential information to understand QCD. This talk will show new measurements of double-differential production cross sections vs. transverse momentumpTand rapid-ityy, at center-of-mass energy √s=13 TeV, performed by CMS experiment with data collected in 2015. Comparisons with results obtained at √s=7 TeV will be shown.
1 Introduction
The motivations to study heavy flavour physics at CMS [1] include the probe of the underlying QCD processes, obtained by measuring b-hadron production cross-section and quarkonium polarization and by looking for new and exotic states. The measurements of the production cross-section forB+
mesons andψ,Υquarkonia from CMS at a center of mass energy √s=13 TeV will be shown.
2 The CMS experiment
The main components of the CMS experiment [1] are the tracker with pixels and microstrips, the elec-tromagnetic and hadron calorimeters, and the muon detectors. Three different detectors are dedicated to muon trigger and detection, having the capability to perform a standalone reconstruction of muons. The match between the reconstruction from the tracker and the muon detectors can be conducted inside-out, that is more efficient at low tranverse momentum, or outside-in, that is more efficient at highpT. The misidentification probability is less than 1% and the momentum resolution ranges from
1% to 6% for muons up to 100 GeV.
Muons play an essential role in triggering events in the harsh LHC environment, characterized by a very high luminosity, while keeping the frequency inside a limited bandwidth. Triggers forB
physics require the presence of two muons at least, possibly together with an additional track. The trigger system consists of a first level, based on a dedicated hardware taking fast decision and giving a trigger rate of the order of∼100 kHz, followed by an higher level based on software performing full track reconstruction and giving a rate of∼1 kHz. Specific triggers have been developed for different analyses, applying cuts on muon and dimuon transverse momentum and rapidity, the presence of secondary vertices and their displacement from the interaction point, the dimuon mass and the angle formed by the dimuon momentum and the flight direction, given by the position of the secondary
vertex relative to the collision point. In the first year of run at √s = 13 TeV LHC delivered an integrated luminosityL ∼4 fb−1, and CMS recorded data corresponding toL 3.6 fb−1. For muon-based analyses an integrated luminosityL 2.7 fb−1was collected.
3 Double
Υ
production
In the high parton densities in the proton-proton collisions produced by LHC, quarkonium pairs can be produced in single parton scattering (SPS) or double parton scattering (DPS) processes. SPS is assumed to dominate and produces pairs of strongly correlated mesons with small rapidity difference, SPS leads to the production of multiple heavy flavour quarks and meson pairs with large rapidity dif-ference [2,3]. The quarkonium production mechanism involves the production of color-singlet states, that is dominant at low transverse momentum, and color-octet states that become more important at higherpT [4,5]. Another source of quarkonium pairs is the decay of tetra-quarks [6].
The selection of double-Υevents at CMS [7] required the reconstruction of muons with hits in the strip tracker and pixel detector and the match of the extrapolated track with at least one segment reconstructed in the muon chambers. Cuts on muon (dimuon)pTandη(y) were then applied to select
a region with an uniform acceptance: pT,μ >3.5 GeV,ημ<2.4, pT,Υ <50 GeV,|yΥ|<2.0. Events
with multipleΥwere discarded and the production of non prompt pairs was neglected.
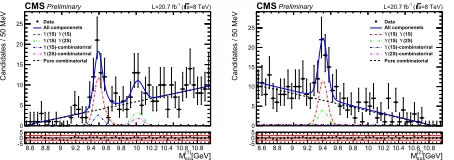
In the invariant mass distribution the yield of twoΥ(1S) or aΥ(1S) and aΥ(2S) were estimated, while no visible signal appeared forΥ(3S). A two-dimensional fit was performed over the mass distribution, with five components corresponding toΥ(1S)Υ(1S), Υ(1S)Υ(2S) pairs, oneΥ(1S) or Υ(2S) and one dimuon from combinatorial background and two combinatorial dimuons. The signal was described with a Crystal-Ball function and background with a Chebyshev polynomial; the fit result is shown in Fig.1.
Candidates / 50 MeV
0 5 10 15 20 25 Data
All componenets (1S) Υ (1S) Υ
(2S) Υ (1S) Υ
(1S)-combinatoriral Υ
(2S)-combinatoriral Υ Pure combinatorial
=8 TeV) s (
-1
L=20.7 fb
CMSPreliminary
[GeV]
(1)
μ μ M
8.68.8 9 9.29.49.69.810 10.2 10.4 10.6 10.8 -50
5
Candidates / 50 MeV
0 5 10 15 20
25 DataAll componenets (1S) Υ (1S) Υ
(2S) Υ (1S) Υ
(1S)-combinatoriral Υ
(2S)-combinatoriral Υ Pure combinatorial
=8 TeV) s (
-1
L=20.7 fb
CMSPreliminary
[GeV]
(2)
μ μ M
8.68.8 9 9.29.49.69.810 10.2 10.4 10.6 10.8 -50
5
Figure 1.Projections of the 2D fit: invariant
mass of higher mass muon pairs,M(1)μμ(left)
and lower mass muon pairs,M(2)μμ(right). The
lower pads show the difference between the total fit curve and data, with red lines corresponding to a difference of±2 standard deviations.
The cross section was extracted from the signal yield multiplying the number of fitted signal eventsnsig for a correction factor ¯ω, accounting for acceptance and efficiency, and dividing by the squared branching ratio of theΥand the integrated luminosity:
σT =
nsig·ω¯
B(Υ(1S)→μ+μ−)2· L.
Acceptance and efficiency were computed event-by-event on a simulated sample assuming isotropic decays.
The total measured cross-section was [7]
σT=(68.8±12.7(stat)±7.4(syst)±2.8(BR)) pb,
4
B
+production
The measurement and study of beauty hadron production cross-section at high energies provide new important tests of theoretical calculations [8,9]. TheB+production cross-section was measured at the CMS experiment looking at the decayB+ → J/ψK+, followed by the decay J/ψ → μ+μ−[10]; charge conjugation states are implied here and in the following. The differential cross-section versus transverse momentum or rapidity was measured in a rapidity range|yB|<2.4 and transverse
momen-tum range 10 GeV<pT,B<100 GeV, using a subsample of data collected in 2015 corresponding to
an integrated luminosityL =50.8 pb−1. The differential cross-section was extracted from the signal yield in each bin dividing by the branching ratiosB, acceptanceA, efficiency, integrated luminosity and the bin widthΔz, withz= pT,B, yB. An additional factor 2 was included to account forBcharge
symmetry, while the cross-section for the production ofB+only was quoted:
dσ(pp→B+X)
dz =
nsig(z)
2· B ·A·(z)· L ·Δz.
Events were selected applying the requirements on muon quality as described in Sect.3; candidate
J/ψmesons were reconstructed combining pairs of oppositely-charged muons having an invariant mass within±150 MeV of the nominalJ/ψmass,pT,J/ψ>8 GeV and aχ2probability of the
vertex-fit larger than 10%. Candidate B+ mesons were reconstructed combining a J/ψ candidate with a charged track withpT >1 GeV; the track was assumed to be a kaon and the track fit was required
to giveχ2/nd.o.f. <5. A kinematic fit was performed, constraining the dimuon mass to the nominal
J/ψmass; the three-track combination was required to be compatible with having a common vertex with a vertex-fitχ2probability larger than 10% and a reconstructed invariant massM
J/ψKin the range
5÷6 GeV. The transverse decay distance divided by its uncertainty was required to exceed 3.5 and the cosine of the angle betweenB+ candidate momentum and the vector formed by the interaction point and theμμKvertex in the transverse plane had to be greater than 0.99.
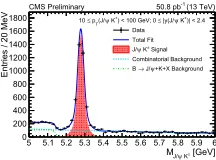
The B+invariant mass distribution was built in bins of transverse momentum and an unbinned maximum likelihood fit was performed; the signal was described with the sum of two gaussians and the background with an exponential plus an error function to describe the contribution of mis-reconstructed decays ofB+with additional particles in the final state. The invariant mass distribution for the inclusive sample in the total acceptance region is shown in Fig.2.
[GeV] ±
K
ψ
J/
M 5 5.1 5.2 5.3 5.4 5.5 5.6 5.7 5.8 5.9 6
Entries / 20 MeV
0 200 400 600 800 1000 1200 1400 1600 1800
Data Total Fit
Signal
±
K
ψ
J/ Combinatorial Background
+K+X Background
ψ
J/
→
B
)| < 2.4 + K
ψ
|y(J/
≤
) < 100 GeV; 0 + K
ψ
(J/ T p
≤
10
CMS Preliminary -1 (13 TeV) 50.8 pb
Figure 2.Invariant mass distribution of the fullB±→J/ψK±candidates
sample: the solid curve shows the result of the fit, the shaded area represents the signal component, the dashed and dash-dotted curves represent the combinatorial and mis-reconstructedB±→J/ψK±Xbackground components, respectively.
The acceptance and efficiency were estimated with a sample of simulated events; trigger and muon reconstruction efficiency was estimated also in data selecting an inclusiveJ/ψsample and applying a tag-and-probe method: the difference with the one obtained from the simulation was included in the systematic uncertainties.
with event-by-event weights determined from the differences between the distributions generated by PYTHIA and given by the FONLL calculations. The uncertainty on theB+lifetime was also included, the error on the integrated luminosity is 4.8% and the uncertainty on the branching ratios is 3.1%.
The differential cross-section versus transverse momentum and rapidity [10] is shown in Fig.3, together with the results obtained at √s = 7 TeV [11] and the predictions from FONLL and PYTHIA [8,12–14].
b/GeV]
μ
[T
X)/dp
+
B
→
(pp
σ
d
3
− 10
2
− 10
1
− 10 1 10
|<2.4)
B
Data (13 TeV, |y |<2.4)
B
Data (7 TeV, |y |<2.4)
B
FONLL (13 TeV, |y |<2.4)
B
FONLL (7 TeV, |y |<2.4)
B
PYTHIA (13 TeV, |y |<2.4)
B
PYTHIA (7 TeV, |y
CMS Preliminary 50.8 pb-1 (13 TeV)
) [GeV] ± K ψ (J/
T
p 0 20 40 60 80 100
FONL
L
σ
/ d
σ
d
0.5 1 1.5 2
b]
μ
X)/dy [
+
B
→
(pp
σ
d
2 4 6 8 10 12 14 16 18 20 22
> 10 GeV)
B T
Data (13 TeV, p > 5 GeV )
B T
Data (7 TeV, p > 10 GeV)
B T
FONLL (13 TeV, p > 5 GeV)
B T
FONLL (7 TeV, p > 10 GeV)
B T
PYTHIA (13 TeV, p > 5 GeV)
B T
PYTHIA (7 TeV, p
CMS Preliminary 50.8 pb-1 (13 TeV)
)| ± K ψ |y(J/ 0 0.5 1 1.5 2 2.5
FONL
L
σ
/ d
σ
d
0.5 1 1.5 2
Figure 3.Differential cross-section versus
transverse momentum (left) and rapidity (right), compared with predictions from FONLL (boxes) and PYTHIA (dashed lines). The lower pads display the data over FONLL cross section ratios (dots) and the
PYTHIA/FONLL ratios (dashed lines).
5 Quarkonium production
Quarkonium production can be described in two phases, with a perturbative generation of a quark-antiquark pair in a singlet or octet state followed by the hadronization producing a bound state, de-scribed by a long-distance matrix element [15–18]. Measurements at different energies allow for a test of this factorization; predictions are done performing different perturbative calculations for each different collision energy and using the same matrix element at all energies [19,20].
Higher energies, with higher cross-sections, allow for a measurement with an extended reach in transverse momentum, up to 120 GeV for rapidity up to 1.2, using the full available data sample collected in 2015 [21]. The product of double-differential cross-section by decay branching ratio was extracted from the signal yield in each bin dividing by acceptanceA, efficiency, integrated luminosity and the bin widths:
B(QQ¯ →μ+μ−)·d
2σ(pp→QQX¯ )
dpTdy =
NQQ¯(z)
L ·ΔpTΔy ·
1
A(pT, y)·(pT, y).
The signal yield in each bin was extracted from an unbinned maximum likelihood fit; the signal was described with a Crystal Ball function and the background with an exponential.
Charmonia can be produced in primary proton-proton interactions (prompt) andb-hadron decays (non-prompt); the two components were separated performing a simultaneous fit to the invariant mass and the “pseudo-proper decay length” [22], with a function describing the prompt component with a resolution function, the non prompt component with an exponential convoluted with a resolution function, and the background with a gaussian plus an exponential.
In Fig.4the fits to the mass and pseudo-proper decay length are shown forJ/ψin apT, ybin.
Acceptance has been estimated in a generated event sample by looking at the fraction of gener-ated events passing the selection; in the generation an unpolarized production of quarkonia has been assumed. Efficiency has been estimated with the tag-and-probe method.
invariant mass [GeV]
-μ
+
μ
2.95 3 3.05 3.1 3.15 3.2 3.25
Events / 10 MeV
0 1000 2000 3000 4000 5000
6000 < 21 GeV
T 20 < p |y| < 0.3
/ndf = 0.98 2 χ Total fit Background (13 TeV) -1 2.4 fb CMS Preliminary
Pseudo-proper decay length [cm] 0.05
− 0 0.05 0.1 0.15 0.2 0.25
m
μ
Events / 20
1 10 2 10 3 10 4 10
< 21 GeV T 20 < p |y| < 0.3
/ndf = 1.26 2 χ Total fit Prompt signal Non-prompt signal Background (13 TeV) -1 2.4 fb CMS Preliminary
Figure 4.J/ψfits: mass (left), pseudo-proper
decay length (right).
length from the primary vertex in place of the average collision point, using different functions for the background or changing parameters constraints.
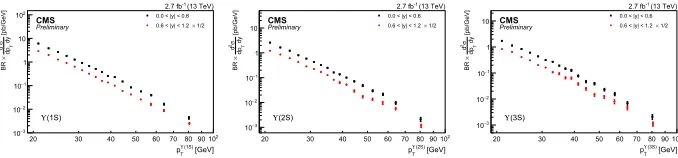
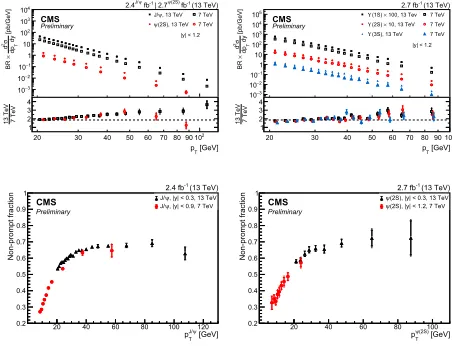
The double-differential cross-sections vs.pT for differentybins are shown in Fig.5forJ/ψand ψ(2S) and in Fig.6forΥ(1S),Υ(2S) andΥ(3S); the comparisons with the measurements at 7 TeV [23,
24] are shown in Fig.7.
The non-prompt fractions versus pT for J/ψandψ(2S), compared with the corresponding
mea-surements at 7 TeV [25], are shown in Fig.8.
6 Conclusions
Differential cross section forB+production at √s=13 TeV has been measured forpTup to 100 GeV;
a reasonable agreement with FONLL calculations and with PYTHIA has been found.
The double differential production cross sections at √s=13 TeV forJ/ψ,ψ(2S),Υ(nS) has been measured. These results shall contribute to consolidate the underlying hypotheses of NRQCD and provide further input to constrain the theory parameters.
The simultaneous production of twoΥ(1S) at √s=8 TeV has been observed and the total cross-section has been measured.
[GeV] ψ
J/ T
p 20 30 40 50 60 70 80 90102
[pb/GeV] dyT dp σ 2d × BR 3 − 10 2 − 10 1 − 10 1 10 2 10 3
10 0.0 < |y| < 0.3 1/2
×
0.3 < |y| < 0.6 1/4
×
0.6 < |y| < 0.9 1/8
×
0.9 < |y| < 1.2
CMS Preliminary (13 TeV) -1 2.4 fb ψ J/ [GeV] (2S) ψ T p 20 30 40 50 60 7080 90102
[pb/GeV] dyT dp σ 2d × BR 4 − 10 3 − 10 2 − 10 1 − 10 1 10
0.0 < |y| < 0.3 1/2
×
0.3 < |y| < 0.6 1/4
×
0.6 < |y| < 0.9 1/8
×
0.9 < |y| < 1.2
CMS Preliminary (13 TeV) -1 2.7 fb (2S) ψ
Figure 5.Double-differential cross-sections vs.pT:J/ψ(left),ψ(2S) (right).
[GeV]
(1S)
Υ
T
p 20 30 40 50 60 7080 90102
[pb/GeV] dyT dp σ 2d × BR 3 − 10 2 − 10 1 − 10 1 10 2
10 0.0 < |y| < 0.6 1/2
×
0.6 < |y| < 1.2
CMS Preliminary (13 TeV) -1 2.7 fb (1S) Υ [GeV] (2S) Υ T p 20 30 40 50 60 7080 90102
[pb/GeV] dyT dp σ 2d × BR 3 − 10 2 − 10 1 − 10 1 10
0.0 < |y| < 0.6 1/2
×
0.6 < |y| < 1.2
CMS Preliminary (13 TeV) -1 2.7 fb (2S) Υ [GeV] (3S) Υ T p 20 30 40 50 60 7080 90102
[pb/GeV] dyT dp σ 2d × BR 3 − 10 2 − 10 1 − 10 1
10 CMSPreliminary 0.0 < |y| < 0.60.6 < |y| < 1.2× 1/2
(13 TeV)
-1
2.7 fb
(3S)
Υ
[pb/GeV] dyT
dp
σ
2
d
×
BR
3
− 10
2
− 10
1
− 10 1 10
2
10
3
10
4
10
[GeV]
T
p 20 30 40 50 60 70 80 90 2
10
7 TeV
13 TeV
1 2 3 4
, 13 TeV
ψ
J/ 7 TeV (2S), 13 TeV
ψ 7 TeV
CMS
Preliminary
(13 TeV)
-1
fb
(2S)
ψ | 2.7
-1
fb ψ
J/
2.4
|y| < 1.2 [pb/GeV] dyT
dp
σ
2
d
×
BR
3
− 10
2
− 10
1
− 10 1 10
2
10
3
10
4
10
5
10
[GeV]
T
p 20 30 40 50 60 7080 90 2
10
7 TeV
13 TeV
1 2 3 4
100, 13 Tev
×
(1S)
Υ 7 TeV
10, 13 TeV
×
(2S)
Υ 7 TeV
(3S), 13 TeV
Υ 7 TeV
CMS
Preliminary
(13 TeV)
-1
2.7 fb
|y| < 1.2
Figure 7.Comparison of the
double-differential cross-sections vs.pTfor 13 TeV and 7 TeV:J/ψandψ(2S) (left),
Υ(1S),Υ(2S) andΥ(3S) (right). The lower pads display the cross section ratios.
[GeV] ψ
J/ T
p 20 40 60 80 100 120
Non-prompt fraction
0.2 0.3 0.4 0.5 0.6 0.7 0.8 0.9 1
, |y| < 0.3, 13 TeV
ψ
J/ , |y| < 0.9, 7 TeV
ψ
J/
(13 TeV)
-1
2.4 fb
CMS
Preliminary
[GeV]
(2S)
ψ
T
p 20 40 60 80 100
Non-prompt fraction
0.2 0.3 0.4 0.5 0.6 0.7 0.8 0.9 1
(2S), |y| < 0.3, 13 TeV
ψ
(2S), |y| < 1.2, 7 TeV
ψ (13 TeV)
-1
2.7 fb
CMS
Preliminary
Figure 8.Comparison of the non-prompt
fraction ofJ/ψ(left) andψ(2S) (right) as a function ofpTfor 13 TeV and 7 TeV.
References
[1] CMS Collaboration, J. Inst.03, S08004 (2008) [2] S.P. Baranovet al., Phys. Lett. B705, 116 (2011) [3] C.H. Komet al., Phys. Rev. Lett.107, 082002 (2011) [4] P. Koet al., J. High Energy Phys.01, 070 (2011) [5] J. Campbellet al., Phys. Rev. Lett.98, 252002 (2007) [6] A.V. Berezhnoyet al., Phys. Rev. D86, 034004 (2012) [7] CMS Collaboration, CMS-PAS-BPH-14-008 (2016) [8] M. Cacciariet al., J. High Energy Phys.05, 007 (1998) [9] B.A. Kniehlet al., Phys. Rev. D77, 014011 (2008) [10] CMS Collaboration, CMS-PAS-BPH-15-004 (2016) [11] CMS Collaboration, Phys. Rev. Lett.106, 112001 (2011) [12] M. Cacciariet al., J. High Energy Phys.03, 006 (2001) [13] M. Cacciariet al., J. High Energy Phys.10, 137 (2012) [14] M. Cacciariet al., arXiv:1507.06197 (2015)
[15] G.T. Bodwinet al., Phys. Rev. D51, 1125 (1995) [16] G.T. Bodwinet al., Phys. Rev. D55, 5853 (1997) [17] P.Cho and A.K.Leibovich, Phys. Rev. D53, 150 (1996) [18] P.Cho and A.K.Leibovich, Phys. Rev. D53, 6203 (1996) [19] P. Faccioliet al., Phys. Lett. B736, 98 (2014)