Study of the GEM detector performance in
BM@N experiment
Sergei Bazylev1, Mikhail Kapishin1, Kacper Kapusniak2, Vladimir Karjavine1, Sergei Khabarov1, Alexander Kolesnikov1, Elena Kulish1, Vasilisa Lenivenko1, Alexander Makankin1, Anna Maksymchuk1,*, Bertrand Mehl2, Rui De Oliveira2, Vladimir Palchik1, Gleb Pokatashkin1, A Rodriguez2, Igor Rufanov1, Alexander Shutov1, Ilya Slepnev1, Vyacheslav Slepnev1, Sergei Vasiliev1, and Alexander Zinchenko1
1JINR, Joliot-Curie 6, 141980 Dubna, Moscow region, Russia 2CERN, Route de Meyrin 385, 1217 Meyrin, Switzerland
Abstract. BM@N is the fixed target experiment at the accelerator complex NICA-Nuclotron aimed to study nuclear matter in the relativistic heavy ion collisions. Triple-GEM detectors were identified as appropriate for the BM@N tracking system located inside the analyzing magnet. Seven GEM chambers are integrated into the BM@N experimental setup and data acquisition system. GEM construction, main characteristics and first obtained results of the GEM tracking system performance in the technical run with the deuteron beam are shortly reviewed.
1 Introduction
The BM@N (Baryonic Matter at the Nuclotron) is the first experiment at the accelerator complex of NICA-Nuclotron [1]. Its main purpose is to investigate properties of nuclear matter under extreme density and temperature. The Nuclotron beam energy range
corresponds to
s
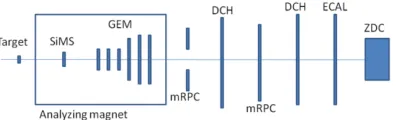
NN = 2.3 – 3.5 GeV, which is of great interest for scientific studies, but still poorly investigated.A scheme of the BM@N experimental setup is shown in Fig. 1. The experiment combines high precision track measurements with time-of-flight information for particle identification and calorimetry for the analysis of the collisions centrality. The magnetic field of the analyzing magnet can be varied up to 1 T to get the optimal detector acceptance and momentum resolution for different reactions and beam energies. The charged particle momentum and multiplicity are measured with the set of Gas Electron Multipliers (GEM) located inside the analyzing magnet and by the Drift Chambers (DCH) situated outside the magnetic field. Double-sided Silicon Micro-strip Sensors (SiMS) are installed between the GEM tracker and the target to improve the track and vertex reconstruction in heavy ion collisions.
Fig. 1. Schematic view of the BM@N experimental setup: SiMS – Silicon Micro-strip Sensors, GEM
– Gas Electron Multipliers, mRPC – Multi-gap Resistive Plate Chambers, DCH – Drift Chambers, ECAL - Electromagnetic Calorimeter, ZDC – Zero Degree Calorimeter.
2 BM@N tracking system
Physics measurements will be performed in conditions of high beam intensities up to 106 ions per second in collisions with large multiplicity of charged particles. This requires the use of detectors with the capacity to resolve multiple tracks produced at very high rate. Detectors based on the GEM technology posses all the mentioned characteristics combined with the capability of stable operation in a strong magnetic field. For this reason, two coordinate Triple-GEM detectors were chosen for the central part of the tracking system, which is located inside the analyzing magnet downstream of the target. At present, the GEM tracking system of the BM@N experiment consists of seven detectors: five GEM detectors of the size of 66 x 41 cm2 (small GEM detectors) and two GEM detectors of the size of 163 x 45 cm2 (big GEM detectors). These detectors were installed into the BM@N set-up for technical runs with the deuteron beam in December 2016 and with the carbon beam in spring 2017.
2.1 GEM detector technology and construction
One GEM foil is made of a 50 µm Kapton foil clad on both sides with 5 µm copper electrodes. The GEM foil is optically semi-transparent due to chemical perforation by a large number of holes of about 70 µm diameter, separated by a distance of 140 µm (manufactured by CERN PH Detector Technologies (DT) and Micro-Pattern Technologies (MPT) workshop) [2].
Fig. 2. Left: Schematic cross section of BM@N triple GEM detector. Right: Schematic view of the big GEM detector.
When the GEM foil is placed between a drift cathode and a readout anode plate and a potential applied between the two sides of the foil, it behaves like a charge amplifier. It is possible to use several GEM foils to achieve gains appropriate for efficient detection of minimum ionizing particles. The BM@N GEM detectors consist of three GEM multipliers, with the following gaps between the electrodes: the drift gap of 3 mm, the first transfer gap
of 2.5 mm, the second transfer gap of 2 mm and the induction gap of 1.5 mm, as it is shown in Fig. 2 (Left).
A two-dimensional projective readout of the electron charge signal is performed on a multilayer readout board with two types of straight parallel metal strips. Their inclination angles to the vertical axis are 0 (X coordinate) and 15 (X coordinate) degrees (Fig.2 Right). There is a hole of 80 mm in diameter in the central region of the big GEM detector in order to install a vacuum beam pipe for heavy ion beam particles. Because of a large multiplicity near the beam line, the readout is divided into the outer and the inner (“hot”) zones. Separate readout of X and X strips of each zone is performed by multilayer printed circuit readout board. The rigidity and support of big GEMs is achieved by using two honeycomb plates. Assembly of the BM@N GEM detectors is performed at the CERN PH DT and MPT workshop.
2.2 FEE and DAQ
Front-end electronics is based on the charge sensitive pre-amplifier chip VA162 (IDEAS) [3]. Chips are joined in groups of 4 in one front-end board. The multiplexed data from each board are transmitted through 13 m of twisted pair flat cable to the 12-bit analog-to-digital converter (ADC) readout by the BM@N data acquisition system [4].
2.3 GEM gas gain measurements
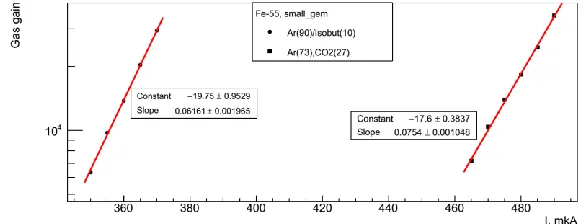
To minimize the discharge probability, Ar(90)/C4H10(10) was selected as a gas mixture for the GEM routine operation within the BM@N experiment, due to its lower, compared to Ar(70)/CO2(30), values of the electric field in the GEM gas gaps. Measurements of the gas gain as a function of the current in the high voltage divider, designed for the BM@N GEM detectors, were performed using the small GEM detector equipped with the calibrated VA162 FEE irradiated with Fe55 radioactive source (Fig. 3). The measurements show, that operational gain of 3∙104 for the Ar(90)/C4H10(10) gas mixture is achieved at a significantly lower value of the divider current compared to the Ar(70)/CO2(30) gas mixture.
Fig. 3. The GEM gas gain for the Ar(70)/CO2(30) and Ar(90)/C4H10(10) gas mixtures as a function of
the current in the high voltage divider
2.4 GEM response uniformity
(Fig.4 Left). The position of the points is shown on XY plane of the distribution. Gap in 3D plot corresponds to the hole for vacuum beam pipe.
Fig. 4. Gas gain uniformity measurements for 163 × 45 cm2 GEM chamber. Left: Response
uniformity 3D plot. Right: Gas gain distribution normalized on average gas gain.
3 Beam results
First beam tests of 7 GEM chambers were performed in December of 2016 with the deuteron beam at the Nuclotron accelerator in JINR. The GEM detectors were arranged in 6 planes as it is shown in Fig.1. The left and right parts of the Big GEM detectors were treated as independent detectors. The main goal of the tests was to study the performance of the GEM detectors and the FEE and readout electronics as a part of the BM@N experimental setup. The GEM detectors were filled with the flowed Ar(90)/C4H10(10) gas mixture and equipped with the VA162 based electronics. The gas gain was around 3∙104 for all the chambers. The measurements were made within the magnetic field varied from 0 up to 0.9 T. The recorded ADC data undergo the pedestal subtraction procedure. The clusters are determined as the groups of adjacent strips with amplitudes of signals above the threshold. For reconstructed clusters, the center of gravity, the width and the total charge are calculated. After applying the alignment procedure for the GEM detector positions, the cluster data were converted into the spatial coordinates of hits. Finally, the tracks of charged particles were reconstructed and track detection efficiency of the GEM chambers was calculated. For the efficiency determination four GEM planes were used as reference detectors and two other were tested. The magnetic field was switched off. The efficiency of the chambers under study was defined from the presence of a cluster with a centre of gravity within ±2 mm of the predicted position.
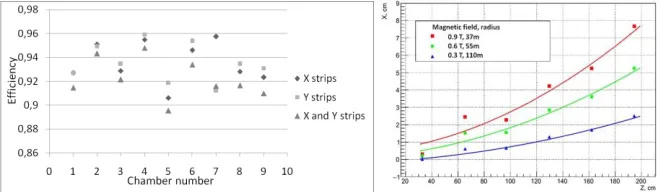
Fig. 5. Left: GEM chamber efficiencies measured in the deuteron beam run in December 2016. Right: The average trajectories of the deuteron beam and the average Lorentz shifts of an electron avalanche in 6 GEM planes measured for three values of the magnetic field.
(Fig.4 Left). The position of the points is shown on XY plane of the distribution. Gap in 3D plot corresponds to the hole for vacuum beam pipe.
Fig. 4. Gas gain uniformity measurements for 163 × 45 cm2 GEM chamber. Left: Response
uniformity 3D plot. Right: Gas gain distribution normalized on average gas gain.
3 Beam results
First beam tests of 7 GEM chambers were performed in December of 2016 with the deuteron beam at the Nuclotron accelerator in JINR. The GEM detectors were arranged in 6 planes as it is shown in Fig.1. The left and right parts of the Big GEM detectors were treated as independent detectors. The main goal of the tests was to study the performance of the GEM detectors and the FEE and readout electronics as a part of the BM@N experimental setup. The GEM detectors were filled with the flowed Ar(90)/C4H10(10) gas mixture and equipped with the VA162 based electronics. The gas gain was around 3∙104 for all the chambers. The measurements were made within the magnetic field varied from 0 up to 0.9 T. The recorded ADC data undergo the pedestal subtraction procedure. The clusters are determined as the groups of adjacent strips with amplitudes of signals above the threshold. For reconstructed clusters, the center of gravity, the width and the total charge are calculated. After applying the alignment procedure for the GEM detector positions, the cluster data were converted into the spatial coordinates of hits. Finally, the tracks of charged particles were reconstructed and track detection efficiency of the GEM chambers was calculated. For the efficiency determination four GEM planes were used as reference detectors and two other were tested. The magnetic field was switched off. The efficiency of the chambers under study was defined from the presence of a cluster with a centre of gravity within ±2 mm of the predicted position.
Fig. 5. Left: GEM chamber efficiencies measured in the deuteron beam run in December 2016. Right: The average trajectories of the deuteron beam and the average Lorentz shifts of an electron avalanche in 6 GEM planes measured for three values of the magnetic field.
The efficiencies are presented in Fig.5 (Left) for the vertical X strips, the inclined X(“Y”) strips and for the coincidence of the X and X(“Y”) strips. The difference in
efficiencies can be explained by the dispersion of FEE amplification factor and by the spatial response non-uniformity of some chambers.
The average shifts of the electron avalanche in the direction perpendicular to the magnetic field (Lorentz shift) were measured from the deviation of hits from the averaged trajectory of the beam as it is illustrated in Fig.5 (Right). Subsequent GEM planes had opposite directions of the electric field in the detectors. The average positions of hits in 6 GEM planes relative to the average trajectory of the beam are shown in Fig. 6 for different values of the magnetic field. For first two chambers the Lorentz shift value exceeds the average shift by factors 2-3. The reason is in the insufficient rigidity of the support construction of these chambers. That leads to an enlargement of the drift gap due to gas flow, which in turn leads to an increase of the Lorentz shift of the electron avalanche. This construction defect was fixed by installation of an additional support structures on the GEM frames.
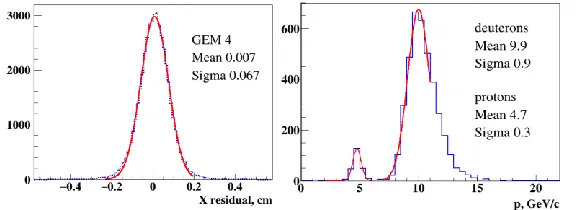
Coordinate and momentum resolutions were calculated using data, collected without target and with magnetic field of 0.79 T. Gaussian fit of hit residuals distribution (Fig.6 Left) gives the standard deviation of 0.067, which conform to the Monte-Carlo simulation. Momentum resolution for deuteron beam (9.7 GeV/c) is ∼9% (Fig.6 Right). The resolution for protons from deuteron defragmentation is ∼6%.
Fig. 6. Left: GEM hit residuals for experimental data. Magnetic field 0.79 T. Right: Momentum resolution for deuteron beam ~9%. Momentum resolution for proton spectators ~6%.
4 Conclusions
Seven triple GEM detectors of the BM@N tracker system have been assembled and studied in the deuteron beam of the Nuclotron accelerator. They comprise one third of the central tracking system of the BM@N experiment. Detectors, readout electronics, cables and readout services were successfully integrated into the BM@N experimental setup and tested during the technical run in December 2016. The measured parameters of the GEM detectors are consistent with the design specifications.
This work would not have been possible without the help of V. Spaskov, N. Zamyatin, O. Tarasov, E. Zubarev, A. Smirnov, I. Filippov, N. Azorskiy, V. Sidorenko, S. Piyadin, A. Terletsky,
L. Ropelevsky, E. Oliveri.
References
1. M. Kapishin, Eur. Phys. J. A52 (2016) no.8, 213 2. F. Sauli, Nucl. Instrum. Methods A 805 (2016) 2–24 3. http://ideas.no/products/ide1162/