EPJ Web of Conferences 94, 04047 (2015) DOI:10.1051/epjconf/20159404047
c
Owned by the authors, published by EDP Sciences, 2015
Numerical study on dynamic compressive deformation and elasto-plastic
wave propagation of foam materials
Kenichi Tanigaki1,a, Toru Idouji1, Keitaro Horikawa1, Hidetoshi Kobayashi1, and Kinya Ogawa2
1Grad. Sch. of Eng. Sci., Osaka University, Toyonaka, Osaka, Japan 2Space Dynamics Lab. Kyoto, Kyoto, Japan
Abstract. Finite element models of closed-cell foam structures were created using the three-dimensional Voronoi tessellation method coupled with the random sequential addition algorithm. The dynamic compressive deformation behaviors of the models were numerically studied using LS-DYNA code. The deformation mode of the models changed gradually as the deformation rate increases. Also, the generation and the propagation of plastic wave was clearly observed with the rate of 100 m/s. The longitudinal elastic wave velocity showed a weak negative dependency on the deformation rate although the strain rate dependence of material properties was not considered. Furthermore, a prediction method for the dynamic stress state on the impact side based on the static stress-strain relationship was presented.
1. Introduction
A stress-strain curve of foam materials generally consists of three stages; elastic region, plateau region, and densification region. Since the plateau region denotes ability of large deformation under low stress, foam structures show excellent energy absorption. However, polymer foam, which is widely used commercially as impact absorbing materials, could not absorb much energy because of polymer’s low yield strength. For this reason, metal forms such as aluminum forms have been developed, which are expected to be used as a shock absorber suitable for high-speed collisions.
The mechanical properties of aluminum foams have been studied experimentally. For instance, from our previous work of high-speed compressions of aluminum foams with a velocity of about 30 m/s, it is shown that plastic waves are generated clearly and the stress state observed at the impact side is quite different from that of the other side. However, the relationship among the nonuniform stress-strain state, the generation of plastic wave, and the deformation speed is still unclear.
In this study, we created FEM models of closed-cell foam structures and carried out compression test simulation with various velocities from 1 to 100 m/s, using LS-DYNA code [1].
2. Calculation detail
2.1. FEM modelling of closed cell foam structures
The three-dimensional Voronoi tessellation method [2] was employed to create closed-cell structures to simulate dynamic deformation behaviors of aluminum foams. First, about 200 nuclei were randomly generated in a 10×10×
aCorresponding author:[email protected]
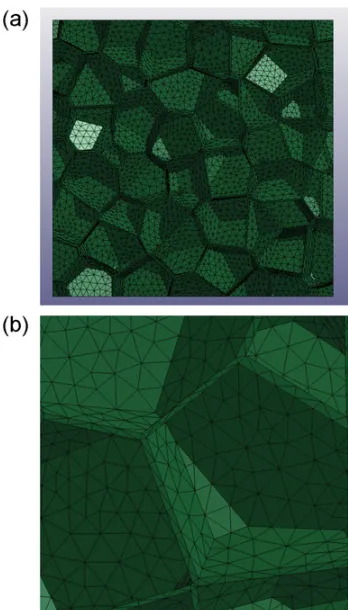
10 mm3cube using the random sequential addition (RSA) algorithm [3], which requests nuclei have a minimum distance and excludes exceedingly close ones. Then, Voronoi cells enclosed by perpendicular bisectors of nuclei were generated. Thus the three-dimensional Voronoi tessellation coupled with the RSA algorithm gave us uniform and randomly distributed polyhedral cells with the aspect ratio of approximately one. Next, the cells were slightly shrunken by moving all vertexes inward to their nuclear. The downsized cells and the space between them were considered as bubbles and cell-walls, respectively. We adjusted the degree of shrinkage of the cells to make the relative density of the foam structures 10%. These geometries of structures were produced using MATLAB and the FEM model was meshed by ANSYS workbench. The characteristic length of element size was set to be 0.5 mm.
Figure 1 shows a 10×10×10 mm3 model made of approximately 200,000 first order tetrahedral solid elements, which was used for compression test simulations to investigate the deformation rate dependence of mechanical properties of foam structures. In addition, an extended 10×10×50 mm3 model (approximately 1,000,000 elements) was also created in the same manner for the purpose of observing elastic and plastic wave propagation.
2.2. Dynamic simulations using LS-DYNA
The cell-wall material was assumed to be bilinear elastic-plastic with Young’s modulus E=69 GPa, Tan-gent modulus E=12.5 MPa, Poisson’s ratio ν=0.33, Yielding stress σy=35 MPa, and mass density ρ= 2700 kg/m3, which are the values of mechanical properties of polycrystalline pure aluminum.
The models were arranged between two rigid walls as shown in Fig.2. One of the walls was fixed (Fixed side),
Figure 1. (a) 10×10×10 mm3 FEM model consists of
first-order tetrahedral solid elements and (b) its close-up view.
Figure 2. Schematic diagram of compression test simulation of the 10×10×10 mm3FEM model with two rigid walls.
and the other moved to compress the model with a constant velocity (Impact side). The velocity v=1–150 m/s were used for the dynamic compression test simulations. All calculations were performed using LS-DYNA code [1].
To obtain the stress strain relationship of the models, the nominal stresses of the models were calculated from the contact reaction forces of both rigid walls and the initial apparent cross sectional area of the models ( A= 100 mm2). The nominal strains of the models were given from a velocity of the moving rigid wallvand a length of the models L.
Figure 3. The stress-strain curves of the 10×10×10 mm3FEM
model obtained from impact side (red lines) and fixed side (blue lines). (a)v=10 m/s. (b)v=100 m/s.
3. Rate dependence of stress-strain
curve and deformation mode
Figure3shows the stress-strain curves obtained from the impact side and the fixed side of the 10×10×10 mm3 model with the deformation rate of 10 m/s and 100 m/s. The stress state of the model can be considered uniform except the very early stage of the deformation when the deformation rate is v= 10 m/s=(˙ε=103s−1). On the other hand, with the deformation rate of 100 m/s (˙ε= 104s−1), the stress states on the impact and fixed sides of the model were quite deferent.
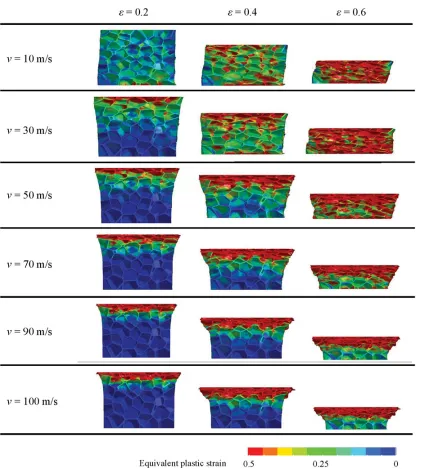
Deformation behaviors of the model with various rates (v=10, 30, 50, 70, 90 and 100 m/s) are shown in Fig.4. The deformation mode of the 10×10×10 mm3 model changed gradually as the deformation rate increases and a plastic wave was clearly observed with the rate ofv= 100 m/s.
DYMAT 2015
Figure 4. The deformation behaviour of the 10×10×10 mm3model for each deformation rate (v=10–100 m/s).
4. Generation and propagation of
plastic wave
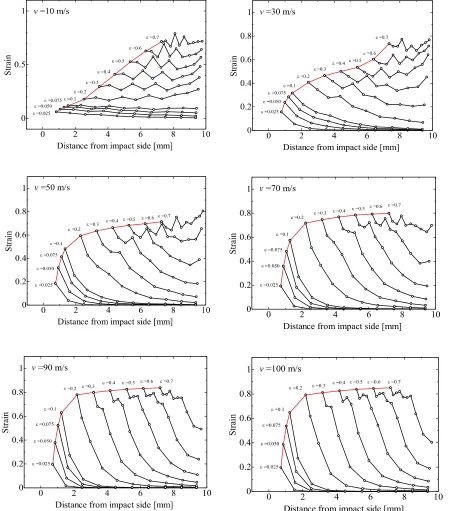
Figure4shows the equivalent plastic strain distribution of each element. To compare and discuss the behaviour of the plastic wave and the macroscopic stress-train relationship (Fig.3), a macroscopic one-dimensional strain distribution was calculated as follows. First, the model was sliced into slabs with a thickness of 0.5 mm. The z-coordinate of the slabs were determined by averaging those of all elements included in each slab.
Then, the generation and the propagation of macro-scopic strain waves in the 10×10×10 mm3model were obtained by a time development of intervals of the slabs as shown in Fig.5. A rapid increase of the strain caused by impact collision (v >30 m/s) was observed on the impact side. When the deformation rates were relatively slow, the increase becomes uniform because of the effect of
the reflected wave from the fixed side. By contrast, with higher rates, it maintained its shape and propagated toward the fixed side. However, a small influence of the reflected wave was still observed even with the maximum rate of
v=100 m/s since the length of the 10×10×10 mm3 model was too short.
Here, The extended 10×10×50 mm3 model was employed to avoid the effect of the reflected wave. Figure6 shows the plastic wave propagation behaviour of the 10× 10×50 mm3 model with the deformation rate of v= 100 m/s. The constant strain region ofε=0.8 following the wave front was clearly observed, and hence, the model can be assumed to be separated into two regions, the plastic-deformed and the non-deformed regions.
The strainεof the plastic deformed region is given by
ε=v/Cp, (1)
Figure 5. The deformation rate dependence (v=10–100 m/s) of the macroscopic one-dimensional strain distribution in the 10×10× 10 mm3model. The red lines indicate the strain observed on the impact side.
The change in momentum mv and the impulse FT of
the plastic-deformed region can be written as
mv =(CpT Aρ∗)v, (2)
FT =σAT, (3)
where A and ρ* are the apparent cross sectional area and the apparent mass density of the model, respectively. Combining Eqs. (1), (2) and (3) leads to the stress on the impact side
σ =ρ∗v2/ε. (4)
Using Eq. (4) and the static stress-strain curve of the model [Fig. 3(a)], the stress on the impact side σ was
calculated to be approximately 3.8 MPa, which was in good agreement with the value obtained from the raction forces on the fixed side with the deformation rate ofv= 100 m/s [Fig.3(b)].
5. Propagation velocity of elastic wave
A longitudinal elastic wave velocity propagating in foam structures is given by
Ce=
DYMAT 2015
Figure 6. The macroscopic plastic wave propagation behaviour in the 10×10×50 mm3 model with the deformation rate of v=100 m/s.
0 0.00001 0.00002 0.00003 0.00004 0.00005
0 20 40 60 Time [sec] Load [N]
v = 1 m/s v = 10 m/s v = 50 m/s v = 80 m/s v= 100 m/s v= 120 m/s
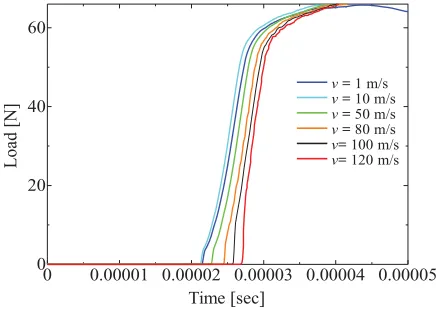
Figure 7. The rising times of the reaction forces observed on the fixed rigid wall using the 10×10×50 mm3extend model.
where E∗ denotes the apparent Young’s modulus of foam structures. To determine the apparent Young’s modulus accurately, an additional quasi-static compression test simulation of the 10×10×10 mm3model with a velocity ofv=0.01 m/s (˙ε=100s−1) was performed. The result showed an entirely uniform deformation and the apparent Young’s modulus of E∗=1.07 GPa was obtained. Using this value and the apparent mass densityρ∗ =270 kg/m3 (the relative densityρ∗/ρ =10%), the longitudinal elastic wave velocity was calculated to be Ce=1987 m/s.
Figure7shows the rising times of the reaction forces observed on the fixed rigid wall using the 10×10× 50 mm3 extended model. Elastic wave velocities were calculated from them for each deformation rate.
The resultant elastic wave velocities of the model were about 2000 m/s. In particular, with the deformation rate of less than 10 m/s, they were in good agreement with the value estimated theoretically. However, the longitudinal elastic wave velocity showed a weak negative dependency on the deformation rate as shown in Fig.8.
In this study, the strain rate dependence of material properties was not considered. Also, the effect of air compression in the cells was ignored. Therefore, the
0 50 100 150
0 1000 2000
Deformation speed [m/s]
Progress speed of elastic wave [m/s]
Figure 8. The deformation rate dependence of the longitudinal elastic wave velocity of the 10×10×50 mm3extend model.
apparent Young’s modulus and the elastic wave velocity should be independent of the deformation rate.
A frequency dispersion due to their discontinuity in structure is a possible cause of that. Because of a long wavelength of low frequency components, the models behave as a homogeneous medium. However, high frequency components of the stress wave caused by high speed collisions, which have short wavelengths, propagate in the cell walls and their phase velocity is assumed to decrease.
6. Conclusion
In this study, the 10×10×10 mm3 and the 10× 10×50 mm3 finite element models of closed-cell foam structures were created using the three-dimensional Voronoi tessellation method coupled with the random sequential addition algorithm. The dynamic compressive deformation behaviors of the models (v=10–100 m/s) of the models were numerically studied using LS-DYNA code.
The plastic deformation mode of the models changed gradually as the deformation rate increases. The generation and the propagation of the plastic wave was clearly observed with the rate of v=100 m/s. Also, the longitudinal elastic wave velocity showed a weak negative dependency on the deformation rate although the strain rate dependence of material properties was not considered. Furthermore, a prediction method for the dynamic stress state on the impact side based on the static stress-strain relationship was presented.
References
[1] Livermore Software Technology Corporation, http://www.lstc.com/products/ls-dyna, (1987).
[2] A. Okabe, B. Boots, K. Sugihara, and S. N. Chiu.
Spatial tessellations: Concepts and applications of Voronoi diagrams, Wiley, second edition (2000).