P R O C E E D I N G S
Open Access
Does the inclusion of rare variants improve risk
prediction?
Erin Austin
1*, Wei Pan
1, Xiaotong Shen
2From
Genetic Analysis Workshop 18
Stevenson, WA, USA. 13-17 October 2012
Abstract
Every known link between a genetic variant and blood pressure improves the understanding and potentially the risk assessment of related diseases such as hypertension. Genetic data have become increasingly comprehensive and available for an increasing number of samples. The availability of whole-genome sequencing data means that statistical genetic models must evolve to meet the challenge of using both rare variants (RVs) and common variants (CVs) to link previously unidentified genome loci to disease-related traits. Penalized regression has two features, variable selection and proportional coefficient shrinkage, that allow researchers to build models tailored to hypothesized characteristics of the genotype-phenotype map. The following work uses the Genetic Analysis Workshop 18 data to investigate the performance of a spectrum of penalized regressions using at first only CVs or only RVs to predict systolic blood pressure (SBP). Next, combinations of CVs and RVs are used to model SBP, and the impact on prediction is quantified. The study demonstrates that penalized regression improves blood pressure prediction for any combination of CVs and RVs compared with maximum likelihood estimation. More significantly, models using both types of variants provide better predictions of SBP than those using only CVs or only RVs. The predictive mean squared error was reduced by up to 11.5% when RVs were added to CV-only penalized regression models. Elastic net regression with equally weighted LASSO and ridge components, in particular, can use large numbers of single-nucleotide polymorphisms to improve prediction.
Background
The potential number of lives affected by successful early identification of patients at high risk for hypertension has motivated researchers across a spectrum of fields. On the frontier of risk prediction is the identification of genetic variants linked to traits such as high blood pressure. Advancements in sequencing have fostered the identifica-tion of a growing number of loci related to blood pressure. One such study performed by the International Consor-tium for Blood Pressure Genome-Wide Association Stu-dies identified 29 single-nucleotide polymorphisms (SNPs) related to systolic blood pressure (SBP) [1]. A second com-pelling study concluded that perhaps as many as hundreds of SNPs affect blood pressure; moreover, rare variants (RVs) (variants with minor allele frequencies [MAFs] less
than 5%) in addition to novel common variants (CVs) (MAFs greater than 5%) are necessary to explain the rela-tionship between allelic variants and blood pressure [2].
One promising tool that may be able to leverage risk information simultaneously in both CVs and RVs is penalized regression. The range of available penalties allows researchers to estimate models with a mixture of two desirable properties: variable selection and propor-tional shrinkage of regression coefficients. The following work systematically measured the advantages of the dif-ferent types of penalized regression methods in the pre-diction of SBP using only CVs, only RV, or combinations of the two.
Methods Data
The primary source for genotypic, phenotypic, and cov-ariate data was Genetic Analysis Workshop 18 (GAW18) data files. GAW18 data is provided for approximately
* Correspondence: [email protected]
1
Division of Biostatistics, School of Public Health, University of Minnesota, Minneapolis, MN 55455-0392, USA
Full list of author information is available at the end of the article
1000 Mexican American individuals consisting of 20 ped-igrees enriched for type 2 diabetes. The pedped-igrees con-tained between 21 and 76 individuals. The phenotype of interest was the SBP measure from the first time point. Genotype data for more than 8,000,000 genome locations was derived from sequencing data for all odd-numbered chromosomes, representing all sequencing data made available by GAW18. Approximately one-third of the var-iants were common. The analysis accounted for the cov-ariates age, gender, smoking status, and antihypertensive medication.
The pairwise correlation structure resulting from either a family structure or a cryptic population struc-ture was removed using an estimate of the variance-cov-ariance matrix. We estimated the vvariance-cov-ariance-covvariance-cov-ariance structure as a function of the identity-by-state (IBS) matrix calculated from all available genome-wide asso-ciation study data. EMMAX software [3] was used to obtain our IBS matrix estimate. For IBS matrix conver-gence, it was necessary to exclude individuals missing more than 10% of genotypes (pre-imputation). There-fore, the final sample size for this study was 759.
Model
Let Yi be the SBP value at the first examination for
sub-jecti= 1,. . .,nand define Xijas subjecti’s minor allele
count (0,1, or 2) for SNP j= 1,. . .,p. Covariate informa-tion for subjectiis notated by Xi,agefor age, Xi,genfor
gender, Xi,smokefor smoking status, and Xi,medfor
antihy-pertensive medication use. The effect of antihyantihy-pertensive medication on blood pressure is not consistent across samples; thus, it is not ideal to include patients using this medication. However, removing patients who used treatment medication from a diabetes-enriched sample would have excluded a significant part of the GAW18 data. We chose to incorporate use of antihypertensive medication as a covariate to account for medication use while minimizing assumptions about its impact on SBP. We assumed the following model relates the genotypic data to the phenotype :Y =Xβ+ε, whereε∼N(0,).
Here,Y =Yn×1, a vector of the phenotype measurement
for thensamples; X=Xn(1+4+p),the design matrix for
the genotype and covariate data, including a column of ones forβ0estimation; andεis an×1vector of random
errors. The vector of predicted phenotypes,Yˆ,is then equal to Xβˆ,whereβˆis the maximum likelihood
esti-mate (MLE) of the coefficient vector, β. More
specifically,
orrelate our samples by premultipling bothY and X by
−1/2
. Kang et al (2010) demonstrated that the
var-iance-covariance matrix,ˆ, can be estimated effectively as a function of the IBS matrix [3]. Kang et al showed the effectiveness of their method on both seemingly unrelated samples and samples with a substantial popu-lation structure [3]. For Kang et al’s method,
ˆ
=σg2K+σr2In, where genetic variance parameter,
σ2
g = residualvariance parameter, andK=IBSˆ . We
dec-orrelated our samples using theˆ −1/2derived with the
Kang et al method. During preparation of the final manuscript, work appeared by Rakitsch et al (2013) using a similar method to correct for population struc-tures in a penalized regression approach to multimarker association mapping [4]. The present investigation stu-died a model of the new vector of decorrelated pheno-types, Y*, as a function of the new genotype and covariate matrix, X*. To be clear, the model used in the current study is Y*=X*b+ε*, where ε∗∼N(0,σ2In).
Note:σ2≈1.
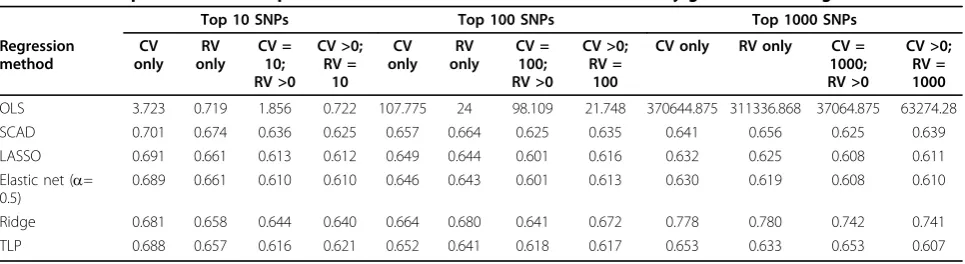
We first consider the unpenalized regression model. MLE is asymptotically unbiased with fixedpasn→ ∞, but it may not be for a largep. One possible remedy is to introduce regularization or penalization on regression coefficients. We obtained predictions of Y * by first obtaining βˆ, thenYˆ∗=X∗βˆ. For penalized regression Table 1 Median predicted mean square errors for calculated from the 100 randomly generated testing sets
Top 10 SNPs Top 100 SNPs Top 1000 SNPs
Regression
OLS 3.723 0.719 1.856 0.722 107.775 24 98.109 21.748 370644.875 311336.868 37064.875 63274.28 SCAD 0.701 0.674 0.636 0.625 0.657 0.664 0.625 0.635 0.641 0.656 0.625 0.639 LASSO 0.691 0.661 0.613 0.612 0.649 0.644 0.601 0.616 0.632 0.625 0.608 0.611 Elastic net (a=
0.5)
0.689 0.661 0.610 0.610 0.646 0.643 0.601 0.613 0.630 0.619 0.608 0.610
Ridge 0.681 0.658 0.644 0.640 0.664 0.680 0.641 0.672 0.778 0.780 0.742 0.741 TLP 0.688 0.657 0.616 0.621 0.652 0.641 0.618 0.617 0.653 0.633 0.653 0.607
methods,βˆis found by maximizing a penalized log-likeli-hood [5]:l(β)−λP(β).
Candidate penalties that perform variable selection are LASSO [6], SCAD [7], and the truncated L1-penalty (TLP) [8]. LASSO regression is performed by
applying the penalty P(β)=p whereτ >0is a thresholding parameter, beyond which there is no further penalty. Regressions using these penalties are three methods to shrink many regression coefficient estimates to 0, effectively selecting a subset of SNPs to be used for prediction. The variable selection feature can be of particular value in genetics settings such as ours where the number of true causative var-iants is likely a small fraction of the considered SNPs. If instead of variable selection, it is advantageous to pro-portionally shrink all regression coefficients, a candidate penalized regression method is ridge regression [9]. Ridge regression uses the penalty P(β)=p
k=1β 2
k.
Elastic net penalized regression [10] is a hybrid of the two approaches, with a penalty structure that is a mixture of the LASSO and ridge penalties controlled by a user-specified mixing parameter,α, which is restricted
to 0 [1]. The elastic net penalty [10] is
P(β)=(1−α) β 22+α β 1, where α is selected to match the desired balance of variable selection and coef-ficient shrinkage.
Implementation
We restricted our study to the top 1000 CV SNPs and top 1000 RV SNPs as identified by the marginal signifi-cance of a Kruskal-Wallis test of the minor allele counts and SBP values for the 759 samples. The real-data observations were randomly divided into equally sized training, tuning, and testing sets (n= 253 for each), and a sequence of models was then fit on the training set. The sequence was defined by incremental increases in both the penalty and penalty-specific parameters (e.g., a andτ). The sequence of penalty (and tuning parameter when applicable) values used to fit the models spanned a range comprehensive enough to allow identification of the values which optimized performance for SCAD, LASSO, elastic net, and ridge regression. The additional tuning parameter,τ, used in TLP-penalized regression greatly increased the computational time; therefore, the number ofτ andτ pairs considered was constrained. The TLP results presented here likely underestimate the true performance of this method. In all penalized regres-sions, the optimal penalty value was the one minimizing prediction error in the estimated tuning phenotypes
when applying the regression coefficients estimated from the training model based on that penalty value.
Models were fit in a directed way based on the num-ber and type of variants. First, we examined only the top 10, 100, and 1000 most significant CVs. Then we repeated the examination using only the top 10, 100, and 1000 RVs. Next, we added 1, 10, 100, and 1000 of the complementary type of variant to the model. For example, after fitting a model with only the top 10 CVs, four models were fit using these same 10 CV SNPsand
the top 1, then top 10, then top 100, and finally the top 1000 RVs. The formal assessment of the regression methods was done by applying the training coefficients corresponding to the optimal penalty to the testing data. This process of randomly dividing the real data set into training, tuning, and testing sets and then investigating the predictive performance of penalized regression methods was repeated 100 times as a form of cross-vali-dation. The regression approaches were compared using predictive mean squared error (PMSE). Define
PMSE=n
tic net, and ridge-regression estimates were generated using R packages glmnet [5] and ncvreg [11]. TLP esti-mates were obtained using FGSG: Feature Grouping and Selection Over an Undirected Graph in Matlab [12].
Results
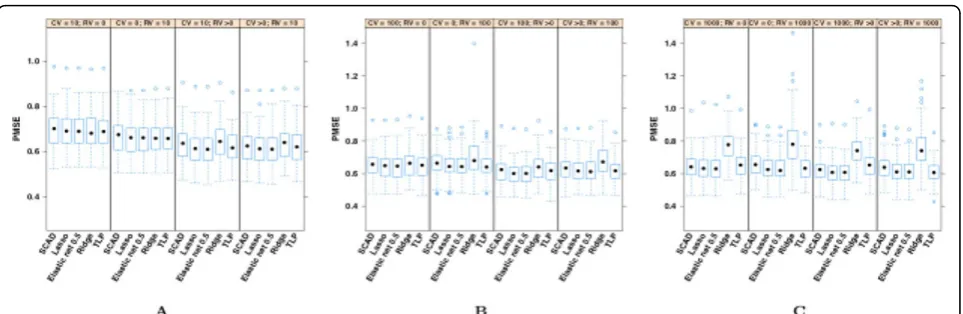
OLS PMSEs are not presented in Figure 1 because of their relative size.
It is evident from Table 1 that penalized regression methods outperform OLS regardless of the number or type of candidate variants. Fixing the type of penalized regression and the number of top SNPs considered for the model allows us to uncover that RV-only models usually outperformed CV-only models. The difference was small, though. The central question to be answered by this work was whether adding RVs to CV models improved SBP prediction. We found that for penalized regression models, the inclusion of at least one of the complementary type of variant improved or maintained the performance of the model. This was true whether we fixed 10, 100, or 1000 top SNPs, added CVs to RV-only models, or added RVs to CV models. Again, the differences were small; however, small but perceptible shifts in the overall distributions as presented in Figure 1 support this conclusion.
Comparisons across models based on the top 10, top 100, and top 1000 SNPs revealed an interesting pattern. As the number of candidate SNPs increased, the sparse SCAD, LASSO, and TLP penalties were generally super-ior to the nonsparse ridge penalty. Differences were small, at most 0.1555 mm Hg, and need confirmation on different SBP real data sets. The conclusion should also be corroborated with simulated SBP data sets gen-erated from genetic models reflecting a comprehensive range of possible SBP genetic architectures. Further-more, although reductions in PMSE occurred within the same variant composition across the three top SNP groupings (e.g., comparing CV only for the top 10 with CV only with the top 100 SNPs), the gains were often less than those made just by adding the complementary type of variant to the model. Combined, these two results suggest that the true number of strong causative variants is at most moderate and includes both RVs and
CVs. Ridge regression was the best or nearly identical to the best penalty choice when only the top 10 CVs or RVs were used, indicating that all of these top variants are integral in understanding the association between genotypes and SBP. TLP was a top performer with mod-els using only the top 10 or top 100 RVs. As more SNPs of any type were included, the elastic net equally weighted to LASSO and ridge was generally superior. That is, there was a need for a selection element to dis-tinguish noise from true effect, and there was a need for a nonsparse penalty feature to still incorporate larger numbers of SNPs in the regression model. This perhaps indicates that beyond a small set of strong causative SNPs, there are many SNPs that are truly associated with the outcome, but the majority of them have small marginal effects sizes. This could prove important when considering that previous research has found at least 29 causative SNPs; thus, undiscovered variants associated with SBP may have at most moderate effect sizes.
Discussion
The strongest conclusion can be drawn about the effect of including RVs in addition to CVs when predicting SBP. The PMSE was reduced by up to 11.5%, and gener-ally reduced between 4% and 9%, when RVs were added to CV-only penalized regression models. This was true when any of 10, 100, or 1000 top SNPs were used. PMSE comparisons of single-variant type models to combined-variant type models revealed that both RVs and CVs explain variance in SBP. Every penalty consid-ered in the study improved SBP prediction over OLS. This was true whether estimation used only CVs, used only RVs, or used both types of variants. The elastic net penalized regression was best at leveraging the informa-tion in the addiinforma-tional SNPs (RVs or CVs) and produced the best overall models. (Again, the absolute reduction in PMSE was too small to be statistically significant
because of the variance in the PSME median distribu-tions.) Caution is needed when making conclusions about the TLP because of the limited number of combi-nations oflandτ studied because of time constraints. The results here likely understate the performance of TLP; thus, the small gains from using TLP with the top 10 and top 100 RVs warrant future analysis for possible confirmation. Work on the genotype-hypertension map should specifically consider RVs and CVs. The interest-ing result that a hybrid penalty with both selection and proportional shrinkage components performed best hints at an underlying architecture in which numerous SNPs with moderate main effects are interrelated in how they are associated with blood pressure. Overall, the results presented here provide evidence that pena-lized regression, especially a hybrid of LASSO and ridge regression, can be used to improve SBP prediction.
Competing interests
The authors declare that they have no competing interests.
Authors’contributions
WP designed the study framework, helped develop methodology, and helped rewrite the manuscript; EA performed the statistical analysis, drafted the manuscript, and helped rewrite the manuscript; and XS helped develop methodology and helped develop software used to conduct the analysis. All authors read and approved the final manuscript.
Acknowledgements
This research was supported by National Institutes of Health (NIH) grants R01HL65462, R01HL105397, and R01GM081535. The authors appreciate the valuable feedback from the GAW18 Machine Learning and Data Mining Group including AB, H-HH, SK, AL, and group leader RC. The GAW18 whole genome sequencing data were provided by the T2D-GENES (Type 2 Diabetes Genetic Exploration by Next-generation sequencing in Ethnic Samples) Consortium, which is supported by NIH grants U01 DK085524, U01 DK085584, U01 DK085501, U01 DK085526, and U01 DK085545. The other genetic and phenotypic data for GAW18 were provided by the San Antonio Family Heart Study and San Antonio Family Diabetes/Gallbladder Study, which are supported by NIH grants P01 HL045222, R01 DK047482, and R01 DK053889. The GAW is supported by NIH grant R01 GM031575.
This article has been published as part ofBMC ProceedingsVolume 8 Supplement 1, 2014: Genetic Analysis Workshop 18. The full contents of the supplement are available online at http://www.biomedcentral.com/bmcproc/ supplements/8/S1. Publication charges for this supplement were funded by the Texas Biomedical Research Institute.
Authors’details
1Division of Biostatistics, School of Public Health, University of Minnesota,
Minneapolis, MN 55455-0392, USA.2School of Statistics, University of
Minnesota, Minneapolis, MN 55455, USA.
Published: 17 June 2014
References
1. Genetic variants in novel pathways influence blood pressure and cardiovascular disease risk. Nature2011,478:103-109, The International Consortium for Blood Pressure Genome-Wide Association Studies. 2. Levy D, Ehret G, Rice K, Verwoert G, Launer L, Dehghan A, Glazer N,
Morrison A, Johnson A, Aspelund T,et al:Genome-wide association study of blood pressure and hypertension.Nat Genet2009,41:666-676. 3. Kang H, Sul J, Service S, Zaitlen N, Kong SY, Freimer N, Sabatti C, Eskin E:
Variance component model to account for sample structure in genome-wide association studies.Nat Genet2010,42:348-354.
4. Rakitsch B, Lippert C, Stegle O, Borgwardt K:A Lasso multi-marker mixed model for association mapping with population structure correction.
Bioinformatics2013,29:206-214.
5. Friedman J, Hastie T, Tibshirani R:Regularization paths for generalized linear models via coordinate descent.J Stat Softw2008,33:1-22. 6. Tibshirani R:Regression shrinkage and selection via the LASSO.J Roy Stat
Assoc Ser B1996, ,58:267-288.
7. Fan J, Li R:Variable selection via nonconcave penalized likelihood and its oracle properties.J Am Stat Assoc2001,96:1348-1360.
8. Shen X, Pan W, Zhu Y:Likelihood-based selection and sharp parameter estimation.J Am Stat Assoc2012,107:223-232.
9. Hoerl A, Kennard R:Ridge regression: biased estimation for non-orthogonal problem.Technometrics1970,12:55-67.
10. Zou H, Hastie T:Regularization and variable selection via the elastic net.
J Roy Stat Soc Ser B2005,76:301-320.
11. Breheny P, Huang J:Coordinate descent algorithms for nonconvex penalized regression, with applications to biological feature selection.
Ann Appl Stat2011,5:232-253.
12. Yang S, Yuan L, Lai Y, Shen X, Wonka P, Ye J:Feature grouping and selection over an undirected graph.Proceedings of the 18th ACM SIGKDD International Conference on Knowledge Discovery and Data Mining2012, 922-930.
doi:10.1186/1753-6561-8-S1-S94
Cite this article as:Austinet al.:Does the inclusion of rare variants improve risk prediction?BMC Proceedings20148(Suppl 1):S94.
Submit your next manuscript to BioMed Central and take full advantage of:
• Convenient online submission
• Thorough peer review
• No space constraints or color figure charges
• Immediate publication on acceptance
• Inclusion in PubMed, CAS, Scopus and Google Scholar
• Research which is freely available for redistribution