R E S E A R C H
Open Access
Visual sensor image enhancement based
on non-sub-sampled shearlet transform
and phase stretch transform
Ying Tong
1,2Abstract
Acquiring clear images is a requisite in visual sensor networks. Image enhancement is an effective way to improve image quality. In this paper, non-sub-sampled shearlet transform (NSST) multi-scale analysis is combined with phase stretch transform (PST) to nonlinearly enhance the images captured by visual sensors. The components of different scales after NSST multi-scale decomposition are processed by nonlinear models with different thresholds. The thresholds of the enhanced model are determined by the local standard deviation of PST feature map. The noise is well suppressed, and the detail features are enhanced obviously. Experiments show that the proposed algorithm can improve image distortion, clear details, and enhance image contrast effectively.
Keywords:Image enhancement, Image processing, Non-sub-sampled shearlet transform, Phase stretch transform
1 Introduction
Wireless sensor network technology has developed rap-idly in recent years [1–3]. It has been widely used in military, intelligent transportation, medical care, and other fields [4, 5]. Visual sensor is a kind of commonly used sensor in wireless sensor networks. Visual sensor is an instrument that uses optical elements to obtain image information of external environment. A visual sensor network is constructed by optical sensor devices distrib-uted in space. Visual sensor networks are very helpful in applications involving environmental monitoring, area detection, and trail tracking. The purpose of computer vision is to extract meaningful descriptive information from images or image sequences. So the images obtained by sensor networks must be clear and easy to be identi-fied. While in the process of acquiring digital images in visual sensor networks, it often leads to blurred images, low contrast, and difficult identification due to some ob-jective factors, such as illumination, camera angles, and imaging characteristics of sensors.
Image enhancement is a crucial pre-treatment step for many image processing applications, because it is an ef-fective way to improve the image quality. Image en-hancement refers to the use of certain methods that can highlight the interested features in an image according to some specific needs, meanwhile weakening or remov-ing irrelevant information. By this way, it can transform the image into a more suitable style for human eye rec-ognition and computer perception.
Image enhancement algorithms can be roughly
grouped into two kinds: space domain image enhance-ment and frequency domain image enhanceenhance-ment. Space domain image enhancement algorithm is mainly based on grayscale transformation, histogram processing [6], mean filtering, and other methods. Its basic principle is to adjust the gray value of images in order to achieve local contrast enhancement and noise suppression. Fre-quency domain image enhancement is also called trans-form domain image enhancement. Its basic idea is to use multi-resolution analysis tools to modify the transform coefficients at different scales of the image so as to indir-ectly remove noise and enhance details of some inter-ested features. Nowadays, the transform domain image enhancement algorithm has gradually become a research hotspot. Common multi-scale analysis tools for image
enhancement include wavelet transform [7], contourlet
Correspondence:[email protected]
1Tianjin Key laboratory of Wireless Mobile Communications and Power
Transmission, Tianjin Normal University, Tianjin 300387, China 2College of Electronic and Communication Engineering, Tianjin Normal
University, Tianjin 300387, China
transform, and shearlet transform. Literature [8] pro-posed an algorithm for image enhancement based on non-sub-sampled contourlet transform (NSCT) and adaptive threshold. Literature [9] combined contrast lim-ited adaptive histogram equalization and wavelet trans-form to enhance the local details of an image. Shearlet transform appeared in recent years. It has good results in image processing applications, such as image fusion, enhancement, and denoising. In our early research, we
have applied non-sub-sampled shearlet transform
(NSST) to enhance images adaptively and fuse images in compressive domain [10,11].
Image phase information plays a crucial role in the procedure of human perception of images. Phase infor-mation can reflect the space inforinfor-mation of images and has a strong ability to interpret images. Phase correlation is often applied to image registration [12, 13]. Literature
[14] proposed a phase information-based contrast
en-hancement scheme that can transform phase changes into amplitude variations so as to reveal the inhibited structural details in high-frequency components.
From the above analysis, it is supposed that if we can combine the accuracy of multi-scale analysis with the sta-bility of phase analysis in the process of image enhance-ment, we will get a more ideal enhancement performance. In this paper, we propose an image enhancement method which takes the advantages of NSST and phase stretch transform (PST) to nonlinearly enhance the images cap-tured by visual sensors. Experiments show that the en-hanced images processed by our algorithm have clear details and contrast without any artifacts.
2 Design of the algorithm
2.1 NSST multiscale analysis
NSST is a multi-scale and multi-directional analysis tool. It is an optimal approximation, which is a “true” sparse representation of the image in all directions and at vari-ous scales. In addition, unlike traditional shearlet trans-form, NSST does not perform down-sampling when performing multi-scale decomposition of an image. It combines a non-down-sampling tower transform with a non-sub-sampled directional filter bank and transforms. The size of the directional sub-bands of each scale is the same as that of the original image. The transform has shift invariance and can overcome the pseudo-Gibbs phenomenon when the image is reconstructed.
2.2 Feature extraction with PST
PST is a new image processing method proposed by Asghari and Jalali [15]. It is said that PST has superior performance in feature extraction, especially edge ex-traction. The PST processing can be divided into several steps: Firstly, smooth the image with a low pass filter to reduce noise. Secondly, apply the PST kernel which has
a non-linear frequency-dependent transfer function to the image. The output of the transform is the phase in space domain. The applied phase is frequency dependent with the original image, it means that higher amount of phase corresponds to higher frequency image features. Finally, find image sharp transitions by thresholding the phase and apply binary morphological operations, so as to enhance the features and clean the transformed image. PST is defined in frequency domain [15] as (1).
A n½ ;m ¼∠IFFT2K p~½ ;q ~L p½ ;q FFT2fB n½ ;mg ð1Þ
wherenandmare the space domain variables,A[n,m] is the output phase image,B[n,m] is the input image, FFT2 is the two-dimensional fast Fourier transform, IFFT2 is the two-dimensional inverse fast Fourier transform. p and q are the frequency domain variables. The function
~
K½p;qis the warped phase kernel, and ~L½p;q is the fre-quency response of the localization kernel.
2.3 Nonlinear enhancement model
Image information can be roughly classified into several parts, such as edges, details, background, and noise. The edges of image can be subdivided into sharp edges and fuzzy edges. When selecting the enhancement model, we need to take into account the features of different kinds of information. It is appropriate to preserve clear edges, enhance fuzzy edges, and suppress noise effectively. Therefore, nonlinear function is a good choice. The en-hancement function selected in this paper was presented by A. F. Laine. After that, some researchers applied this function to image enhancement and obtained good per-formances. The enhancement function is shown in (2).
f xð Þ ¼a sigm c x½ ð ð −bÞÞ−sigmð−c xð þbÞÞ ð2Þ
where a¼ 1
sigmðcð1−bÞÞ−sigmð−cð1þbÞÞ, sigmis defined assigm ðxÞ ¼ 1
1þe−x。.
In this function, there are two parameters of bandc,
wherebis used to control the enhancement range, and
its value is generally between 0 and 1. cis used to con-trol the enhancement strength, and it usually uses the fixed value between 20 and 50. However, our algorithm
does not pre-set fixed values for b and c. Instead, we
set two thresholds of the function to determine the shape of the function curve, and then obtain the values
of b and c. After the procedure of NSST
decompos-ition, the image has been decomposed into different scales and directions, so we can set various thresholds for different scales of the coefficients and enhance them
respectively. Therefore, the enhancement process
would be more refined.
2.4 Algorithm flow and steps
NSST transform is applied to decompose the original image. After that, the NSST coefficients of different scales and directions can be obtained. Since image detail infor-mation often exists in high-frequency coefficients, we choose high scale coefficients for processing, while keep the low frequency coefficients unchanged. The purpose of image enhancement is to enhance detail information and suppress noise. Therefore, we need to use the appropriate method to distinguish high-frequency signals.
Considering that PST algorithm has obvious advantage in extracting features of image, the proposed method ex-tracts the details of the original image by PST and uses its output as the image feature map. Figure1 is the fea-ture map of the Lena image processed by PST. From the feature map, we can clearly distinguish the region where the detail information is concentrated. So it can be used as the reference of image enhancement.
After PST, the local standard deviation (LSD) of each pixel in the feature map is calculated according to (3). The LSD reflects the contrast change of the local area in an image. Therefore, the pixels with larger LSD in fea-ture map will be rich in the detail texfea-tures around it, so they should be enhanced, while the region with smaller value of the LSD can be mildly enhanced or preserved.
LSDnðx;yÞ ¼
ffiffiffiffiffiffiffiffiffiffiffiffiffiffiffiffiffiffiffiffiffiffiffiffiffiffiffiffiffiffiffiffiffiffiffiffiffiffiffiffiffiffiffiffiffiffiffiffiffiffiffiffiffiffiffiffiffiffiffiffiffiffiffiffiffiffiffiffiffiffiffiffiffiffiffiffiffiffiffiffiffiffiffiffiffiffiffiffiffiffiffiffiffiffiffiffiffi 1
2nþ1
ð Þ2
Xn
i¼−n Xn
j¼−n
p xð þi; yþjÞ−meannðx;yÞ
½ 2
v u u t
meannðx;yÞ ¼ 1 2nþ1
ð Þ2
Xn
i¼−n Xn
j¼−n
p xð þi; yþjÞ
ð3Þ
where meann(x,y) is the mean value of the pixels in the local window centered atp(x,y) and the size of the local window is (2n+ 1)∗(2n+ 1).
The enhancement of the NSST high scale coeffi-cients depends on the output of the nonlinear
en-hancement model. In order to facilitate the
calculation, the values of the input need to be
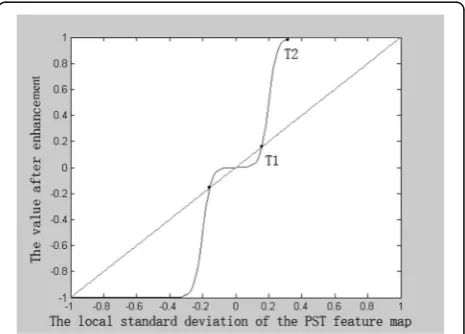
nor-malized. The nonlinear enhancement function in Fig. 2
contains two thresholds. One threshold is the first nonzero intersection of the enhancement function and the line of y=x. It is the threshold that charac-terizes the feature coefficients from noise coefficients. It is called as T1. If the abscissa value of a certain point on the function curve is less than T1, then the value of its ordinate will be reduced nonlinearly, that is suppression (applicable to noise information); while if the abscissa value of a certain point on the function curve is greater than T1, the value of its ordinate will be nonlinearly stretched, that is enhancement (applic-able to detail information). The other threshold is the first intersection of the enhancement function and the
line of y= 1. It is the threshold that determines the
Fig. 1Lena image and its feature map processed by PST.aLenabPST feature of Lena
extent of enhancement. We call it T2. If the abscissa of a certain point on the enhancement function curve is larger than T2, it is considered as strong edge, so the ordinate value of this part will be set to 1 after enhancement.
As shown in Fig. 2, the abscissa value in the graph
is set to be the LSD of the corresponding pixels in
the feature map. We choose k1 times of the
mini-mum value of the LSD as T1 and k2 times of the
maximum as T2. The values of k1 and k2 depend on
the quality of the original image and the decompos-ition scales. In our algorithm, k1 is an integer
propor-tional to the decomposition level n, and k2 is an
integer inversely proportional to the decomposition level, as is shown in (4).
k1¼kn
k2¼k=n ð4Þ
In our experiments, we choose 15 as an empirical value of k. If the image contains noise, the value of k
should be enlarged properly. And smallerkwill be more
suitable for low contrast image. When the two
thresh-olds are determined, the values of b and c can be
ob-tained by solving the nonlinear equation group (5).
Hence, the enhancement function is formed.
f Tð Þ ¼1 T1 f Tð Þ ¼2 1
ð5Þ
After that, if we bring the pixel’s LSD of the PST
fea-ture map into the enhancement function, the
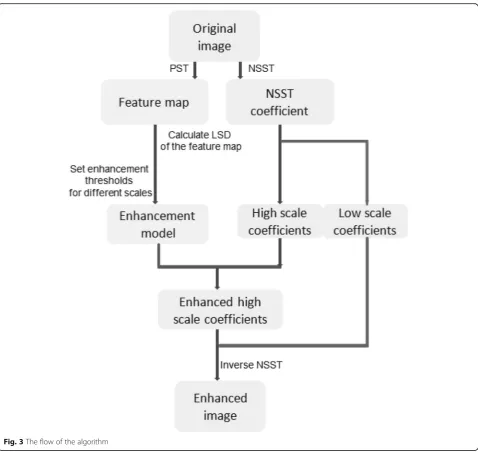
Fig. 3The flow of the algorithm
enhancement ratio at the pixel can be read in the en-hancement curve. It is the ratio of the ordinate value to the abscissa value. The NSST coefficients of the each scale can be multiplied with the enhancement ratio, and then the new coefficients after the enhancement pro-cessing can be obtained. Finally, the enhanced image is formed by NSST inverse transform.
The flow of the algorithm can be concluded as Fig.3. The enhancement steps are as follows:
1) Decompose the original image with NSST. The source image can be decomposed into a low-frequency sub-band and a series of high-low-frequency sub-bands. In our experiment, the image is Fig. 4Enhancement results of Lena.aOriginal imagebDSBPcFuzzy_INT.dNSCTeNSSTfProposed
decomposed into three scales and the coefficients of the higher two layers will be enhanced.
2) The original image is processed by PST, and the image feature map is obtained.
3) Calculate the LSD of each pixel in the feature map. The value represents the complexity of image detail, and it can be used as the reference of the
enhancement extent. That is, the enhancement
extent of NSST coefficient is determined according to the LSD of each pixel in the PST feature map. 4) The two thresholds of the nonlinear enhancement
function are set up according to the maximum and minimum value of the LSD in the feature map. Differentkvalues are set for different scales of NSST coefficients, and then the enhancement models are constructed for different decomposition scales. Fig. 6Enhancement results of car.aOriginal imagebDSBPcFuzzy_INTdNSCTeNSSTfProposed
Fig. 7Enhancement results of the SAR image.aOriginal imagebDSBPcFuzzy_INTdNSCTeNSSTfProposed
5) The LSD of each pixel in the feature map is taken into the enhancement model, and the enhancement ratio of each coefficient can be obtained. Multiply the NSST coefficients of each layer with the enhancement ratios, so as to obtain the enhanced coefficients. 6) The NSST inverse transformation is performed on
the enhanced higher two-scale coefficients and the unprocessed coefficients of the first scale to recon-struct the enhanced image.
3 Experiments and simulation
3.1 Experiment settings
The experiments are carried out on four images. They are standard images Lena and Barbara, image Car shot by optical sensor, and a local screenshot of a radar image. Five representative algorithms including the pro-posed method are selected to enhance the images re-spectively. All experiments are carried out on Matlab R2016b platform.
3.2 Simulation and evaluation
The enhancement simulation results are shown in Figs.4, 5, 6, and7, among which (a) is the original image, (b) is enhanced using Dynamic Stretching-based Brightness Preservation [16] (DSBP), (c) is the enhancement effect
via Tuned Fuzzy Intensification operators [17]
(Fuzzy_INT), (d) is the image enhanced by NSCT adap-tive enhancement [8], (e) is the enhancement result with NSST [10], and (f ) is the performance of the proposed algorithm.
Generally, it is difficult for human beings to per-ceive the mild differences among the enhancement re-sults of various algorithms. Hence, the paper adopts two widely used objective evaluation parameters, Edge
Preserved Index (EPI) [18] and Contrast Improvement
Index (CII) [19] to evaluate the image enhancement
effects. EPI measures the edge preserving ability of the enhanced image. CII is used to measure the con-trast of the processed image, so as to reflect the de-tails of the image and the enhancement effect. The
greater values of EPI and CII indicate the better qual-ity of the image.
4 Results and discussion
By subjective evaluation, it can be seen that our algo-rithm has significant effects on detail and edge enhance-ment. The enhanced images have no pseudo-Gibbs phenomenon, and the details are clear without obvious distortion. It has better enhancement effects on images with complex details.
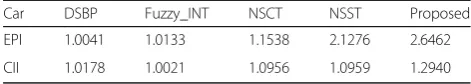
In terms of the objective metrics, Tables 1, 2, 3,
and 4 show that the enhancement effects of our
algo-rithm are more ideal than the comparison algoalgo-rithms, especially in edge preservation. The EPI of the pro-posed algorithm is much higher than the other algo-rithms. For contrast improvement, we still have potentiality to do better. We will try different ways to set the thresholds of the enhancement model in our future work aiming to improve the image contrast more obviously.
The proposed algorithm is suitable for the enhance-ment of optical images captured by visual sensors. And it is also applicable for radar image enhancement. We have tried to extend our method to improve images cap-tured by infrared sensors, but we have not achieved good performance until now. Our algorithm depends largely on the detail features of images, so it is less ef-fective in infrared images enhancement which are not rich in detail textures.
5 Conclusion
This paper describes an approach for accomplishing an image enhancement algorithm, which can improve the clarity of the gray images captured by visual sen-sors. The proposed method combines NSST and PST and takes the advantages of multi-scale analysis and image phase analysis to perform nonlinear enhance-ment of images. The algorithm can enhance image details and edge features without amplifying noise.
And there are no ringing artifacts near edges.
Table 1Objective evaluation parameters for Lena image set
Lena DSBP Fuzzy_INT NSCT NSST Proposed
EPI 1.1704 1.0968 2.0942 2.3440 2.5283
CII 1.0688 1.0777 1.0639 1.0734 1.0823
Table 3Objective evaluation parameters for car image set
Car DSBP Fuzzy_INT NSCT NSST Proposed
EPI 1.0041 1.0133 1.1538 2.1276 2.6462
CII 1.0178 1.0021 1.0956 1.0959 1.2940
Table 2Objective evaluation parameters for Barbara image set
Barbara DSBP Fuzzy_INT NSCT NSST Proposed
EPI 1.0103 1.0033 1.8084 2.0732 3.1209
CII 1.0909 1.0978 1.1463 1.1961 1.3666
Table 4Objective evaluation parameters for the SAR image set
Radar DSBP Fuzzy_INT NSCT NSST Proposed
EPI 1.0152 1.0183 1.6543 1.8928 2.4206
Experiments on Matlab platform prove that the algo-rithm is better than the other algoalgo-rithms in terms of accurate edge preservation and adequate contrast enhancement.
Abbreviations
CII:Contrast Improvement Index; DSBP: Dynamic Stretching-based Brightness Preservation; EPI: Edge Preserved Index; Fuzzy_INT: Tuned Fuzzy
Intensification operators; LSD: Local standard deviation; NSCT: Non-sub-sampled contourlet transform; NSST: Non-sub-Non-sub-sampled shearlet transform; PST: Phase stretch transform
Acknowledgements
The author would like to thank Tianjin Key Laboratory of Wireless Mobile Communications and Power Transmission for the support.
Funding
This work has been partly supported by National Natural Science Foundation of China (61701344), Tianjin Normal University Application Development Foundation (52XK1601), Tianjin Normal University Doctoral Foundation (52XB1603, 52XB1713) and Tianjin Higher Education Creative Team Funds Program in China.
Availability of data and materials
The datasets supporting the conclusions of this article are included within the article (and its additional file(s)).
Author’s contributions
YT conceived and designed the study. The author read and approved the final manuscript.
Author’s information
Ying Tong was born in Tianjin, China, in 1982. She received the B.S. and M.S. degree from Tianjin Normal University, the Ph. D degree from Tianjin University in 2004, 2007 and 2015 respectively. Since 2007, she has been working at Tianjin Normal University in China. She is a lecturer of Tianjin Key Laboratory of Wireless Mobile Communications and Power Transmission. Her research interests include computer vision and digital signal processing.
Competing interests
The author declares that she has no competing interests.
Publisher’s Note
Springer Nature remains neutral with regard to jurisdictional claims in published maps and institutional affiliations.
Received: 13 November 2018 Accepted: 11 January 2019
References
1. W. Wang, Y. Jiang, D. Wang, Through wall human detection based on stacked denoising autoencoder algorithm. J. Tianjin Normal Univ. (Natural Sci. Ed.)37(5), 50–54 (2017)
2. S.L. Ma, Y. Wang, Design and implementation of an ultra-wideband high-accuracy ranging system. J. Tianjin Normal Univ. (Natural Sci. Ed.)37(6), 55– 57 (2017)
3. J.C. Wu, C.C. Zeng, J.R. Sun, Research and application of wireless intelligent network monitoring smog system based on STM32F407. J. Tianjin Normal Univ. (Natural Sci. Ed.)37(6), 62–66 (2017)
4. Z. Liu, J. Chen, Y. Tong, et al., Research and implementation of digital baseband signal transmission. Journal of Tianjin Normal University (Natural Science Edition)38(1), 51–55 (2018)
5. M.Z. Shi, X.W. Gong, Parameters identification method via cepstrum analysis for mix blurred image restoration. J. Tianjin Normal Univ. (Natural Sci. Ed)
37(5), 60–65 (2017)
6. S.Y. Lee, D. Kim, C. Kim, Ramp distribution-based image enhancement techniques for infrared images. IEEE Signal Process. Lett.25(7), 931–935 (2018) 7. K. Kim, S. Kim, K.S. Kim, Effective image enhancement techniques for
fog-affected indoor and outdoor images. IET Image Process.12(4), 465–471 (2018)
8. L. Dong, Y. Bing, Y. Mei, et al., Image enhancement based on the nonsubsampled Contourlet transform and adaptive threshold. Acta Electron. Sin.36(3), 527–530 (2008)
9. L. Huang, W. Zhao, J. Wang, et al., Combination of contrast limited adaptive histogram equalisation and discrete wavelet transform for image enhancement. Image Process. IET9(10), 908–915 (2015)
10. Y. Tong, J. Chen, Nonlinear adaptive image enhancement in wireless sensor networks based on non-sub-sampled shearlet transform. EURASIP J. Wirel. Commun. Netw.2017(1), 46 (2017)
11. Y. Tong, J. Chen, Compressive sensing image fusion in heterogeneous sensor networks based on Shearlet and wavelet transform. EURASIP J. Wirel. Commun. Netw.2017(1), 52 (2017)
12. Y. Dong, T. Long, W. Jiao, et al., A novel image registration method based on phase correlation using low-rank matrix factorization with mixture of Gaussian. IEEE Trans. Geosci. Remote Sens. (Basel)56(1), 446–460 (2017) 13. J. Fan, Y. Wu, F. Wang, et al., SAR image registration using phase
congruency and nonlinear diffusion-based SIFT. IEEE Geosci. Remote Sens. Lett.12(3), 562–566 (2014)
14. S. Cakir, D.C. Kahraman, R. Cetin-Atalay, et al., Contrast enhancement of microscopy images using image phase information. IEEE Access2018(6), 3839–3850 (2018)
15. H. Asghari, B. Jalali, Edge detection in digital images using dispersive phase stretch transform. Int J Biomed Imaging2015, 687819 (2015)
16. M.A. Rahman, S. Liu, S.C.F. Lin, C.Y. Wong, G. Jiang, N. Kwok, Image contrast enhancement for brightness preservation based on dynamic stretching. Intl J. Image Proc.9(4), 241–253 (2015)
17. Z. Al-Ameen, Visibility enhancement for images captured in dusty weather via tuned tri-threshold fuzzy intensification operators. Int. J. Intelligent Syst Appl.8(8), 10–17 (2016)
18. F. Sattar, L. Floreby, G. Salomonsson, B. Lovstrom, et al., Image enhancement based on a nonlinear multiscale method. IEEE Trans. Image Process.6(6), 888–895 (1997)
19. B.S. Khehra, A.P.S. Pharwaha, Digital mammogram enhancement using Kapur measure of entropy and mathematical morphology. Biomed Eng. Appl. Basis Commun.25(3), 1350029 (2013)