International Journal of Research (IJR)
e-ISSN: 2348-6848, p- ISSN: 2348-795X Volume 2, Issue 05, May 2015Available at http://internationaljournalofresearch.org
Implementation of Mind Control Robot
Dipika Khatri
1, Divya Bharati
2, Neha
3,Piyali Biswas
4, Beulah Hemaltha
51,2,3,4 UG Student, Dept. Of Electronics and Communication Engineering, Bharath University ,India 5 Asst. professor, Dept. Of Electronics and Communication Engineering, Bharath University ,India
ABSTRACT
The goal of this project is to measure electric activity in the brain due to firing of these neurons, parse wave to obtain attention and meditation level of brain and use it to move a robot. There are different techniques available to detect electric activity in brain. One
technique is Electroencephalography
(EEG).EEG measures voltage fluctuation along the scalp that results from the interaction between the neurons in the brain. These voltage fluctuations are processed and output to a microcontroller by the EEG sensor. The data packets obtained from the EEG sensor are stored in microcontroller. The microcontroller uses different techniques to process and parse the data. The attention and meditation levels are obtained from the processed data. These levels are used to control the direction and motion of the robot. The EEG is used to on and off the robot and MEMS is used to control the robot.
KEYWORDS:
EEG(Electroencephalography);MEMS(Micro Electro Mechanical System); Robot; voltage fluctuation;sensor; brain ;neuron
I. INTRODUCTION
The mind control robot records and processes brain electrical activity. The motivational of this project decides in creating low cost product for medical applications including medical
instruments required for diagnosing
psychological disease and instrument for aiding paralyzed patients. This design can be implemented to control wheel chair by mind attention and meditation. This will aid people suffering from quadriplegia; in which person uses control over parts body below neck. The
attention and meditation level of the patient will then be used to control the motion and direction of wheelchair.
This technology can also help patients suffering
from psychological disease. Physicians
sometimes require monitoring mind activity in order to determine nature of the
disease. This involves patients to stay at hospital for a day which is expensive and sometimes not affordable. Patients can avoid staying at hospital by buying affordable Mind Activity Monitor. The Mind Activity Monitor can be implemented using the design of Mind Activity Monitoring System a subsystem of the Mind Control Robot. This Monitor will record the brain activity and will wirelessly transmit data to physician’s office.
The physician can interpret data received from Mind Activity Monitor and determine the nature of the disease. Sleep deprivation has become the focus of health and safety concern. The Mind Control Robot can be used to aid drivers and operators who must stay alert consistently for long periods of time. Drowsiness is a transition state between sleep and awakening during which a decrease in vigilance occurs . It is one of the main reasons behind thousands of crashes and injuries annually. This can be prevented by constantly processing operator’s or driver’s mind activity, extracting information pertaining to drowsiness and generating signal when drowsiness is detected. The Mind Control Robot involves obtaining brain electric activity. Research shows that different pattern of neural interactions in brain results in different brain states. These
interaction results in different patterns of waves among them following waves are the most important for determining attention and meditation :
International Journal of Research (IJR)
e-ISSN: 2348-6848, p- ISSN: 2348-795X Volume 2, Issue 05, May 2015Available at http://internationaljournalofresearch.org
2. Alpha Waves (frequency 8-13 Hz): These waves are associated with mediation and relaxation and
are present during wakeful relaxation.
3. Beta Waves (frequency 14-30 Hz): These waves are associated with active, busy or anxious thinking.
There are different techniques that can be used to obtain these waves. However the (EEG) technology was used in this project. The EEG provides non invasive technique of monitoring electric activity in space and time. The signal obtained from EEG sensor is one of the most reliable psychological indicators to measure the level of alertness. EEG sensor comprises of electrodes which make to scalp and forehead. The presence of hair hinders access to large portion of the scalp which result sin weak EEG signal. The quality of EEG signal can be affected by muscle movement and excessive environmental electrostatic noise. The signal obtained from EEG sensor is processed by a microcontroller. The microcontroller makes important decisions in determining the direction of motion of the robot. The motion of robot is supported by 3 wheels. Two of these wheels are driven by DC motors controlled by the microcontroller. The robot avoids obstacles by measuring distance of the nearest object close to robot in real time. It also detects and stops moving on the edge of surface it is moving on. The overall system involves both hardware and software implementations.
II. DESIGN CONSIDERED
There are multiple parts of this project. The main goal was to develop a robot with all of the aforementioned capabilities. The overall system design was divided into four interconnected subsystems as shown in fig 1. The four subsystems and there desired functions are:
1.Mind Activity Monitoring System: This system records electric activity in the brain using an EEG sensor. The main goal of this system is to perform signal processing on the raw signal obtained. This is achieved by filtering the original signal by passing through multiple band-pass filters. These filters then output Alpha, Beta and Theta waves. These waves are then input to an analog-to-digital
converter and are digitized. Further processing is performed on digital Alpha, Beta and Theta waves and the values of attention and meditation levels are extracted.The digitized EEG signal, Alpha, Beta and Theta waves along with attention and meditation level are arranged in discrete data packets. These packets are serially transferred to the Processing System.
2. Processing System: This system acts as the brain of the robot. It communicates with all other subsystems
and initializes them. The desired function of this system is to obtain digitized EEG signal including
attention and meditation level from Mind Activity Monitoring System and determine the direction and
motion of the robot. The motion and direction data is then output to Motion Control System. This system
verifies functionality of other systems on reset and notify user if there are any errors. This system is also
responsible for detecting any obstacles in the path of motion. It changes the direction of the robot if it
detects an edge of surface it is moving on or any obstacle in its path.
3. Motion Control System: This system is responsible to control the motion of the robot. The desired function of this system is to take digital information pertaining to robot motion and direction from the Processing System and move the robot accordingly.
4. User Interface (UI) System: The goal of this system is to provide essential functions to user to control the
operation of the Mind Control Robot. It displays mind attention or mediation level on an array of LEDs. User
can change the mode of operation using input peripherals of the UI system. This system informs the
International Journal of Research (IJR)
e-ISSN: 2348-6848, p- ISSN: 2348-795X Volume 2, Issue 05, May 2015Available at http://internationaljournalofresearch.org
also cost-effective. The components of each subsystem and their functions are:
A. EEG Sensor
This component is essential part of Mind Activity Monitoring System. Traditional EEG sensors are expensive and their use is only limited to hospitals and laboratories. The electrodes of traditional EEG sensors require using conductive gel to facilitate reading of the signals. For this project portable EEG brainwave headset from NeuroSky was used. NeuroSky, Inc. is a manufacturer of Brain-Computer Interface (BCI) technologies for consumer product applications . Neurosky’s Hardware uses a dry active sensor technology to read brain signals. This doesn’t require conductive gel on the skin in order to record brain electric activity. For this reasons, headset based on Neurosky technology are cost-effective and easy to handle. Neurosky offers three headsets for recording brain signals: MindSet, MindWave and MindPlay Band. These three headsets were compared in order to determine suitable headset for this project. The major difference between these three headsets is that MindWave uses RF transmitter and receiver to transmit EEG signal while other two use Bluetooth. The NeuroSky’s Mindwave is cost effective and was chosen for Mind Activity Monitor System.
Figure 1 Interconnected Subsystems The Mind Wave headset sends EEG signal to a RF USB adapter. The on board Think Gear IC process raw signal, filters the noise and digitizes the signal
using above mentioned algorithm. The RF USB dongle is made for use with computer applications provided by Neuro Sky. The data signals of the RF USB dongle are connected to Processing System for further processing.
B. Microcontroller
The microcontroller is the most important component of the Processing System. There are many microcontroller available that can be used for this subsystem. For this project Arduino
Uno was chosen. Arduino Uno is
microcontroller board based on ATMEGA328 [5]. It provides 14 digital I/O pins and 6 analog I/O pins which are sufficient for this project. The Arduino Uno operates at 16 MHz.
At reset, Arduino initializes all other subsystems. The Arduino takes digital data from USB dongle and store it in an array for further processing. The firmware then takes these data packets and parses them to obtain mind attention and meditation level. This approach is further explained in software section. The Arduino determines the status of the robot and computes the direction of the motion. This information is stored in digital packets.The Arduino outputs these packets to User Interface (UI) subsystem and Motion Control subsystem.
C. H-Bridge
The H-bridge was used to drive DC motors. It provides bidirection drive currents up to 1 A enabling motor to turn in either direction. For this project H-bridge IC manufactured by Texas Instruments was used. The H-bridge takes digital dat from Arduino and drives the DC motor accordingly. The Arduino outputs two data signals for each DC motor and one control signal to enable the IC. The functions of these signals are shown in table 1.
EN
LA
2A
Function
H L H Turn Right
H
H
L
Turn Left
H
L
L
Fast motor stop
H
H
H
Fast motor stop
L X X Fast motor stop
International Journal of Research (IJR)
e-ISSN: 2348-6848, p- ISSN: 2348-795X Volume 2, Issue 05, May 2015Available at http://internationaljournalofresearch.org
H = High, L = Low, X = Don't Care D. DC Motor
The robot was moved using two DC motors. These DC motors are attached with the front wheels of the robot. The H bridge supplies required drive current to DC motor.
E. SIP Resistor Network
The resistor network was connected between LED Bar-Graph and the input of User Interface (UI) subsystem as
shown in fig. 2. These resistors limit current through LEDs and save them from burning out.
Figure 2 LED Bar-Graph and SIP Resistor Network
F. LED Bar-Graph
The LED Bar-Graph is used to display mind attention or mediation level. The first 5 LEDs represents mind attention or mediation level in real time. The remaining LEDs are reserved to notify user about any error occur in the system including failure of subsystems.
G. Dual in-line (DIP) switches
Two Dual in-line (DIP) switches were used to determine the mode of operation. These two switches represent two binary bits. Two bits provide 4 different binary numbers from
0 to 4. Each binary number is associated with different mode of operation. The modes of operation corresponding to the states of two DIP switches are listed in Table 2.
DIP Switch 1
DIP Switch 2
Mode
OFF OFF Diagnostic Mode
OFF ON Attention Mode
ON OFF Meditation Mode
ON ON Reserved for future use Table 2 Modes of Operation
H. Buzzer
A buzzer is used to alert user regarding the motion of Robot. It sounds before making turn or changing the direction of motion. It also notifies user when all subsystems pass or fail Power on Self Tests (POSTs).
I. Ultransonic Distance Measuering Sensor The ultrasonic distance measuring sensor is used to detect any obstacles in the path of robot. This sensor provides precise, non-contact distance measurements within 2 cm to 3m
range. This sensor outputs distance
measurements once every second to Arduino. The Arduino stops and turns the robot if the distance of near
J. Infrared (IR) Line Sensor
This sensor is used to detect edge of the surface the robot is moving on. This sensor relies on the reflected wave in order to determine the edge. It notifies the processing unit by generating an interrupt. The Interrupt Service Routine (IRS) stops and turns the robot in order to avoid falling.
K. Software
The Arduino Integrated Development
Environment (IDE) was used to program Arduino. This IDE is a cross-platform application written in Java and is derived from the IDE for the processing programming language . A program written for Arduino is called Sketch.
Code
Byte length
Data value meaning
0xD0 1 Headset connected
0xD1
1
Headset not found
0x02 1 Poor signal quality 0-255
0x04 1 Attention level 0-100
0x05 1 Meditation level 0-100
0x07
1
8-bit raw value
Table 3 NeuroSky's Code Packets
The firmware developed for this project allows
International Journal of Research (IJR)
e-ISSN: 2348-6848, p- ISSN: 2348-795X Volume 2, Issue 05, May 2015Available at http://internationaljournalofresearch.org
subsystems. This firmware stores and parses EEG data to obtain mind attention or meditation level.
These levels are further scaled to display on LED Bar-Graph. The firmware also reports any error it encounters during execution.
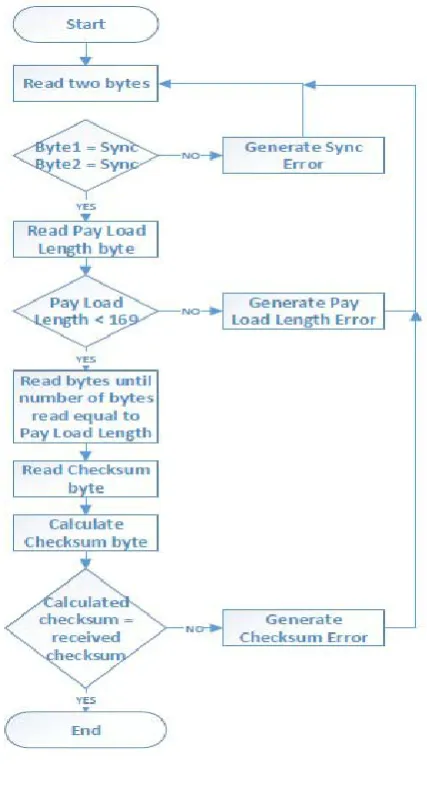
The Mind Activity Monitoring subsystem serially transfers EEG signal in the form of packets one byte long. The Processing System start accepting data if it receive two consecutive Sync bytes (0xAA) representing start of data cycle. The data is further validated by reading next byte which is the pay load length and verifying if it is less than 169. The processing unit then reads the data until number of bytes read equals to pay load length and store these packets in an array. At the end of data stream the Mind Activity Monitoring System sends checksum packet one byte long in order to validate the previous packets sent. The checksum is also
calculated from the packets of data received by adding each packet and taking complement of most significant byte. The data is parsed when the checksum received matches the
calculated checksum. The read cycle is shown in fig. 3. After validation, the data is parsed by checking each byte in an array. Some packets are defined in Neuro Sky standard as well as the type of data following them. The code packets related to this project and their data value length are listed in table 3. The attention and mediation value ranges from 0 to 100 with 0 being strongly reduce attention or meditation level and 100 being elevated level. The firmware takes this value and scales it down on the scale of 1 to 5. This makes it convenient to display attention and meditation level on LED Bar-Graph. The Mind Activity Monitoring System notifies the quality of EEG signal by sending Poor Signal Quality packet to the processing System. Any non-zero value of this packet indicates presence of noise. Some noise in the EEG signal is unavoidable and is caused due to excessive motion of the wearer and also due to excessive electric noise. A value of 200 indicates that the electrodes are not contacting person’s skin. The mind attention or mediation level is used to determine the direction of motion of the robot. The attention and meditation levels are divided into 5 sub-levels. Each sub-level is indicated on Bar-Graph by turning the corresponding LED on. Level 1 is
represented by single LED while level 5 is represented by turning all 5 LEDs on. The sub-levels and robot motion associated with them is listed in table 4.
Level
Number of LED(s)
Direction of motion Strongly
reduced 1 Backward
Reduced 2 Backward
Neutral 3 Stop moving Slightly
Elevated
4 Forward
Elevated 5 Forward
Table 4 Attention and Meditation Sub-levels
Figure 3 Read Cycle
International Journal of Research (IJR)
e-ISSN: 2348-6848, p- ISSN: 2348-795X Volume 2, Issue 05, May 2015Available at http://internationaljournalofresearch.org
III. FINAL DESIGN
The final design of mind control robot includes all aforementioned components. All subsystems discussed above
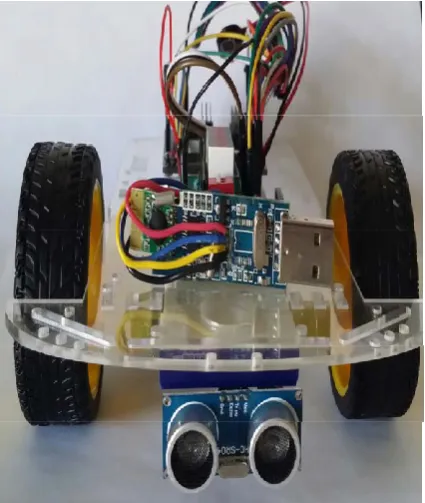
were assembled and tested separately. At reset, the Mind Control Robot, shown in Figure 4, blinks all LEDs and plays welcome message on the buzzer. The Mind Control Robot operates in three different modes. In mode 0, it tests all the subsystems. If the robot operates in mode 1, it displays an moves according to attention level, while in mode 2 it displays and moves according to meditation level. The mode is determined by dual in-line package (DIP) switch. After initialization the robot checks the distance from the obstacles and determines if there is any risk of collision. The processing unit then communicates with Mind Activity Monitor System, obtains mind attention and mediation level and scales them down to move and display on LED Bar-Graph. The Arduino IDE provides serial monitor which can be used to verify overall functionality of the system. The serial monitor in this project is set to display distance and mind attention or mediation level, as shown in fig. 5. These values are also helpful when verifying the functionality of LED Bar-Graph.
Figure 4 Mind Control Robot IV. CONCLUSION
The design of the overall system for mind control robot is divided into small subsystems that were
designed and tested independently using computer models of the other subsystems. The computer model generates stimulus input values to the subsystem under test. The presented system records electric activity of the brain and the robot moves according to mind attention or mediation level depending on the mode of operation.
V. ACKNOWLEDGMENTS
The authors would like to thank Professor karthick sir and guide hemaltha Beulah ,from the department of Electronics and communication Engineering at Bharath university at Chennai for helping with the publication of this paper.
References
[1] M.M. Jackson and R Mappus, “Applications for brain-computer interfaces,”
Brain-Computer Interfaces. Springer London,
pp. 89-103., 2010.
[2] E. Jeong, B. Moon and Y. Lee, “A Platform for Real Time Brain-Waves Analysis System. In Grid and Distributed Computing”, Springer Heidelberg, vol. 261. pp. 431 –437, 2011.
[3] S.K.L. Lal and A. Craig. “A critical review of the psychophysiology of driver fatigue”,
Biological Psychology, vol. 55, pp. 173 –
194,2001.
[4] "Uncle Milton and NeuroSky Announce Exclusive Partnership for Science Toys.".
Journal of Technology. 2009-07-28. Retrieved
2010-07-31.
[5] Adruino Uno,
http://arduino.cc/en/Main/arduinoBoardUno.
[6] Arduino Development Environment, arduino.cc/en/guide/Environment
International Journal of Research (IJR)
e-ISSN: 2348-6848, p- ISSN: 2348-795X Volume 2, Issue 05, May 2015Available at http://internationaljournalofresearch.org
Author Biblography
Dipika Khatri
Pursuing bachelor of technology in electronics & communication engineering from Bharath University, Chennai, India Email:[email protected]
Divya Bharti
Pursuing bachelor of technology in electronics & communication engineering from Bharath University, Chennai, India
Email:[email protected]
Neha
Pursuing bachelor of technology in electronics & communication engineering from Bharath University, Chennai, India Email:[email protected]
Piyali Biswas