Power Quality Analysis of a Grid Connected
PV System
S.Hemapriyadarshini1, S.Shobana2, P.Manikandan3, K.Anand4
Student, M.E (Power electronics and drives), Prathyusha Engineering College Aranvoyalkuppam Tiruvallur,
Tamilnadu, India
Associate Professor, Dept. of EEE, Prathyusha Engineering College Aranvoyalkuppam Tiruvallur, Tamilnadu, India
Assistant Professor, Dept. of EEE, Prathyusha Engineering College Aranvoyalkuppam Tiruvallur, Tamilnadu, India
Assistant Professor, Dept. of EEE, Prathyusha Engineering College Aranvoyalkuppam Tiruvallur, Tamilnadu, India
ABSTRACT Wherever a power grid is not or not at reasonable costs available, a stand-alonephotovoltaic system can be used to generate the needed electric energy. Power utilities in many countries around the world are diverting their attention toward more energy-efficient and renewable electric power sources. Photovoltaic (PV) energy systems are becoming more and more popular among all renewable energy sources. Proper control algorithm is required to operate PV system for residential applications. Because nature of solar irradiance and load are rapidly change. Good voltage quality should maintain in residential applications. In this paper proposed PV system for residential applications and maintained good power quality at AC bus with proper control and energy management.
I. INTRODUCTION
A sensitivity analysis is performed in order to investigate the influence of the Total Harmonic Distortion, Inverter Short Circuit Current Ratio, Inverter Nominal Power Ratio, Inverter Nominal Current Ratio on the power quality indices. The indicate that the compliance of the aforementioned power quality indices with the demanded limitations depends on the appropriate selection of the system parameters values; these values are optimally selected by using an appropriate methodology, based on an artificial intelligence technique (i.e. a genetic algorithm). However, some power quality indices may still exceed their predetermined limits, due to the fact that the optimal values of the system parameters are not always attainable (for practical reasons). It is noted that even if the optimal parameters values are attainable these are about to alter in real life operation, being subjected to various operational and environmental factors such as voltage and current stresses, environmental conditions etc.
II. SYSTEM ANALYSIS
Fig 1: Block diagram of system model
Data acquisition
Data acquisition begins with the physical phenomenon or physical property to be measured. Examples of this include temperature, light intensity, gas pressure, fluid flow, and force. Regardless of the type of physical property to be measured, the physical state that is to be measured must first be transformed into a unified form that can be sampled by a data acquisition system. The task of performing such transformations falls on devices called sensors.
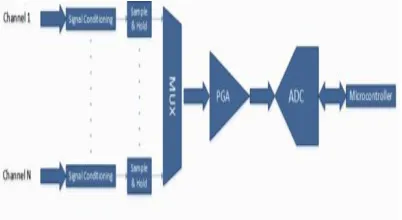
Fig 2: Block diagram of a non simultaneous acquisition system
A data acquisition system is a collection of software and hardware that allows one to measure or control physical characteristics of something in the real world. A complete data acquisition system consists of DAQ hardware, sensors and actuators, signal conditioning hardware, and a computer running DAQ software.
Signal conditioning
Signal conditioning is a process of data acquisition, and an instrument called a signal conditioner is used to perform this process. This instrument converts one type of electrical or mechanical signal (input-signal) into another (output-signal). The purpose is to amplify and convert this signal into an easy to read and compatible form for data-acquisition or machine-control.
A signal conditioner helps to provide precise measurements, which are essential for accurate data acquisition and machine-control. These instruments can perform an additional number of different functions
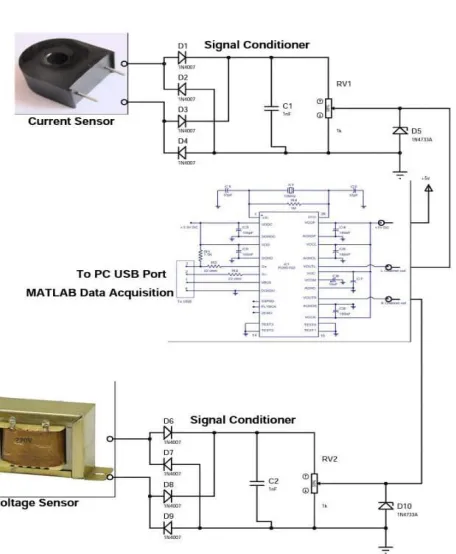
Fig 4: Circuit setup of system under study
Current sensor
There are two primary types of current sensors, direct and indirect sensors. The direct sensor applies Ohms Law and Halls Effect. It has an integrated coil. By placing the coil around a current-carrying conductor, there in an induced voltage, which is proportional to the current in the system. By using various amplifiers such as shunt and operational amplifiers, as well as a user-friendly interface, it is then easy to detect and measure the current in the system.
Voltage sensor
The voltage sensor is able to measure the presence of a voltage without making metal contact i.e. on insulated wires. A voltage sensor consists of a resistive voltage divider.
The integrated resistors, embedded in a casted resin (for voltages between 1-72kV), have a low value inductance. The arrangement, mostly in a zigzag arrangement, together with the resin permittivity, results to a capacitance. This capacitance is more than any capacitance straying to the ground.
Electric principles dictate that the smaller the capacitor, the larger the voltage. Thus, when you hold the voltage sensor in your hands, and place the tip near a live conductor, you create high impedance on the tip, thus forming a capacively-coupled series circuit. The circuit is complete through you, the ground, and back to the circuit. Thus, the voltage detector sensor tip is a small capacitor that is capacively-coupled to a live voltage.
III. SYSTEM ANALYSIS DISCRETE WAVELET TRANSFORM
The Discrete Wavelet Transform (DWT) became a very versatile signal processing tool after Mallat proposed the multi‐ resolution representation of signals based on wavelet decomposition. Wavelets allow both time and frequency analysis of signals simultaneously because of the fact that the energy of wavelets is concentrated in time and still possesses the wave‐ like (periodic) characteristics. As a result, wavelet representation provides a versatile mathematical tool to analyze transient, time‐ variant (non‐ stationary) signals that are not statistically predictable especially at the region of discontinuities – a feature that is typical of images having discontinuities at the edges. The DWT decomposes a digital signal into different sub bands so that the lower frequency sub bands have finer frequency resolution and coarser time resolution compared to the higher frequency sub bands.
IDWT
The method takes advantage of the large number of zero coefficients after quantization. A bit map of the wavelet coefficients is used to test for streams of zero coefficients and inverse transform filtering is omitted for these coefficients. The zero testing algorithm is a tree-like search operation. Information on the statistics of the wavelet transform coefficients of a few typical images, together with estimates of the cost of testing and the cost of filtering, are used to obtain optimal sizes of the root and leaves of the search tree. Results show that our algorithm is faster than the baseline inverse wavelet transform algorithm by about 20% to 50% for PSNRs in the range 35 dB to 29 dB
Distributed Signal
A personal view of distributed or collaborative signal processing will be provided starting with the definition of fundamental concepts such as consensus, diffusion, accelerated consensus and node specific learning. A motivational example will also be given and a methodology for addressing the bearing estimation problem in a distributed network will be outlined.
PQ Analysis
An analysis is done over say several months of the demand for different products from a plant. Products are sometimes classed into runners, repeaters and strangers. This information helps design the production method to suit the product e.g. high volume lower value routine production on a flow line, versus occasional low volume high value manufacture which can be done in a job shop.
IV. EXPERIMENTAL RESULT
of the part. The cascade algorithm of the wavelet transform can be implemented in a straightforward manner and with a high computational efficiency.
Fig 5: Discrete wavelet algorithm for sound analysis
Fig 6: Decomposed signal
BAND SEPARATION
Linear-assisted switching power amplifiers are based on combinations of switching converters (for high efficiency) and linear amplifiers (for high-speed, wide bandwidth responses) in applications such as envelope tracking for RF power amplifiers in polar modulation architectures, or audio amplifiers. This paper describes an approach to band separation and filter design to maximize the system efficiency and achieve near-ideal, wide-bandwidth responses. An experimental prototype is described, including a synchronous buck converter in combination with a class-AB linear amplifier. Experimental results for square wave and rectified sinusoid input signals demonstrate high bandwidth and high efficiency of the linear-assisted switching power amplifiers with optimized band separation.
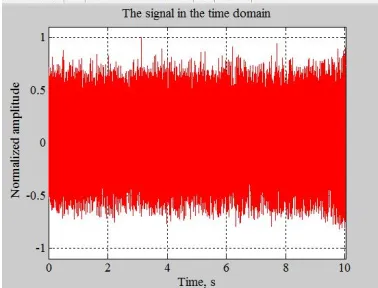
Fig 8: Signal in time domain
The beat detection algorithm is based on detecting the most salient periodicities of the signal. The signal is first decomposed into a number of octave frequency bands using the DWT. After that the time domain amplitude envelope of each band is extracted separately. This is achieved by low pass filtering each band, applying full wave rectification and downsampling. The envelopes of each band are then summed together and an autocorrelation function is computed. The peaks of the autocorrelation function correspond to the various periodicities of the signal‟s envelope. More specifically the following stages are performed:
1. LPF Low pass filtering of the signal with a One Pole filter with alpha value 0.99 give by the equation
3. DOWNSAMPLING
1. NORM Normalization in each band (mean removal) :
2. ACRL Autocorrelation given by the equation:
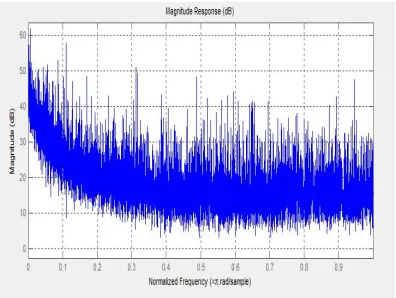
Fig 9: Spectrogram of signal
The spectrogram view of an audio track provides a visual indication of how the energy in different frequency bands changes over times. The spectrogram can show sudden onset of a sound, so it can often be easier to see clicks and other glitches or to line up beats in this view rather than in one of the wave form views.
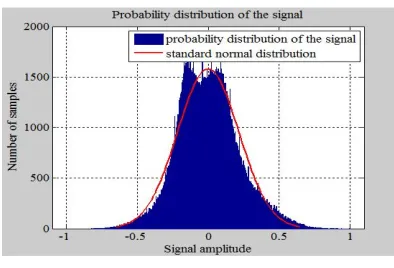
Fig 11: Probability distribution and normal distribution signals
Fig 12: Autocorrelation
The analysis of autocorrelation is a mathematical tool for finding repeating patterns, such as the presence of a
periodicsignal obscured by noise, or identifyingthe missing fundamental frequency in a signal implied by its harmonic
frequencies.
IV. CONCLUTION
This paper presents an integrated tool for the analysis of power quality issues on board a ship. The analysis is performed through the integration of a Matlab-based tool for the definition of power quality indices and a simulation platform for system analysis called Virtual Test Bed. The analysis of the power system on board a ship, particularly if we focus on an All-Electric Ship, cannot be conducted with traditional tools.
The integrated solution here proposed allows the combination of the Following features for power quality evaluation: -
1 Sophisticated signal processing through custom Matlab programs 2 Sophisticated system simulation through VTB schematics PI. - - 3 Advanced 3D visualization
The most relevant disturbances in electrical power systems can be detected, localized and estimated automatically, also in noisy environment. The disturbance classification can be done by using less parameter compared to other methods.
REFERENCES
1. J. Philip et al., „„Control and implementation of a standalone solar photovoltaic hybrid system,‟‟ IEEE Trans. Ind. Appl., vol. 52, no. 4, pp. 3472–3479, Jul./Aug. 2016.
2. R. A. Shayani and M. A. G. de Oliveira,
„„A new index for absolute comparison of standalone photovoltaic systems installed at different locations,‟‟ IEEE Trans. Sustain. Energy, vol. 2, no. 4, pp. 495– 500, Oct. 2011.
3. S. S. Lee, B. Chu, N. R. N. Idris, H. H. Goh, and Y. E. Heng, „„Switchedbattery boost-multilevel inverter with GA optimized SHEPWM for standalone application,‟‟ IEEE Trans. Ind. Electron., vol. 63, no. 4, pp. 2133–2142, Apr. 2016.
3. R.-J. Wai, W.-H. Wang, and C.-Y. Lin, „„High-performance stand-alone photovoltaic generation system,‟‟ IEEE Trans. Ind. Electron., vol. 55, no. 1, pp. 240–250, Jan. 2008.
4. J. T. Bialasiewicz, „„Renewable energy systems with photovoltaic power generators: Operation and modelling,‟‟ IEEE Trans. Ind. Electron., vol. 55, no. 7, pp. 2752–2758, Jul. 2008.
5. 1.Pedro A. B. Block, Henry L. L. Salamanca, Mateus D. Teixeira, Diogo B. Dahlke, Otavio M. ShionoLACTEC Curitiba, Brazil Antônio R. Donadon João C. Camargo “Power Quality Analyses of a Large Scale Photovoltaic System” The fifth International Renewable Energy Congress IREC, 2014
6. Ms. Sindhu. S, Dr. M.R. Sindhu Dr. T. N. P Nambiar 2016 IEEE, “Implementation of Photovoltaic Integrated Unified Power ConditionerforPowerQuality Enhancement”.
7. Moumita Das, Student Member, IEEE and Vivek Agarwal, Fellow, IEEE@2016 “Design and Analysis of a High Efficiency DCDC Converter with Soft Switching Capability for Renewable Energy Applications Requiring High Voltage Gain”