Structural Elucidation of Condensed Tannin from
Picea mariana Bark
Papa Niokhor Diouf1,2, Carmen Mihaela Tibirna3, Martha-Estrella García-Pérez2,4,5, Mariana Royer2,5, Pascal Dubé5, Tatjana Stevanovic2,5*
1Service de Recherche et d’Expertise en Transformation des Produits Forestiers (SEREX), Amqui, Canada; 2Centre de Recherche sur le Bois, Faculté de Foresterie, de Géographie et de Géomatique, Université Laval, Québec City, Canada; 3Département de Génie Chimique, Faculté des Sciences et de Génie, Université Laval, Québec City, Canada; 4Faculté de Pharmacie, Université Laval, Québec City, Canada; 5Institut des Nutraceutiques et des Aliments Fonctionnels, Université Laval, Québec City, Canada.
Email: *[email protected]
Received April 24th,2013; revised May 26th, 2013; accepted June 3rd, 2013
Copyright © 2013 Papa Niokhor Diouf et al. This is an open access article distributed under the Creative Commons Attribution Li- cense, which permits unrestricted use, distribution, and reproduction in any medium, provided the original work is properly cited.
ABSTRACT
The aim of this work was to determine the structural characteristics of the condensed tannins isolated from the aqueous extract of black spruce (Picea mariana Mill) bark. This is the first report on the structural characterization of condensed
tannins from black spruce bark. The condensed tannins from the hot water extract prepared from Picea mariana bark
were isolated by column chromatography on Sephadex LH-20 media. In this study, UV-visible and 13C-NMR spectro-
scopic techniques, along with pyrolysis-gas chromatography/mass spectrometry (Py-GC/MS) and liquid chromatogram- phy analyses were applied to determine the structural characteristics of black spruce bark tannins. We have confirmed for the first time the presence of methoxylated B-rings in the flavanol units of condensed tannins from black spruce bark, which could be regarded as further contribution to the chemotaxonomy of the genus Picea. The methoxylation of Nor-
way spruce bark condensed tannins have been demonstrated previously.
Keywords:Picea mariana Bark; Condensed Tannins; Proanthocyanidins; Polyphenols; Structural Characterization
1. Introduction
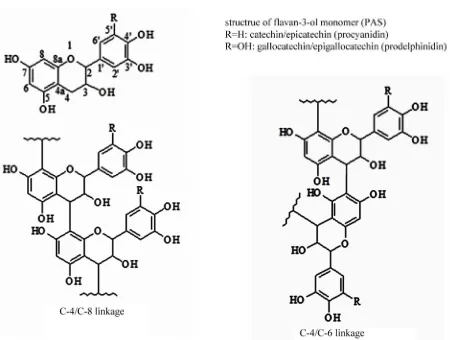
In the wood industry, large amounts of bark waste are produced. This waste material is mostly used in energy production and is burned in large furnaces. However, barks of several tree species are known to contain bioac- tive chemicals, such as the proanthocyanidins, which are also known as condensed tanins and belong to the group of polymer polyphenols. The isolation and utilization of various polyphenols from bark, including polymer proanthocyanidins, could add value to the transformation of bark presently used solely as energy resource. Proan- thocyanidins (PAs) can be classified as oligomers (dimers to pentamers) and polymers (hexamers and higher, known also as condensed tannins, CT) of flavan-3-ol monomer units most frequently linked through either C4/C6 or C4/C8 C-C bonds (Figure 1). The most com- mon classes are procyanidins consisting of catechin, epi- catechin and/or their galloylated derivatives, and prodel-
phinidins consisting of gallocatechin, epigallocatechin and/or their galloylated derivatives. The bark of the black spruce was the subject of various researches in the sec- ond half of the 20th century. Phytochemical researches concerned particularly the low-molecular-weight extrac- tives [1] which left a field of study on polymers open to exploration. Anderson and Pigman [2] found 1.9% and 7.6% of tannins respectively in the external and the in- ternal black spruce bark. Pigman et al. [3] found 2.5% of
leucoanthocyanidins in the internal bark of black spruce. Proanthocyanidins (PAs) are considered as functional ingredients in botanical, nutritional supplements and therefore they are presently attracting more attention. Previous studies on PAs-rich fraction obtained from the hot water extract of Picea mariana bark have demon-
Figure 1. Chemical structure of flavan-3-ol monomer units and proanthocyanidins.
analytical methods [6-12] have been proposed or are currently developed and employed for quantification and separation of PA compounds: NMR analysis, mass spec- trometry-fast-atom bombardment (FAB), electrospray ionization (ESI), liquid secondary ion (LSI), matrix as- sisted laser desorption/ionization time-of-flight (MALDI- TOF)), size-exclusion chromatography (SEC), normal phase and counter-current chromatography etc. All these methods are potentially useful for condensed tannins characterization and they have practical advantages but also disadvantages. A combination of these techniques is particularly well suited for improving the accuracy of the analysis of PAs extracted from various plant sources. This work is the first report on the characterization of condensed tannins (proanthocyanidin polymers) isolated from hot water extracts of Picea mariana Mill. bark and
it was performed by application of combination of fol- lowing methods: pyrolysis-gas chromatography/mass spec- trometry (Py-GC/MS), carbon nuclear magnetic reso- nance (13C-NMR) spectroscopy, UV visible spectropho-
tometry and high performance liquid chromatography coupled with fluorimetric (FL) and electrospray ioniza- tion mass spectrometric detection, (HPLC-FL-MS) and (HPL-FL ESI/MS).
2. Material and Methods
2.1. Materials
HPLC-grade methanol (MeOH), ACS-grade dichloro- methane, ACS-grade 1-butanol, ACS-grade hydrochloric acid, ACS-grade acetone and resublimed-grade catechol were purchased from Fisher Scientific. (+)-Catechin hy- drate (min. 98%), (−)-epigallocatechin and (−)-gallocate- chin (>98% HPLC), pyrogallol were obtained from Sigma. (−)-Epicatechin was purchased from BioChemika (>90% HPLC). Guaiacol (Practical grade) was obtained
from Eastman. Lipophilic Sephadex LH-20 powder was obtained from Sigma-Aldrich. Acetone-d6 (99.9 atom %D) from Aldrich, deuterium oxide (99.9 atom %D) from CDN Isotopes, phenol (99.9% Crystals) from Mal- linckrodt, resorcinol (98%) from Acros, ACS-grade ferric ammonium sulphate from Laboratoire Mat and Nanopure Diamond water were used. The bark of black spruce (Picea mariana Mill.) was supplied by the sawmill Péri-
bonka and by the Québec Chambord OSB sector, local- ised in Saguenay-Lac-Saint-Jean region, Québec, Canada. Bark was milled and successively sieved to select parti- cles between 40 - 60 mesh before being stored at −4˚C in darkness.
2.2. Condensed Tannins (CT) Preparative Isolation
Five grams of ground material were first extracted with 50 ml of water under reflux for 1 h and solids were sepa- rated by filtration with a 100 ml Gooch crucible (PY- REX, 40 - 60 m, coarse porosity) and washed with 50 ml of hot water (crude extract yield: 9.96% ± 0.08%). The filtrate was collected and liquid-liquid extracted with dichloromethane (3 times with 100 ml) to further remove lipophilic compounds. The water phase was collected and 50 ml of it were mixed with Sephadex LH-20 pow- der (10 g), stirred for 3 min, stored overnight at 4˚C and then filtered through a 500 ml funnel with a 100 ml Gooch crucible (PYREX, 40 - 60 m, coarse porosity) at normal pressure. Non-tannin phenolics were separated from the gel by eluting them first with water until ab- sorbance of eluent at 280 was close to zero nm and sub- sequently with 50% (v/v) aqueous methanol until ab- sorbance at 280 nm was close to zero. PAs were then recovered from the gel by eluting with 70% (v/v) aque- ous acetone at normal pressure until absorbance at 280 nm was close to zero. The acetone was removed from the tannin extract by rotary evaporation and the purified CT were freeze-dried and stored at −20˚C in the dark. The purified CT was used for the structural characterization by UV-visible spectrophotometry, 13C-NMR, Py-GC/MS
and HPLC-FL ESI/MS.
2.3. UV-Visible Spectrophotometry
The anthocyanidin formation in a hydrochloric medium with ferric ammonium sulfate as a catalyst was per- formed as described by Porter et al. [13]. 500 μl of CT at
1 mg/ml in MeOH/H2O (1/1, v/v) was added to a PTFE
model Cary 50.
2.4. 13C-NMR Analysis
General structural information on proanthocyanidins of black spruce bark was obtained by 13C-NMR analysis [14,
15] of 65 mg of the purified CT dissolved in 1 ml of D2O/acetone-d6 (1:1) mixture. Spectra were obtained at
75.47 MHz on a Bruker 300 MHz spectrometer, using a 5 mm sample tube, and 2 s relaxation delay. All experi- ments were conducted at ambient temperature and were carried out by recording 12,000 scans. Recorded NMR spectra were processed after Fourier transformation, phase and baseline correction. The chemical shifts were reported relative to tetramethylsilane (0 ppm), using he acetone peak at 30.7 ppm as a secondary standard.
2.5. Pyrolysis-Gas Chromatography/Mass Spectrometry (Py-GC/MS) Analysis
Py-GC/MS analysis of the condensed tannins from black spruce bark was performed by a slightly modified ver- sion of the one described by Ohara et al. [16]. Samples
(100 - 400 μg) were pyrolyzed at 500˚C for 4 s using a Curie point pyrolyzer (Pyroprobe 2000 CDS Analytical Inc.). The pyrolyzer was interfaced (interface tempera- ture 250˚C) with a GC/MS system consisting of a Varian CP 3800 gas chromatograph coupled to a Varian 2200 MS/MS mass spectrometer operating under the following conditions: injector (split 1/50) at 250˚C; Varian Factor- Four Capilary Column VF-5ms (30 m × 0.25 mm i.d., film thickness 0.25 μm) programmed from 50˚C to 300˚C at 5˚C/min, holding the initial temperature for 1 min; interface line at 300˚C, electron impact mass spectra recorded at 70 eV. Helium was used as the carrier gas with a flow of 1 ml/min. Peak identification was made by comparison of retention time and mass spectrum with standards, and their amounts were calculated from the calibration curves determined using authentic samples.
2.6. High Performance Liquid Chromatography Coupled with Fluorimetric and Electrospray Ionization Mass Spectrometric Detection (HPLC-FL ESI/MS)
0.5 g of sample was solubilized in 5 mL of acetone:wa- ter:acetic acid (70:29.5:0.5) and injected. HPLC-FL ESI/ MS analyses were carried out using an ACQUITY H- Class Ultra Performance LC system (Waters, Milford, MA, USA) linked simultaneously to a Acquity Fluores- cence (FL) detector (Waters, Milford, MA, USA) and a TQD benchtop triple quadrupole mass spectrometer (Waters MS Technologies, Manchester, UK), equipped with a Z-spray electrospray ionisation (ESI) source oper- ating in negative mode. MassLynx software version 4.1
(Waters, Milford, MA, USA) was used to control the instruments, and for data acquisition and processing. A slightly modified method to that described in the litera- ture by Robbins et al. [17] was applied. The HPLC col-
umn used was the Develosil Diol 100 Å (250 × 4.6 mm, 5 m particle size) purchased from Phenomenex (Tor- rance, CA, USA). A cyano (4 × 3.0 mm) SecurityGuard cartridge was obtained from Phenomenex (Torrance, CA) and employed to protect the column. The chroma- tographic mobile phase was a binary gradient (solvents A and B) and consisted of an acidic acetonitrile ((A), CH3CN:HOAc, 98:2; v/v) and acidic aqueous methanol
((B), CH3OH:H2O:HOAc, 95:3:2; v/v/v). The starting
mobile phase condition was 7% B and was held, is- ocratically, for 3 min. Subsequently, solvent B was in- creased to 40% over 38 min and then to 100% B over the next 3 min. The conditions were held at 100% B for 7 min prior to returning to 7% B (starting condition) over 6 min. Post run time was 6 min for a total run time of 60 min. The fluorescence detection was conducted with an excitation wavelength of 276 nm and an emission wave-length of 316 nm. Other FLD conditions included a gain gradient. For the samples and conditions described herein, the gain was set to 1 from 0 to 8 min, and then set to 4 from 8.1 to 60 min. The column temperature was held at 35˚C throughout the run. The flow rate was 0.8 ml/min and the injection volume was 10 μl. The autosampler was set to and held at 10˚C. The effluent from the HPLC was introduced into the FL detector and into the electrospray source in a 50:50; v/v ratio. The source block tempera- ture was set at 100˚C, desolvation temperature at 350˚C, capillary voltage at 3.1 kV, cone voltage at 200 V and nitrogen as desolvation gas (650 L/h).
3. Results and Discussion
3.1. UV-Visible Spectrophotometric Evidence of Proanthocyanidins by Bate-Smith Reaction
Condensed tannins were highlighted and quantified by acid butanol assay following the procedure described by Porter et al. [13]. Treated by HCl in alcoholic medium,
cate chin and gallocatechin, while the 2,3-cis configura- tion is found for epicatechin and epigallocatechin [18]. In butanol acid medium, PC and PD respecti vely yield cyanidins and delphinidins, for which absorption peak maxima vary between 547 (max for cyanidins) and 558 nm (max for delphinidins). Hussein et al. [19] sug-
gested that the variation of absorption peak maxima be- tween 540 and 550 nm is due to the relative amounts of anthocyanidins (ratio delphinidin/cyandin). A maximum at 549 nm, observed in CT spectrum obtained in our re- search, indicates that the condensed tannins from black spruce bark are mainly PC rather than PD.
3.2. 13C-NMR Analysis
The chemical characterization of the purified CT ex- tracted from black spruce bark was initiated by 13C-NMR
analysis, mainly with an aim to determine their degree of polymerization. An example of the liquid-state 13C-NMR
[image:4.595.57.287.361.508.2] [image:4.595.59.287.550.707.2]spectrum of the purified tannins extracted from black spruce bark with the peaks assignments is depicted in Figure 3. Inspection of this spectrum and comparison
Figure 2. Visible spectrum of PAs from black spruce bark after Bath-Smith reaction.
Figure 3. Room temperature 13C-NMR spectrum of CT from black spruce bark in acetone-d6:D2O (1:1).
with the published data [14] show typical signals due to the condensed tannins mostly composed of procyanidin units. The strong signal centered at 145.3 ppm, with a small shoulder at 145.6 ppm, is attributed to C3’ and C4’ in the B-ring of the PC flavan-3-ol units (catechin/epi- catechin). Other specific aromatic resonances show the 116.7 (112.5 - 117.5) ppm for the C2’ and the C5’; 119.7 (117.5 - 120.5) ppm for the C6’; 90 - 110 ppm for the C8, the C6, the C6’, and the C2’. Since the typical chemical signal for the C3’ and the C5’ (centered at 146 ppm) of PD units is not detected, it can be concluded that the condensed tannins from hot water extract of black spruce bark are exclusively composed of PC units. It was re- ported [15] that the region between 70 and 90 ppm is sensitive to the stereochemistry of the flavonoid C-ring and that the signals centered at = 77.2 (75 - 78) ppm could be assigned to the C2 of cis (epicatechin/epigallo- catechin) stereoisomers, while signals at = 83.6 (82 - 84) ppm could be assigned to the C2 of trans (catechin/ gal-locatechin) stereoisomers. Even if the presence of these signals is a clear proof of presence of both stereoi- somers, the stronger intensity of the signal centered at 77.2 ppm clearly indicates that the cis stereoisomer dominates, which means that CT from black spruce bark are constituted mainly of the epicatechin units and de- rivatives. The spectrum presented at Figure 3 seems to indicate the presence of methoxyl group (−OCH3) and
glucose unit, by the peaks centered at = 56.8 ppm and at 62.1 ppm, respectively. Tannin units containing a methoxyl group have previously been identified by NMR analysis of tannins from Norway spruce (Picea abies)
tree bark [20] and from Norway spruce root bark [21]. The signals centered at = 70.7 (69.0 - 73.5) ppm and 67.8 (65.5 - 68.0) ppm can be associated to C3 chain extender and terminal units, respectively. The intensity of terminal C3 peak relative to that of the extender C3 sig- nal could be used to calculate the polymer chain length [14]. Inspection of liquid-state 13C-NMR spectrum, de-
picted in Figure 3 reveals complex structural character- istics of the CT and indicates that the quantifications re- garding the polymer chain length, the guaiacol/catechol moieties ratio and the glucose unit content could not be reliably obtained due to the low signal-to-noise ratio of the spectrum obtained in this work and presented here. However, the 13C-NMR spectroscopy confirmed the pu-
rity of CT fraction and the efficiency of the extraction.
3.3. Pyrolysis-Gas Chromatography/Mass Spectrometry (Py-GC/MS) Analysis
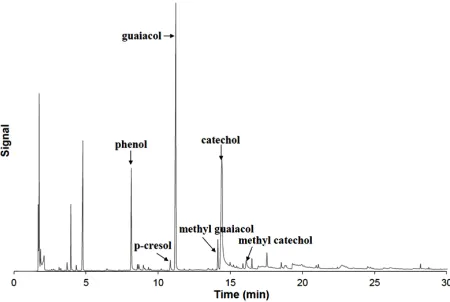
is shown in Figure 4. Pyrolysis of standard flavonoids yields the B-ring aryl groups liberated by the cleavage of the C2-C1’ bond in the flavonoid [22]. Guaiacol (G), phenol (P), catechol (C) and smaller amounts of 4-me- thylcatechol, methyl guaiacol, p-cresol were detected, whereas no pyrogallol or 5-methylpyrogallol were de- tected. These results indicate the presence of p-hydroxy- phenyl, guaiacyl and catechol-type B-rings in the black spruce bark condensed tannin. With the exception of the detect ion of phenol and p-cresol, which indicate the presence of p-hydroxyphenyl type-B-rings, our results are consistent with those obtained by 13C-NMR analysis.
The fact that the p-hydroxyphenyl B rings were not de- tected by the 13C-NMR could be explained by the close
chemical shifts signals of (epi)azfelechin and (epi)cate- chin, rendering analysis of complex flavonoids mixtures difficult [23]. We attempted to quantify the ratio of cate- chol type B-ring to guaiacol type B-ring (C/G) as well as catechol type to phenol type B-ring (C/P) of black spruce tannin by using the response factors determined by quan- titative gas chromatographic analysis of authentic com- pounds. Response factors of simple phenol (P), guaiacol (G) and catechol (C) were determined to be 0.47, 0.13 and 0.20 in terms of compound weight (μg)/peak area (MCount), respectively. Following the procedure de- scribed by Ohara et al. [16] and assuming that the yields
of catechol, phenol and guaiacol from (epi)catechin, (epi) azfelechin and 3-O-methyl(epi)catechin are the same, we were able to estimate the molar ratios of C/G and C/H, originating from the flavan B rings of black spruce bark CT, to be 1.3 and 1.6, respectively. This result indicates that the condensed tannins from black spruce bark con- sist mainly of catechol type B-rings, with lesser partici- pation of phenol and guaiacol type B-rings.
3.4. High Performance Liquid Chromatography Coupled with Fluorimetric and Electrospray Ionization Mass Spectrometric Detection (HPLC-FL ESI/MS)
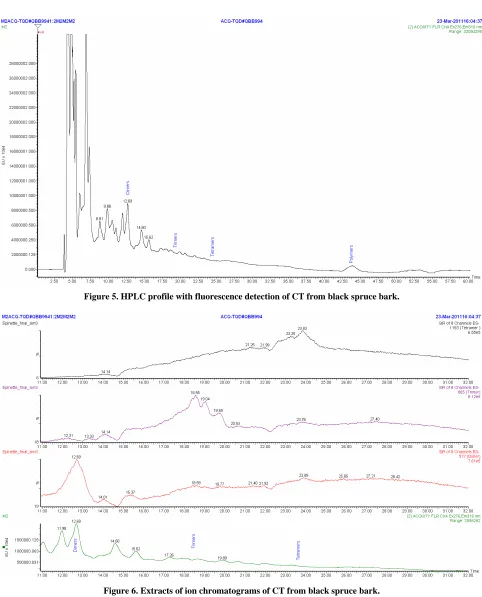
The crude water extract of black spruce bark (rich in condensed tannins) was analysed by HPLC-FLESI/MS. MS and FL detections were chosen since they give higher response compared to UV detection. Proantho- cyandins have low molar extinction coefficients and ab- sorption maxima in a region of the UV spectrum (around 280 nm) with many interfering compounds co-eluting. The black spruce bark extract sample was analyzed for the type and size of condensed tannins present. The HPLC profile with fluorimetric detection is presented in Figure 5. The degree of polymerisation positions was determined as reported by Robbins et al. [17] on cocoa
and chocolate samples. Figure 5 shows a complex chro- matogram indicating the peaks corresponding to dimer,
Figure 4. Pyrogram of CT isolated from the water extract of black spruce bark.
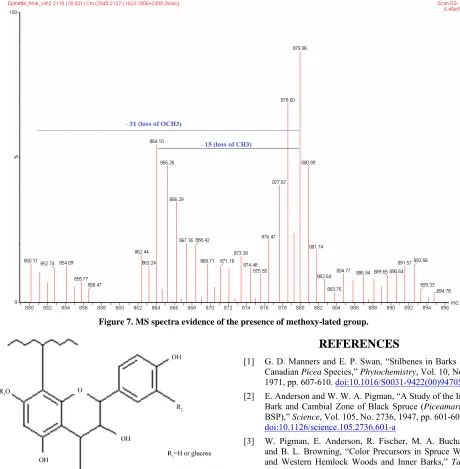
trimer and tetramer. The polymers peak is also present and it corresponds to the proanthocyanidin polymers with the degree of polymerization higher than 10 degree. The HPLC chromatogram and MS spectra do not indicate the presence of monomeric (epi)catechin ion (M-H) 289 m/z. The mass spectral data indicate the presence of B-type interflavan linkages of epicatechin which is consistent with the results of our previous study [4]. The ion chro- matograms extracted from an HPLC-ESI/MS analysis show the presence of peaks at m/z (M-H) 577, 865 and 1153 corresponding to B-type epicatechin-based proan- thocyanidin dimers, trimers and tetramers respectively (Figure 6). Other relevant ions were also detected. One can observe m/z (M-H) 592 (figure not presented) and 880 (Figure 7) corresponding to proanthocyanidin dimer based on 3-O-methylepicatechin-epicatechin (m/z = 289 + 304 − 1) and trimer (m/z = 288 + 289 + 304 − 1) re- spectively, which confirms the presence of methoxylated B-rings (guayacyl-B-rings in the black spruce bark con- densed tannin, thus confirming the results obtained by Py-GC/MS analysis. Taking into account all the results obtained with analytical methods used in this study, we are proposing the chemical structure of flavanol mono- meric unit of condensed tannin isolated from black spruce bark as presented in Figure 8.
4. Conclusion
The findings on structural characteristics of the black spruce bark condensed tannins described in this research are reported for the first time. The complex chemical structure of CT from the bark of Picea mariana was
[image:5.595.310.535.86.237.2]Figure 5. HPLC profile with fluorescence detection of CT from black spruce bark.
Figure 6. Extracts of ion chromatograms of CT from black spruce bark.
nins which are constituted of (epi)azfelechin and 3-O- methyl(epi)catechin, which makes the condensed tanins structure from black spruce bark consistent with that re-ported on condensed tannins from yet another member of genus Picea, Norway spruce (Picea abies) bark. The
[image:6.595.58.543.355.650.2]Figure 7. MS spectra evidence of the presence of methoxy-lated group.
Figure 8. Proposed chemical structure of a monomeric unit of the black spruce bark condensed tannin.
polymers consisting of more than 10 flavanol (mainly epicatechin) units. These findings complete the picture of these important polymer polyphenols available in huge quantities from bark of black spruce (Picea mariana), the
most important species in the Canadian forests.
5. Acknowledgements
The authors would like to thank Mr. Yves Bédard for his technical support.
REFERENCES
[1] G. D. Manners and E. P. Swan, “Stilbenes in Barks of 5 Canadian Picea Species,” Phytochemistry, Vol. 10, No. 3,
1971, pp. 607-610. doi:10.1016/S0031-9422(00)94705-8
[2] E. Anderson and W. W. A. Pigman, “A Study of the Inner Bark and Cambial Zone of Black Spruce (Piceamariana
BSP),” Science, Vol. 105, No. 2736, 1947, pp. 601-602. doi:10.1126/science.105.2736.601-a
[3] W. Pigman, E. Anderson, R. Fischer, M. A. Buchanan and B. L. Browning, “Color Precursors in Spruce Wood and Western Hemlock Woods and Inner Barks,” Tappi,
Vol. 36, No. 4, 1953, pp. 4-12.
[4] P. N. Diouf, T. Stevanovic and A. Cloutier, “Study on Chemical Composition, Antioxidant and Anti-Inflam- matory Activities of Hot Water Extract from Picea mariana Bark and Its Proanthocyanidin-Rich Fractions,” Food Chemistry, Vol. 113, No. 4, 2009, pp. 897-902. doi:10.1016/j.foodchem.2008.08.016
[5] M.-E. García-Pérez, M. Royer, A. Duque-Fernandez, P. N. Diouf, T. Stevanovic and R. Pouliot, “Antioxidant, Toxi- cological and Antiproliferative Properties of Canadian Polyphenolic Extracts on Normal and Psoriatic Keratino- cytes,” Journal of Ethnopharmacology, Vol. 132, No. 1, 2010, pp. 251-258. doi:10.1016/j.jep.2010.08.030
doi:10.1016/S0377-8401(01)00228-0
[7] A. Yanagida, T. Shoji and Y. Shibusawa, “Separation of Proanthocyanidins by Degree of Polymerization by Means of Size-Excluzion Chromatography and Related Tech- niques,” Journal of Biochemical and Biophysical Meth- ods, Vol. 56, No. 1-3, 2003, pp. 311-322.
doi:10.1016/S0165-022X(03)00068-X
[8] M. Karonen, J. Loponen, V. Ossipov and K. Pihlaja, “Analysis of Procyanidins in Pine Bark with Reversed- Phase and Normal Phase High-Performance Liquid Chro- matography-Electrospray Ionization Mass Spectrometry,”
Analytica Chimica Acta, Vol. 522, No. 1, 2004, pp. 105- 112. doi:10.1016/j.aca.2004.06.041
[9] L. P. Meagher, G. Lane, S. Sivakumaran, M. H. Taven- dale and K. Fraser, “Characterization of Condensed Tan- nins from Lotus Species by Thiolytic Degradation and Electrospray Mass Spectrometry,” Animal Feed Science and Technology, Vol. 117, No. 1-2, 2004, pp. 151-163. doi:10.1016/j.anifeedsci.2004.08.007
[10] N.-E. Es-Safi, S. Guyot and P.-H. Ducrot, “NMR, ESI/ MS and MALDI-TOF/MS Analysis of Pear Juice Poly- meric Proanthocyanidins with Potent Free Radical Scav- enging Activity,” Journal of Agricultural and Food Chem- istry, Vol. 54, No. 19, 2006, pp. 969-977.
doi:10.1021/jf061090f
[11] P. Navarrete, A. Pizzi, H. Pasch, K. Rode and L. Del- motte, “MALDI-TOF and 13C NMR Characterization of Maritime Pine Industrial Tannin Extract,” Industrial Crops and Products, Vol. 32, No. 2, 2010, pp. 105-110.
doi:10.1016/j.indcrop.2010.03.010
[12] F. H. Romer, A. P. Underwood, N. D. Senekal, S. L. Bonnet, M. J. Duer, D. G. Reid and J. H. van der Westhuizen, “Tannin Fingerprinting in Vegetable Tanned Leather by Solid State NMR Spectroscopy and Compari- son with Leathers Tanned by Other Processes,” Molecules,
Vol. 16, No. 2, 2011, pp. 1240-1252.
doi:10.3390/molecules16021240
[13] L. J. Porter, L. N. Hrstich and B. G. Chan, “The Conver- sion of Proanthocyanidins and Delphinidins to Cyanidin and Delphinidin,” Phytochemistry, Vol. 25, No. 1, 1986,
pp. 223-230. doi:10.1016/S0031-9422(00)94533-3
[14] Z. Czochanska, L. Y. Foo, R. H. Newman and L. G. Por- ter, “Polymeric Proanthocyanidins. Stereochemistry, Struc- tural Units, and Molecular Weight,” Journal of the Che- mical Society, Perkin Transactions 1, 1980, pp. 2278-
2286. doi:10.1039/p19800002278
[15] K. Lorenz and C. M. Preston, “Characterization of High- Tannin Fractions from Humus by Carbon-13 Cross-Po- larization and Magic-Angle Spinning Nuclear Magnetic Resonance,” Journal of Environmental Quality, Vol. 31, No. 2, 2002, pp. 431-436. doi:10.2134/jeq2002.0431
[16] S. Ohara, Y. Yasuta and H. Ohi, “Structure Elucidation of Condensed Tannins from Barks by Pyrolysis/Gas Chro- Matography,” Holzforschung, Vol. 57, No. 2, 2003, pp.
145-149. doi:10.1515/HF.2003.023
[17] R. J. Robbins, J. Leonczak, J. C. Johnson, J. Li, C. Kwik-Uribe, R. L. Prior and L. Gu, “Method Performance and Multi-Laboratory Assessment of a Normal Phase High Pressure Liquid Chromatography-Fluorescence De- tection Method for the Quantitation of Flavanols and Procyanidins in Cocoa and Chocolate Containing Sam- ples,” Journal of Chromatography A, Vol. 1216, No. 24, 2009, pp. 4831-4840. doi:10.1016/j.chroma.2009.04.006
[18] W. Heller and G. Forkmann, “Biosynthesis of Flavon- oids,” In: J. B. Harborne, Ed., The Flavonoids: Advances in Research Since 1986, Chapman and Hall, London,
1993, pp. 499-535.
[19] L. Hussein, M. A. Fattah and E. Salem, “Characterization of Pure Proanthocyanidins Isolated from the Hulls of Faba Beans,” Journal of Agricultural and Food Chemis- try, Vol. 38, No. 1, 1990, pp. 95-98.
doi:10.1021/jf00091a018
[20] L. Zhang and G. Gellerstedt, “2D Heteronuclear (1H-13C) Single Quantum Correlation (HSQC) NMR Analysis of Norway Spruce Bark Components,” In: T. Q. Hu, Ed.,
Characterization of Lignocellulosic Materials, Blackwell,
Oxford, 2008, pp. 3-6. doi:10.1002/9781444305425.ch1
[21] H. Pan and L. N. Lundgren, “Phenolic Extractives from Root Bark of Piceaabies,” Phytochemistry, Vol. 39, No. 6,
1995, pp. 1423-1428.
doi:10.1016/0031-9422(95)00144-V
[22] G. C. Galletti and A. Antonelli, “The Potential of Pyroly- sis-(methylation)/Gas Chromatography/Mass Spectrome- try in the Analysis of Wine Polyphenolics,” Rapid Com- munications in Mass Spectrometry, Vol. 7, No. 7, 1993, pp. 656-658. doi:10.1002/rcm.1290070720
[23] L. M. de Souza, T. R. Cipriani, M. Iacomini, P. A. J. Gorin and G. L. Sassaki, “HPLC/ESI-MS and NMR Analy- sis of Flavonoids and Tannins in Bioactive Extract from Leaves of Maytenus ilicifolia,” Journal of Pharmaceuti- cal and Biomedical Analysis, Vol. 47, No. 1, 2008, pp.