Mel Frequency Cepstral Coefficients Based
Pattern Recognition for Limb Motor Action
AnupmaSingh1, Mrinmoy Chakraborty2
M. Tech Student, Dept. of ECE, Dr.B C Roy Engineering College, Durgapur, West Bengal, India1
Assistant Professor, Dept. of ECE, Dr.B C Roy Engineering College, Durgapur, West Bengal, India2
ABSTRACT: This paper proposes a Mel Frequency Cepstral Coefficient (MFCC) based hybrid algorithm for motor imagery classification of Electroencephalogram (EEG) signal for Brain Computer Interface (BCI). The proposed hybrid algorithm contains MFCC with Hjorth Parameter. Regression coefficient method was used for eye artifacts cancellation. The feature extraction method based on the difference of the different hjorth parameters taken from the cepstral coefficients. The extracted features from the cepstral coefficients were classified using two linear classifiers.
KEYWORDS: Brain-computer interface (BCI), Electroencephalogram (EEG), Mel Frequency Cepstral Coefficient (MFCC), and Movement Imagery (MI).
I. INTRODUCTION
Brain Computer Interface (BCI) is the Emerging area of human-computer interaction.The BCItechnology is used for communication between physically disabled people with external world. The objective behind this to control assistive external devices like wheelchair control [1], prosthesis [2] etc. using electric, magnetic or hemodynamic brain signals. BCI systemcan be classified as an invasive or non-invasive according to the measurement of brain activity. When the electrodes used for measurement of brain signal are placed within the brain, is saidto be invasive. On the hand, when the electrodes are placed outside the head, is said to be non-invasive [2]. The non-invasive measurement avoids health hazards. A common non-invasive BCI system includes signal recording, pre-processing, feature extraction, feature classification, device control and feedback [3]. BCI can be evaluated by some parameters like Cohen’s kappa coefficient, Mutual Information, Classification accuracy etc. Minimum and maximum value of kappa coefficient and mutual information are 0 and 1. Classification accuracy having Minimum value 0 % andmaximum value are 100 %. Achieving highest classification accuracy is a great challenge for the researchers, those who are working in the BCI area. To resolve this problem the authors propose a novel technique of EEG signal feature extraction.
The EEG signals is a slowly timevarying signal for asufficiently short period of time, i.e. between 5 and 100 ms, it behaves like stationary signal [4]. Over a longer period of time, the signal behaves like non-stationary signal. The signal changes to reflect the sequence of the brain activities. These types of signal characteristics are called quasi-stationary, which is also observed in the speech signals. Based on this quasi-stationary nature, a popular feature extraction method i.e. currently used for extractingthe speech features canbe applied to extract the brain wave features from the EEG signals. Authors consider mel-frequency cepstral coefficients(MFCCs) [11-13], the most popular feature extraction method for speech signal was applied to extract the feature of the EEG signal.
Regression coefficient method used for the artifacts cancellation purpose [7-10]. Butterworth band pass filter used as preprocessing technique. MFCC with different Hjorth parameters are used as feature extraction method [14-15]. Differences of the feature information are taken as final feature matrix. Extracted features are classified by two well-known linear classifiers Support Vector Matching (SVM) [16-17] and Fisher Linear Discriminant Analysis (FLDA) [18]. Identification of thinking pattern in human brain is done through the movement imagery classification methods and the final stage of the brain pattern identification is to control external machine by the decision [19-22].
II.EXPERIMENTAL PARADIGM OF BCICOMPETITION DATA SET
BCI competition IV data set 2b was used for this experimental analysis. The data set was provided by the Institute for Knowledge Discovery, Graz University of Technology,Austria. This data set contains the EEG data,recorded from 9 subjects[5].
Subjects are right-handed, sitting in an armchair and watching at a screen monitor 1 m away at eye level. 5 sessions are provided for every subject, first two sessions consists training data without feedback andthe last three sessions were consists with feedback.
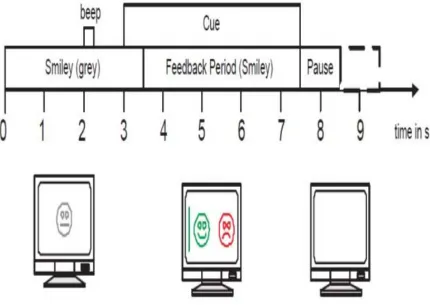
Figure 1. Timing scheme of the paradigm
Several runs are performed for each session and every subject contributinga single session of *03T for the training and *04E for the evaluation Analysis. The data set consists of two classes, namely MI of left hand movement as class 1 and right hand movement as class 2. Three bipolar EEG channels C3, Cz, and C4 were recorded in a sampling frequency of 250 Hz and the recorded signal band-passfiltered between 0.5 Hz and100 Hz, and a notch filter was used at 50 Hz for power line noise cancelation. For movement imagery investigation, only C3 and C4 are utilized. The beginning of each trial started at 0 second in the Figure 1 with a gray smiley was centered on the screen. A shortwarning beep of 1 kHz, 70 mswas givenat 2ndsecond [5].
III.PROPOSED METHODOLOGY
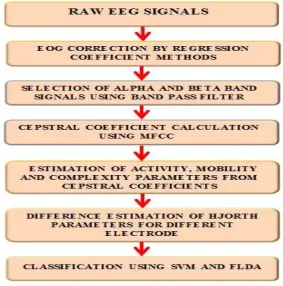
The Proposed method of the EEG signal preprocessing is shown in the Figure.2.
Figure 2. Proposed Methodology
A. Artifact Removal –
The EEG signals are prone to contaminate with various kinds of artifacts like eye blinking, eye movement etc. The electrooculogram (EOG) signal are the most common artifacts present in the recorded EEG signal. Regression coefficient based method was used as artifact canceller [7-8]. Data set contains 6 channel signals three of the are EOG channel and other three are C3, Cz and C4 channels. Authors removed the artifacts of the C3, Cz and C4 channels using three EOG signals through the regression coefficient method [7-10].
The artifact removed EEG signals are
E
Ci( )
n
where C [C3, C4] and i [left, right]B. Preprocessing using Band Pass Filter-
Band pass FIR filter was used for filtering the alpha and beta band signal concurrently i.e. 8 to 30 Hz frequency band signal.
( )
( ) *
( )
i i
C C
X
n
h n
E
n
(1)C. Feature Extraction
C.1 Mel-Frequency Cepstral Coefficients (MFCC)
The MFCC process has following steps:
1. Windowing
2. Calculating First Fourier Transformation (FFT) on the windowed signal
3. Calculating the log amplitudes of the spectrum into the Melscale, using triangular filter bank 4. Calculating Discrete Cosine Transformation (DCT) of the Mel log amplitudes
5. The resulting amplitudes of the spectrum are the Cepstral Coefficient in Mel scale
Data set was divided in 7 frames of 50% overlap; ten linearly spaced Mel filter-bankswere computed per channel and twelve number of cepstral coefficientsselected per frame.
i C
1
2
[C ]
cos( (
0.5)
)
n
r j
j
m
r j
N
N
(2)Where
m
jare the log filterbank amplitudes, r is the number of cepstral coefficient, N is the number of filter bankchannels.
C.2 Hjorth Parameter (Activity, Mobility and Complexity)
Estimation ofstatistical properties of any time domain or frequency domain signals can be possible by using Hjorth method. It has three parameters (Activity, Mobility, and Complexity) [14-15]. Here we have used the all three parameters individually.
Activity:
The activity parameter is estimated by means of the amplitudevariance
[
i]
[
i]
[
i]
C r C r C r
H
ACT
Var C
(3)Mobility:
The mobility parameter is defined as the ratio of square root of the variance of the first order derivative of the signal with the variance for the time domain signal.
'
[
]
[
]
[
]
[
]
i
i i C r
C r C r i
C r
Var C
H
MOB
Var C
(4)Complexity:
Complexity parameter for time domain signal is estimated as the ratio of mobility of the first order derivative of the signal with the mobility of the zero order derivative of the signal
'
([
] )
[
]
[
]
([
] )
i
i i C r
C r C r i
C r
Mobility C
H
COM
Mobility C
(5)C.3 Difference Estimation of Hjorth Parameters
3 4
([
]
[
] )
i i i
C r C r
F
H
H
(6)i
F
has taken as feature matrix and it was further processed for classification.D.Feature Classification
We experimented with both the radial and thelinear basis functions.
SVM was derived from the Vapnik’s statistical learning theory [1 6]. The SVM is specifically used to solve the binary classification problems. Learning problems of the SVM are framed as a quadratic optimization problem. Here the error surface has global optimum and it is free of any local minimum. The primary objective for binary classification by SVM is to build an optimal separating hyper-plane (OSH) where the margin of separation between two nearest data points of two different classes is maximized. The SVM achieves this characteristics principle of on the basis of Structural Risk Minimization (SRM). The SRM principle is to reduce the upper bound of the universal error containing the sum of the training error [17].
Fisher Linear Discriminant Analysis (FLDA):FLDA is a well-known linear classifier based on the Fisher criterion. The dimensionality reduction is the most important property for characterizing the statistical data. Linear classifier projects multidimensional data into one dimension and we take decision for classification of its belonging as per some defined measure [18].
IV.EXPERIMENT AND RESULT
To validate the performance of the MFCC based proposed method, we apply it to a publicly available data sets BCI competition IV [5-6] data set.
Table 1. Classification performance in terms of accuracy (%), the validation results of our proposed algorithm using Activity parameter for BCI competition IV data set of *03T for the training and *04E for the evaluation Analysis
Subject FLDA Classifier SVM Classifier Training Testing Training Testing ACC % MI ACC % MI ACC % MI ACC % MI B01 76. 25 0.22 59.38 0.056 86.88 0.49 58.13 0.056 B02 55.83 0.009 50.83 0.002 66.67 0.083 51.67 0.008 B03 48.13 0.001 53.75 0.004 69.37 0.11 53.13 0.003 B04 98.12 0.867 98.12 0.867 98.75 0.903 98.12 0.867 B05 83.75 0.363 67.50 0.140 90.00 0.553 66.25 0.125 B06 81.87 0.317 76.88 0.230 87.50 0.457 77.50 0.248 B07 81.25 0.305 53.13 0.003 90.00 0.544 70.21 0.004 B08 87.50 0.458 85.00 0.401 93.75 0.668 86.25 0.430 B09 89.38 0.516 90.63 0.597 93.13 0.670 88.12 0.534
Average 78 0.34 61.58 0.26 86.22 0.50 72.15 0.005
Table 1 displays the classification performance in terms of accuracy (%), the validation results of our proposed algorithm using Activity parameter for BCI competition IV data set of *03T for the training and *04E for the evaluation analysis.
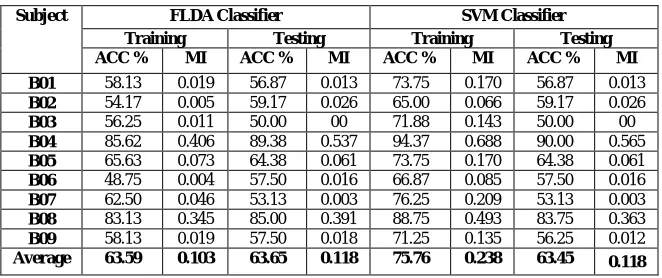
Table 2. Classification performance in terms of accuracy (%), the validation results of our proposed algorithm using Mobility parameter for BCI competition IV data set of *03T for the training and *04E for the evaluation Analysis
Subject FLDA Classifier SVM Classifier
Training Testing Training Testing
ACC % MI ACC % MI ACC % MI ACC % MI
B01 58.13 0.019 56.87 0.013 73.75 0.170 56.87 0.013
B02 54.17 0.005 59.17 0.026 65.00 0.066 59.17 0.026
B03 56.25 0.011 50.00 00 71.88 0.143 50.00 00
B04 85.62 0.406 89.38 0.537 94.37 0.688 90.00 0.565
B05 65.63 0.073 64.38 0.061 73.75 0.170 64.38 0.061
B06 48.75 0.004 57.50 0.016 66.87 0.085 57.50 0.016
B07 62.50 0.046 53.13 0.003 76.25 0.209 53.13 0.003
B08 83.13 0.345 85.00 0.391 88.75 0.493 83.75 0.363
B09 58.13 0.019 57.50 0.018 71.25 0.135 56.25 0.012
Average 63.59 0.103 63.65 0.118 75.76 0.238 63.45 0.118
Table 3. Classification performance in terms of accuracy (%), the validation results of our proposed algorithm using Complexity parameter for BCI competition IV data set of *03T for the training and *04E for the evaluation Analysis
V.CONCLUSION
Table 3 displays the classification performance in terms of accuracy (%), the validation results of our proposed algorithm using Complexity parameter for BCI competition IV data set of *03T for the training and *04E for the evaluation analysis. After analyzing the result we can conclude that the performance of BCI system depends on the subject, i.e. for every subject performance is not equal. Performance of three different algorithm shows that the subject 4is excellent and subject three is poor. By comparing three different algorithms, we can conclude that the algorithm with activity parameter is shows good performance and performance of the proposed algorithm with the SVM classifier is better than the FLDA classifier.
REFERENCES
1. B. Rebsamen,et al.: Controlling a Wheelchair Indoors Using Thought. IEEE Intelligent Systems, 22(2) pp.18-24,2007. 2. N. Birbaumer: Brain-computer-interface research: Coming of age. Clinical Neurophysiology, 117(3) pp. 479-483, 2006
3. R. Krepki et al.: Berlin Brain-Computer Interface-The HCI communication channel for discovery. International Journal of Human-Computer Studies, 65(5)pp.460-477, 2007
4. Saeid Sanei, J. A. Chambers, “EEG Signal Processing”, John Wiley and Sons. Ltd, 2007. 5. BCI Competition IV, 2009, http://www.bbci.de/competition/iv/desc_2b.pdf.
6. R. Leeb , F. Lee, C. Keinrath, R. Scherer, H. Bischof, G. Pfurtscheller. Brain-computer communication: motivation, aim, and impact of exploring a virtual apartment. IEEE Transactions on Neural Systems and Rehabilitation Engineering 15: pp.473-482, 2007.
7. A. Schlogl et. al.: “A fully automated correction method of EOG artifacts in EEG recordings”. Clinical Neurophysiology, 118 . 98–104. 978-1-4244-5532-4, 2009 8. M. Fatourechi et al.,“EMG and EOG artifacts in brain computer interface systems: A survey”, Clinical Neurophysiology 118, pp. 480–494.2007
9. J. C. Woestenburg, M. N. Verabaten, and J. L. Slangen, “The removal of the eye-movement artefact from the EEG by regression analysis the frequency domain,” Biol. Psychol., vol. 16, pp. 127–147, 1983.
10. C. J. James et al., “Multi reference adaptive noise cancelling applied to the EEG,” IEEE Trans. Biomed. Eng., vol. 44, pp. 775–779, Aug. 1997.
11. Norzaliza M. Nor, Abdul Wahab , Norhaslinda Kamaruddin and Hariyati Majid, “Post Accident Analysis Of Driver Affection”, 15th International Symposium on Consumer Electronics, 978-1-61284-842, 2011
12. V.Rathikarani, P.Dhanalakshmi, “Automatic Classification of ECG signal for Identifying Arrhythmia” , International Journal of Advanced Research in Computer Science and Software Engineering Volume 3, Issue 9, September 2013
13. Tae-Gu Kwon, Jeong-Hoon Shin, “An analysis of Brain waves characteristic with Acupuncture Feedback using MFCC”, 10th ACIS International Conference on Software Engineering, Artificial Intelligences, Networking and Parallel/Distributed Computing 978-0-7695-3642-2/09 2009
14. B. Hjorth. EEG analysis based on time domain properties, Electroencephalography and Clinical Neurophysiology, 29(3): pp. 306-310.1970;
15. B. Hjorth. The Physical Significance of Time Domain Descriptors in EEG Analysis. Electroencephalography and Clinical Neurophysiology; 34: pp. 321-325,1973 16. Vapnik, V. The nature of statistical learning theory. Springer-Verlag (New York) 1995.
17. Cao, L. J. et al. Support vector machine with adaptive parameters in financial time series forecasting. IEEE Transactions on Neural Networks 14(6).2003; 18. R. Duda, P. Hart, et al.: Pattern Classification. John Wiley and Sons, 2001.
19. A. Cichocki : Real-time control of wheelchairs with brain waves, RIKEN Toyota Motor Corporation Toyota Central R and D Labs, June 20-23, 2009. http://www.riken.jp/engn/r-world/research/lab/nokagaku/toyota/nbmi/index.html.
20. K. Tanaka, H. O. Wang, et al., “Electro encephalogram based control of an electric wheelchair”, IEEE Trans. Robotics, Vol. 21, No. 4, pp. 762-766, 2005. 21. Shang-Ming Zhounet. al., “Classifying mental tasks based on features of higher-order statistics from EEG signals in brain–computer interface”, Information
Sciences 178 (2008) 1629–1640.
22. Kavitha P. Thomas et. al., “A New Discriminative Common Spatial Pattern Method for Motor Imagery Brain-Computer Interfaces”, IEEE Transaction on Biomedical Engineering, Vol.56, No.11,11/2009,pp.2730-2733.
Subject FLDA Classifier SVM Classifier
Training Testing Training Testing
ACC % MI ACC % MI ACC % MI ACC % MI
B01 55.00 0.007 53.13 0.003 74.38 0.179 53.13 0.003
B02 47.50 0.002 58.33 0.021 65.83 0.074 58.33 0.021
B03 40.00 0.029 50.00 00 68.75 0.104 50.00 00
B04 90.00 0.531 91.87 0.633 94.37 0.688 92.50 0.651
B05 50.00 00 50.62 0.001 67.50 0.091 50.62 0.001
B06 58.75 0.022 56.87 0.014 72.50 0.151 56.25 0.012
B07 60.62 0.033 56.87 0.014 72.50 0.152 56.25 0.012
B08 85.00 0.392 85.00 0.390 92.50 0.616 85.62 0.412
B09 45.62 0.006 56.87 0.014 71.25 0.136 56.87 0.014