Learning Based Single-Frame Image Super-Resolution
using Contourlet Transform
Sukeshkumar P.Borate
,
Dr. Sanjay L.NalbalwarDepartment of Electronics & Telecommunication Dr.B.A.T.U., Lonere, Raigad, M.H., India
Abstract
—
In most imaging applications, images with higher spatial resolution are desired and often required. Super-resolution refers to an algorithmic approach to construct high resolution images from single low resolution image or multiple low resolution images. In this paper a single image observation is super-resolved by learning the contourlet coefficients of low resolution image. The contourlet coefficients at finer scale of low resolution image are learned locally from the high resolution training data set. Contourlet transform is capable of capturing the smoothness along the contour making use of directional decomposition. Experimentation shows appropriate improvements in MSE and PSNR compared with traditional techniques.Keywords— Contourlet, Super-resolution, Learning based
method.
I. INTRODUCTION
Images that are captured by the charge-coupled device (CCD) have limited resolution. These captured images also undergo from aliasing, blur and noise which occur within the sensors or during transmission. These degraded images are low-resolution (LR) images. In medical field, HR images are required to make correct diagnosis. HR satellite images prove very useful to differentiate the objects from similar one, a consumer photograph can be enlarged with more details. Image super-resolution (SR) reconstruction is a technique by which one can enhance the spatial resolution of an image. In this process the LR image is up sampled from one or several low resolution observations to obtain a SR image [1,2]. The SR technique is classified as reconstruction based and learning based methods. Several low resolution observations are required for the reconstruction based methods where as in learning based methods a single low resolution observation is necessary but it requires a database of high resolution images to obtain SR image. Most of the reconstruction based methods proposed in the literature use motion cue to super-resolve the image in which registration at sub-pixel accuracy is required. Spatial resolution enhancement of single image observation can be achieved by interpolation technique but it does not attempt to remove aliasing and blurring. In numerous applications a single low resolution observation is available. The non redundant information is extrapolated from the similar or arbitrary high resolution images, to obtain the super-resolved image. Such high resolution images are accessible from the database. In this paper coefficients at finer scales of low resolution image are learnt from a set of high resolution training images. Contourlet based multi-resolution analysis is used to learn
the contourlet coefficients at finer scales for the low resolution image.
This paper is organized as follows: LR imaging model is shown in section 2. Section 3 discusses contourlet transform. Section 4 discusses steps to learn contourlet coefficients. Experimentation results on different gray and color images are discussed in section 5. Paper concludes with section 6.
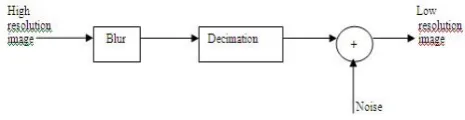
II. LOW RESOLUTION IMAGING MODEL
To obtain low resolution image following image formation model is used.
y
DBx
n
(1) wherex
is lexicographically ordered original high resolution image of M21pixels,D
is decimation matrix andB
is the blur matrix. The size of the decimation matrix depends upon the decimation factor and is not invertible.y
is a low resolution observation obtained and represented lexicographically in order of N21 pixel size and nis noise vector of size M21. Here noise is assumed to be zero mean independent identically distributed and blur to be an identity matrix. The imaging model is illustrated in Figure 1.Fig. 1 Low resolution image formation model
III.CONTOURLET TRANSFORM
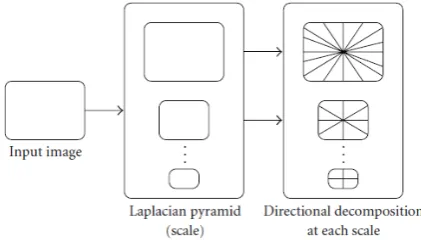
in which at first the Laplacian pyramid (LP) [9] is used to capture the point discontinuities, followed by a directional filter bank (DFB) [10] to link point discontinuities into linear structures. DFB was designed to capture the high frequency components present in different directions. Hence the low frequency components were handled poorly. So it is combined with LP [11] where low frequency components are removed before applying to DFB.Combining the Laplacian pyramid and the directional filter bank yields the discrete contourlet transform. The multiscale and directional decomposition stages in the contourlet transform are independent of each other and hence each scale can be decomposed into any arbitrary power of two number of directions and different scales into different number of directions. Figure 2 shows the pyramidal directional filter bank structure that implements the contourlet transform.
Fig. 2 Pyramidal Directional Filter Bank Structure
IV.CONTOURLET BASED LEARNING
When an image is interpolated, a region without any edges does not suffer from any degradation. However, if it contains edges, they get blurred during the up sampling process. Using wavelets there are no difficulties in learning horizontal and vertical edges, but we do have some problem in learning edges oriented along arbitrary directions. This motivated to use the contourlet transform which is capable of catching the smoothness along contours naturally. Given a low-resolution input image y, we perform a contourlet decomposition consisting of two pyramidal levels and each pyramidal level is then decomposed into four directional sub bands which yield the decomposition as shown in Figure 3(a). Three-level decomposition is performed on all the high-resolution database images and each pyramidal level is decomposed into four directional sub bands resulting in the decomposition as shown in Figure 3(b). We learn the contourlet coefficients in the four directional sub bands corresponding to the finest level for the given low-resolution image (shown with dotted lines in Figure 3(a)). After learning, effectively we have a three level decomposition for the input image, that is, the original low-level decomposition coefficients plus the learned coefficients at the finer scale. The inverse transform of this will yield the high-resolution equivalent of the low-resolution input. Figure 3 illustrates the block schematic of how the contourlet coefficients at finer scales are learned from a set of training images using a two-level contourlet decomposition of the low-resolution test image. The high-resolution training images are decomposed into three pyramidal levels and the test image at each location is
compared to the training images in the contourlet domain at two coarser scales to search for presence of a nearly identical edge at all possible locations. This is required for extrapolating the missing contourlet coefficients in the directional sub bands IX–XII for the test image. Here the low-resolution image is of size M × M pixels. Considering an up sampling factor of 2, the high-resolution image, has a size of 2M×2M pixels. For each coefficient in the sub bands I–IV and the corresponding 2 × 2 blocks in the sub bands V–VIII, we extrapolate a block of 4 × 4 contourlet coefficients in each of the sub bands IX, X, XI, and XII. In order to do this we exploit the idea from zero tree concept, that is, in a multiresolution system, every coefficient at a given scale can be related to a set of coefficients at the next coarser scale of similar orientation [13]. Using this idea we follow the minimum absolutedifference (MAD) criterion to estimate the contourlet coefficients. We take the absolute difference locally between the contourlet coefficients in the low resolution image and the corresponding coefficients in each of the high-resolution training images. Sub bands I– VIII of the low-resolution image are considered. The contourlet coefficient at a location (i, j) is denoted as d(i, j). Consider the range 0 ≤ i, j ≤ M/4. The contourlet coefficients dI(i, j), dII(i, j + M/4), dIII(i + M/4, j), dIV(i + M/4, j + M/4) corresponding to sub bands I–IV and 2 × 2 blocks consisting of dV(k, l), dVI(k, l+M/2), dVII(k+M/2, l), dVIII(k+M/2, l+M/2) for k = 2i : 2i + 1 and l = 2j : 2j + 1
corresponding to subbands V–VIII in the low-resolution test image and all the high-resolution training images are considered to learn a 4×4 contourlet block in each of the sub bands IX–XII consisting of unknown coefficients dIX(k, l), dX(k, l +M), dXI(k +M, l), dXII(k +M, l +M) for k = 4i :
4i+3 and l = 4j : 4j +3. For the best match in the MAD, copy the corresponding 4 × 4 contourlet block in bands IX– XII to those bands for the test image.
Fig. 3(a)LR with two level decomposition.(b)HR training set with three level decomposition
The learning algorithm is given in steps as below:
1) Formation of LR image from one of the HR training images using low resolution formation model.
MxM and three level decomposition of all HR training images each having a size of 2Mx2M. 3) Considering the contourlet coefficients in sub
bands I-IV and corresponding 2x2 blocks in V-VIII of LR and HR image, obtain the sum of absolute difference between the contourlet coefficients in the LR image and all the coefficients for each of training image. Find the best match.
4) If MAD < threshold, acquire the high resolution contourlet coefficients (4x4 block) from the training image of sub bands IX-XII to LR test image, otherwise set the sub bands IX-XII of LR test image to zeros.
5) Repeat steps (3-4) for every contourlet coefficient in bands I-IV of low resolution image.
6) Perform inverse contourlet transform to obtain the high-resolution image of the given test image. In post processing histogram specification technique is used for image enhancement.
V. EXPERIMENTAL RESULTS
Experiments are carried out on different types of images to find the efficiency of the algorithm. Arbitrary high resolution gray images of different objects are downloaded from the internet to form the training data set. The training images in the data set considered are of 100. A high resolution gray image which not present in training data set is considered to obtain a low resolution image. This low resolution image is obtained through imaging model and up sampled to obtain a super-resolution image. Figure 4 (a) shows a low-resolution image of girl and figure 4 (b) is high resolution image. Bicubic interpolated image is shown in figure 4(c). The interpolated image is blurred and cannot get the details of hair and eye. The image shown in figure 4 (d) is super-resolved by using contourlet transform. The super-resolved image shows every detail of the eyes and hair. The details of the eye brows can be visualized in the image and image is sharp.
Fig. 4 a) Low resolution image b) Original High resolution image c) Bicubic interpolated image d) Super-resolved image by using contourlet
transform
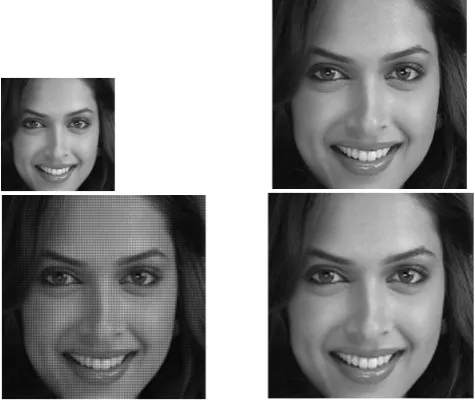
Image shown in Figure 5 (a) is low resolution image of aishwarya and original high resolution image is shown in figure 5(b). Image shown in figure 5(c) is bicubic interpolated image which is blurred one. The details of eye brows, eye balls and lips appear to be blurred. Figure 5 (d) shows the super-resolved image by using contourlet transform. The details of the eye balls and eye brows can be observed clearly. Image looks to be sharp.
Fig. 5 a) Low resolution image b) Original High resolution image c) Bicubic interpolated image d) Super-resolved image by using contourlet
transform
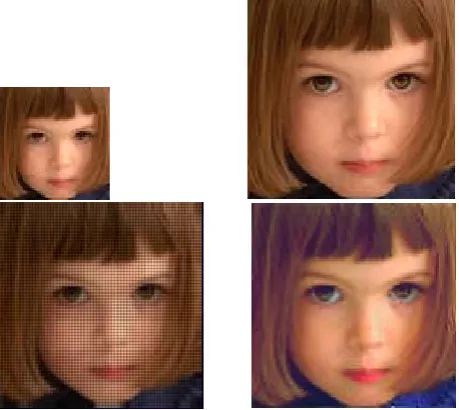
Fig. 6 a) Low resolution image b) Original High resolution image c) Bicubic interpolated image d) Super-resolved image by using contourlet
transform
Image shown in Figure 6 (a) is low resolution image of a boy and original high resolution image is shown in figure 6(b). Image shown in figure 6(c) is bicubic interpolated image which is blurred one. The details of eye and teeth have lost and the hairs found to be total undistinguishable. Figure 6 (d) shows the super-resolved image by using contourlet transform. The details of the eye and teeth can be observed clearly. The hair strands can be distinguishable. Image looks to be sharp.
comparison purpose the mean squared error (MSE) and peak signal-to-noise ratio (PSNR) in db is computed for the reconstructed image. The correlation coefficient of the low resolution test image and the reconstructed image is evaluated to observe the quality of the reconstructed image. The highest value of correlation coefficient is one when reconstructed image is equal to the original high resolution image.
TABLE I
COMPARISON OF MSE AND PSNR IN DB FOR GRAY IMAGES
Experiments on color images have been carried out to recognize the performance of the contourlet learning. The training data set of high quality 100 color images is considered for the experimentation. The low resolution image is obtained from the same imaging model and it does not belong to data set. The input low resolution and all the high resolution images from data set are converted into
r
b C
C
Y format. The Y plane which represents
luminance is used to learn the contourlet coefficients of low resolution image. The other two planes Cb and Cr are interpolated with bicubic interpolation. The high resolution image is then reconstructed by combining these three planes. Figure 7 (a) shows the low resolution image of a cat and figure 7(b) is its high resolution version. The image shown in figure 7(c) is bicubic interpolated image. The result shows blurred image with less details. Figure shown in 7(d) is super-resolved image by using contourlet transform. All the details of eyes have been preserved in the reconstructed image without blur.
Fig. 7 a) Low resolution image b) Original High resolution image c) Bicubic interpolated image d) Super-resolved image by using contourlet
transform
Figure 8 (a) shows the low resolution image of a girl and figure 8(b) is its high resolution version. The image shown in figure 8(c) is bicubic interpolated image. The result shows blurred image with less details. Figure shown in 8(d) is super-resolved image by using contourlet transform. All the details have been preserved in the reconstructed image without blur and image is quite sharp.
Fig. 8 a) Low resolution image b) Original High resolution image c) Bicubic interpolated image d) Super-resolved image by using contourlet
transform
Table 2 illustrates the comparison of the contourlet learning method over bicubic interpolation for color images in terms of MSE and PSNR in db.
TABLE II
COMPARISON OFMSE AND PSNR IN DB FOR COLORIMAGES
The mean squared error between the original image and reconstructed super-resolved image is expressed as:
b a b a
b
a
S
b
a
S
b
a
S
MSE
,
2 ,
2
,
,
ˆ
,
(2) Where
S
a
,
b
original high resolution image and
a
b
S
ˆ
,
is reconstructed super resolved image. The peak signal to noise ratio in db is defined as:
MSE
PSNR
10
log
255
^
2
(3)
VI.CONCLUSIONS
The contourlet coefficients at finer scale of low resolution image, learned locally from the high resolution training data set are used to estimate the super-resolved image. This method describes a technique to recover the super-resolved image from a single observation using contourlet based learning and useful when multiple observations of a scene are not available so one must make the best use of a single observation to improve its resolution. Experimentation shows appropriate improvements over conventional interpolation techniques. Results depend on quality and quantity of training data set.
REFERENCES
[1] Tsai, R.Y. and Huang, T.S.: “Multiple frame image restoration and registration”, in Advances in Computer Vision and Image Processing, Greenwich, CT: JAI Press Inc., pp. 317-339, 1984.
[2] Park, S.; Park, M. and Kang, M.: “Super-Resolution Image Reconstruction: A Technical Overview”, IEEE Magazine of Signal Processing, vol: 20, 2003.
[3] M. Elad and A. Feuer, “Restoration of a single super-resolution image from several blurred, noisy and undersampled easured images,” IEEE Transactions on Image Processing, vol. 6, no. 12, pp. 1646–1658, 1997.
[4] S. Baker and T. Kanade, “Limits on super-resolution and how to break them,” IEEE Transactions on Pattern Analysis and Machine. Intelligence, vol. 24, no. 9, pp. 1167–1183, 2002.R. Nicole, “Title of paper with only first word capitalized,” J. Name Stand. Abbrev., in press.
[5] C. V. Jiji and Subhasis Chaudhuri: “Signal-Frame Image Super-resolution through Contourlet Learning”, EURASIP Journal on Applied Signal Processing Volume 2006, Article ID 73767, Pages 1– 11
[6] C. V. Jiji, M. V. Joshi, and S. Chaudhuri, “Single-frame image super-resolution using learned wavelet coefficients,” International Journal of Imaging Systems and Technology, vol. 14, no. 3,pp. 105–112, 2004.
[7] W. T. Freeman, T. R. Jones, and E. C. Pasztor, “Example-based super-resolution,” IEEE Computer Graphics and Applications,vol. 22, no. 2, pp. 56–65, 2002.
[8] M. N. Do and M. Vetterli, "The contourlet transform: An efficient directional multiresolution image representation," IEEE Transactions on Image Processing.vol. 14, no.12, pp. 2091-2106,2005.
[9] M. Do and M. Vetterli, "Framing pyramids," IEEE Trans. On Signal Processing, vol. 51, no. 9, pp. 2329- 2342, Sep. 2003.
[10] H. Bamberger Roberto and J. T. Smith Mark, "A filter bank for the directional decomposition of images: Theory and design," IEEE transactions on siganl processing,vol. 40,no. 4, April 1992.
[11] P. J. Burt and E. H. Adelson, “The Laplacian pyramid as a compact image code,” IEEE Transactions on Communications,vol. 31, no. 4, pp. 532–540, 1983.
[12] R. R. Schultz and R. L. Stevenson, “A Bayesian approach to image expansion for improved definition,” IEEE Transactions on Image Processing, vol. 3, no. 3, pp. 233–242, 1994.
[13] J. M. Shapiro, “Embedded image coding using zerotrees of wavelet coefficients,” IEEE Transactions on Signal Processing,vol. 41, no. 12, pp. 3445–3462, 1993.
[14] P. P. Gajjar and M. V. Joshi,” New learning based super-resolution use of DWT and IGMRF prior,” IEEE Transactions on Image Processing, vol. 19, no. 5, pp. 1201-1213, May 2010.