Modelling and Analysis of PMSG based Grid
Connected WECS under Different Operating
Conditions
Bhawna1, Gagan Deep Yadav2
PG Student, Dept. of EE, Yamuna Inst. of Engg. & Tech., Yamunanagar, Haryana, India1
Assistant Professor, Dept. of EE, Yamuna Inst. of Engg. & Tech., Yamunanagar, Haryana, India 2
ABSTRACT: Due to the increasing concern about the various aspects of conventional generating units such as depleting fossil fuel, environment issues like release of pollutants in the air have forced the research companies to exploit the renewable energy resources using small generating units. One of the renewable energy sources is wind energy which has a great potential and being exploited by many. The share of the wind energy in the power sector is quite less, but nowadays its share is growing at high rate. Consequently, researchers have been trying to develop ways to take advantage of different types of clean and renewable energy sources. Wind energy production, in particular, has been growing at an increasingly rapid rate, and will continue to do so in the future. In fact, it has become an integral part in supplying future energy needs, making further advancements in the field exceedingly critical. Basically the work reported in this paper is performance analysis of PMSG based wind energy conversion system during the different operating conditions. PMSG has been utilized in this system due to its various advantages over other generators. The model based on wind energy system has been implemented into the MATLAB/SIMULINK software and simulation results regarding the performance of the system is studied and discussed under normal and fault operating conditions.
KEYWORDS: WECS, Voltage control, Wind speed, PMSG, MATLAB.
I.INTRODUCTION
“Alternative energy”, “sustainability”, and “green” have become buzz words that are heard on an almost daily basis. This is mainly due to rising concerns about the impact humans have on the environment as well as the future state of the production and transmission of the power the world depends on. With the rising cost of oil and increasing demand for energy, countries around the world have taken the initiative to increase the production of renewable types of energies. This has lead to an interest in the ability to capture energy from natural resources such as wind, water and sunlight.
The reason behind the popularity of wind energy is due to its non polluting nature, greater efficiency and mainly due to its low operation cost. The increasing development of wind energy has resulted in many new modelling and improved simulation methods. Wind power harnessing procedure has been a task for many years. Since long back wind mills were put into the task of pumping water and grinding grain. Many new technologies such as pitch control and variable speed control methods have been tested and put forward since. Sometimes, wind turbine work in an isolating mode; therefore, there is no grid. Usually there are two, three or even more than three blades on a wind turbine. However according to aerodynamics concept, three blades is the optimum number of blades for a wind turbine. Asynchronous and synchronous ac machines are the main generators that are used in the wind turbines. A wind turbine produced the kinetic energy with the help of the wind and transforms it into the mechanical energy. Finally, this mechanical energy is converted to electrical energy with the help of a generator. Therefore, the complete system that involves converting the energy of the wind to electricity is called wind energy conversion system. A wind turbine generates the maximum amount of energy from the wind when it is operating at an optimal rotor speed. The optimal rotor speed varies due to the variable nature of the wind speed.
living and living beings includes the whole environment. That’s why it is very important to have an alternate source of energy.
Kaki shanmukesh, Mr.D.V.N.Ananth [2] describes that now for the reduction of these harmful emissions of these pollutants there is alternate source of energy which is called the green energy source and techniques for these sources of energy are developing continuously. For bringing the awareness among the people for the installation of wind energy system MNRE scheme (The Ministry of New & Renewable energy) is introduced. Bouzid Mohamed Amine, Massoum Ahmed, Allaoui Tayeb, Zine Souhila [3]. According to the Research done in the previous work it shows that the variable speed operation of the rotor results in a higher energy production as compare it to a system operating at constant speed. A wind turbine model consists of blades, a generator, a power electronic converter, and power grid. Blades are used to extract power from the wind. A.Bharathi Sankar, Dr.R.Seyezhai [4]. Illustrates about the operating the blades at optimal tip speed ratio, maximum amount of energy can be extracts from the variable speed wind turbine. The maximum power point tracking (MPPT) control of variable speed operation is used to achieve high efficiency in wind power systems. The MPPT control is operated using the machine side control system. The function of pitch angle control scheme is to regulate the pitch angle by keeping the output power at rated value even when the wind speed experiences gusts. Omessaad Elbeji, Mouna Ben Hamed, LassaadSbita [5]. Nowadays, DFIG are widely utilized in variable speed wind turbine but the major issue is the requirement of gear box to match turbine and rotor speed. Another drawback of the gearbox is that it mostly requires a regular maintenance which makes the system unreliable. In case of constant wind speed reliability can be improve by using the PMSG. For the extraction of maximum power from the wind energy resource there are various control strategies. In case of PMSG based wind energy system control strategies has been developed in which generator side rectifier is controlled to obtain the maximum power from wind energy source .This method consist of one switching device IGBT, which is utilized to control generator torque for the extraction of maximum power. Bipin Biharee Srivastava, Er. Sudhanshu Tripathi [6]. Authors discusses that since there is insurmountable evidence of the many ways that the burning of fossil fuels pollute the planet, many are stepping up to the worldwide challenge of decreasing dependency upon them. According to the Global Status Report from the Renewable Energy Policy Network for the 21st Century (REN21), as of 2009, there were 85 countries with policy goals intended to increase the renewable energy usage and production. The major types of “renewable energy” described in these goals include wind, solar, hydroelectric, geothermal, and biomass. Nandini.A, Isha T.B [7]. Describes about the model in which experimental set up of the system is designed in which the wind turbine was built by utilizing the separately excited dc motor mechanically coupled to the PM machine and in this model the load voltage and frequency was kept constant.
II.WIND ENERGY CONVERSION SYSTEM
Wind turbines are utilized to transform the wind energy to electricity. At first wind turbine was built and designed by Charles F. Brush in 1887- 1888 in Cleveland, Ohio. It was equipped with 144 cedar blades and having a rotating diameter of 17 m. It has the generation power of about 12 kW for charging the batteries that supply DC current to the various lamps and electric motors. At present a typically three blades type wind turbine are utilized which are operating at relative high wind speeds for generating the power output to the several megawatts.
Wind energy is another form of kinetic energy as it flows in air. It can be converted into electrical energy through power conversion mechanism. The wind turbine extracts kinetic energy from the swept area of the blades. The power in the air flow can be calculated is by:
3 2
) , ( 2
1
w p
a r C V
P
Where, πr2 is the rotor swept area, Cp is the power co-efficient, λ is the tip speed ratio, β is the pitch angle while Vw being the wind speed. The tip speed ratio λ can be described as:
λ=rΩ/Vw
Where, Ω is the turbine rotor speed.
TIP SPEED RATIO
Another important factor is the tip speed ratio in the formation of wind turbine design and it is defined as ratio of tangential speed at the blade tip to the actual wind speed.
Pair Pm
Cp
The maximum value of Cp is called Betz limit. In an ideal wind turbine case maximum efficiency was derived by Lanchester in 1915 and Betz in 1920. This is known as Lanchester –Betz limit or Lanchester– Betz law.
To illustrate the performance of any size of wind turbine rotor there are two factors which are responsible are tip-speed ratio and the power coefficient Cp because they are dimensionless. The maximum power coefficient can only be achieved at a single tip-speed ratio and for a fixed rotational speed of the wind turbine this only occurs at a single wind speed.
III. MODELLING OF WECS
The wind energy conversion systems (WECS) includes the essential parts such as wind turbine model, two mass drive train models, power converter set and then are implemented in MATLAB/SIMULINK environment.
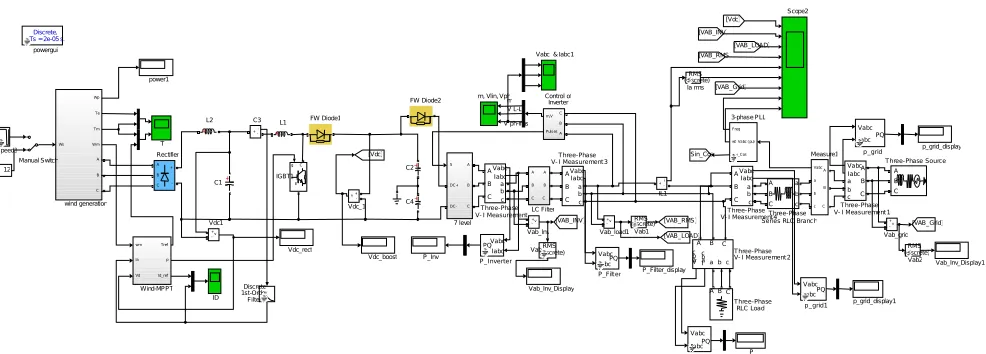
For study the performance of WECS the proposed model utilizing the MATLAB/SIMULINK software is needed. It includes various block sets which has been used to perform the working of proposed model. The block sets called the SIMPOWER SYSTEM has been utilized to design this following model shown in the Figure 1. And then proposed model of PMSG based WECS is implemented into the SIMULINK to study the performance of the model during the different operating conditions. The wind energy conversion system presented in this work begins with a permanent magnet synchronous generator. It is followed by a passive rectification system. The inverter chosen for this project is a PWM controlled set of IGBTs with incorporated controls system. Following that is a harmonic filter and a step up transformer connected to the AC supply grid. Following in the Figure 1 shows the block diagram of the entire wind energy system.
Fig. 1 SIMULINK Model of PMSG Based WECS System
V ph-rms V L-L m Ws Wp Te Tm Wm A B C wind generation Discrete, Ts = 2e-05 s.
powergui
power1
p_grid_display1 p_grid_display m, Vlin, Vph
wm Ia Vd Tref p Id_ref Wind-MPPT Vdc_rect Vdc_boost v+ -Vdc_1 v + -Vdc1
Vabc & Iabc1
v + -Vab_load1 v + -Vab_lnv v + -Vab_grid Vab_Inv_Display1 Vab_Inv_Display RMS (discrete) Vab2 RMS (discrete) Vab1 RMS (discrete) Vab A B C Three-Phase Source a b c A B C Three-Phase Series RLC Branch
A B C Three-Phase RLC Load T Speed3 Scope2 A B C + -Rectifier P_Inv P_Filter_display P VabcA B C a b c Measure1 Manual Switch A B C A B C LC Filter + L2 + L1 RMS (discrete) Ia rms i + -IL1 gC E IGBT1 ID [VAB_LOAD] [VAB_RMS] [VAB_INV] [Vdc] [VAB_Grid] Sin_Cos FW Diode2 FW Diode1 Discrete 1st-Order Filter1 m, V Puls es C B A Control of Inverter 12 + C4 i +-C3 + C2 Vabc Iabc A B C a b c Three-Phase V-I Measurement3 Vabc Iabc A B C a b c Three-Phase V-I Measurement4 V a b c Ia b c A B C
a b c Three-Phase V-I Measurement2 Vabc Iabc A B C a b c Three-Phase V-I Measurement + C1 Vabc IabcA B C a b c Three-Phase V-I Measurement1 S DC+ DC-A B C 7 level [VAB_RMS] [VAB_LOAD] [VAB_INV]
The input to the permanent magnet synchronous generator (PMSG) was chosen to be a constant torque, which is a simulated output of a wind turbine. From there the electrical current runs through a diode bridge for full rectification. A capacitor bank was chosen to smooth the waveforms from the rectifier to charge to a constant voltage. Afterwards, this electrical energy is transformed back into AC through a full bridge IGBT inverter. This inverter is fed by a PWM signal to control the switches. The PWM signal is a series of six signals (two for each set of IGBTs), which change widths depending upon the modulation waveform. When the value of the reference signal, or the sine wave, is greater than the modulation signal, the PWM signal is in a high state (or a logical 1). Otherwise, it is in a low state. depending upon the modulation waveform. When the value of the reference signal, or the sine wave, is greater than the modulation signal, the PWM signal is in a high state (or a logical 1). Otherwise, it is in a low state.
A. WIND TURBINE MODEL
The wind turbine model built and designed in the MATLAB/SIMULINK as shown in Figure 2. The performance coefficient Cp of the turbine is defines as the mechanical output power of the turbine divided by wind power and a function of wind speed, rotational speed, and pitch angle.
There are different parameters on which it depends and they are given as following.
Base power of the electrical generator is given as: 8.5e3/0.9 W
Mechanical output power of the model: 8.5e3 W
Base wind speed of system : 8 m/sec
Maximum power at base wind speed: 0.8 pu
Base rotational speed :1 pu
Fig. 2 SIMULINK Model of Wind turbine
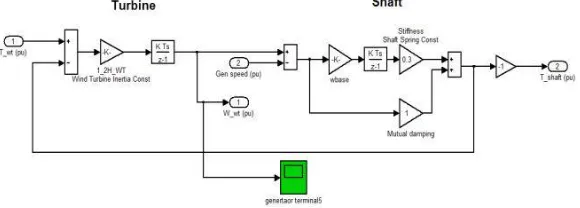
B. TWO MASS DRIVE TRAIN MODEL
The drive train model is included in the wind turbine model. It represents in the wind turbine and shaft coupling system, shown in fig.3.
Fig. 3 SIMULINK Model of Two-Mass driven system
V. RESULT AND DISCUSSION
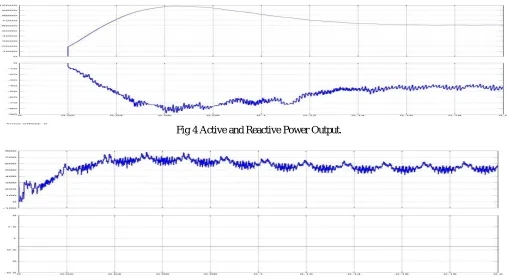
discussed. The power is extracted from wind through the wind energy system connected with PMSG generator then the power is transferred to the generator side rectifier and then to the load utility side inverter. Active and reactive powers for constant speed remain steady. The simulated waveform of voltage and current during the normal and faulted conditions across the source and load is discussed in the chapter .The figures shows the performance of wind energy conversion system in terms of voltage and current waveforms. Various other parameters such as active and reactive power and electrical and mechanical torques are also shown in terms of their waveforms. Figure 5 shows the DC link voltage value and the Modulation index value. DC link voltage is maintained constant value so that the load side converter control system has the good performance. In the following Figure 7, it shows the voltage and current waveforms across the source of WECS. As shown in the figure there is harmonic content in the voltage waveform across the source which means that the power quality one should get from the wind energy system is not that much good power quality. So if source has that much of harmonic content then voltage waveform across the load is also of lower power quality. And in the second waveform which is a current waveform also bring the losses.
Fig 4 Active and Reactive Power Output.
Fig. 5 DC link voltage and Modulation Index
Fig.-7: Voltage and Current Waveforms across Source of WECS without Filter.
Fig.-8: Voltage and Current Waveforms across Source of WECS with Filter.
Now in the Figure 7 there ripple factor or harmonic content in the voltage waveform so therefore to improve power quality of voltage waveform one should connect LC filter in the system. As shown in the Figure 8 harmonic content in the voltage waveform across the source is reduced and shown the much better performance as compare to the voltage waveform shown in the Figure 7. There is also a current waveform across the source shown in the figure given below. From this point of view it is essential that filter should be connected in the model of the system. Since the system is operated in stand-alone mode, the load power consumption is equal to the wind turbine power output. Occurrence of power fluctuations at the load end power converter is reduced by LC filters.
In the Figure 8 voltage and current waveform is shown across the load. Now as per shows in figure the voltage waveform in its initial time period there are harmonic distortions. As the time period increases the harmonic distortion starts getting reduced. This means there may be second order or third order harmonic distortion occurs due to the fluctuation in the wind power supply voltage. Second waveform is the current waveform across the load.
VI.CONCLUSION
Another fact is that this will help in reducing the amount of pollutants released into the environment, it also promote the energy stability and the economic security by reducing the dependability on the fossil fuels.
REFERENCES
[1] Lalit Kumar Gautam, Mugdha Mishra “Permanent Magnet Synchronous Generator Based Wind Energy Conversion System”.International Journal of Electrical Electronics & Computer Science Engineering Volume 1, Issue 1 (February 2014).
[2] Kaki shanmukesh, Mr.D.V.N.Ananth “Analysis of Pmsg Based Wind Energy Conversion System Operating under Different Grid Fault”. International Journal of Science, Engineering and Technology Research (IJSETR), Volume 4, Issue 9, September 2015.
[3] Bouzid Mohamed Amine, MASSOUM Ahmed, Allaoui Tayeb, Zine Souhila “Modelling And Control Of Standalone Wind Energy Conversion System”. International Journal of Advances in Engineering & Technology, Jan. 2014.
[4] A.Bharathi sankar, Dr.R.Seyezhai, “MATLAB Simulation of Power Electronic Converter for PMSG Based Wind Energy Conversion System”. International Journal of Innovative Research In Electrical, Electronics, Instrumentation And Control Engineering Vol. 1, Issue 8, November 2013.
[5] Omessaad Elbeji, Mouna Ben Hamed, Lassaad Sbita, “PMSG Wind Energy Conversion System Modeling and Control”. International Journal of Modern Nonlinear Theory and Application, 2014.
[6] Bipin Biharee Srivastava, Er. Sudhanshu Tripathi, “Tracking of Maximum Power from Wind Using Fuzzy Logic Controller Based on PMSG”. International Journal of Modern Engineering Research.