Performance Comparison of Image Fusion
Using Singular Value Decomposition
SK.Shama
1, L. Padmalatha
2P.G. Student, Dept. of ECE, Gudlavalleru Engineering College, Gudlavalleru, Andhra Pradesh, India1 Associate Professor, Dept. of ECE, Gudlavalleru Engineering College, Gudlavalleru, Andhra Pradesh, India2
ABSTRACT: Image Fusion is a process of combining the relevant information from a set of images into a single
image, where the resultant fused image will be superior quality than any of the input images. Image fusion techniques can improve the quality of image. This paper presents a literature review on performance of different image fusion techniques like, Wavelet transform based fusion, Singular value decomposition, Wavelet packet based fusions, It is observed that image fusion by SVD perform almost similar to that of wavelets and wavelet packets but It is very simple and it is well suited for real time applications. Moreover, SVD does not have a fixed set of basis vectors like FFT, wavelet etc.. and its basis vectors depend on the data set. The performance of singular value decomposition is compared with conventional methods in terms of performance metrics such as Peak Signal to Noise ratio (PSNR), Entropy (EN), Mean square error (MSE), Standard deviation (SD).
KEYWORDS: Singular Value Decomposition (SVD), Wavelet Packets (WP), image fusion performance evaluation
metrics.
I. INTRODUCTION
Image fusion is required mostly for better visualization. There are various reasons, why a raw image data requires processing before display. The range of the intensity values may be small due to the presence of strong background illumination, as well as due to the insufficient lighting
.
Image fusion means the combining of several images into a single image it has the maximum Information content in the given images. Image Fusion improves the quality from a set of images. Important applications of the fusion of images include medical imaging, microscopic imaging, remote sensing, computer vision, and robotics. Different image fusion methods are there to enhance the images like wavelet transform, wavelet packet transform, etc. Singular value decomposition is one of the technique which shows better performance than the other methods.In this paper we implement singular value decomposition which is very simple compared with other methods.SVD is a powerful technique in many matrix computations and analysis. Using the SVD of matrix in computations, rather than the original matrix, has the advantage of being more robust to numerical errors. Many fundamental aspects of linear algebra on determining the rank of matrix, making the SVD an important and widely using technique. A huge advantage of SVD is that it can also adjust the variations that are present in the local statistics of an image. This paper is organised as fallows. Section II describes the wavelet transform. Section III describes the wavelet packet transform. Section IV describes the singular value decomposition. Section V describes performance evaluation. Section VI illustrates simulation result. Conclusion has been made in section VII.
II. WAVELET TRANSFORM
wavelet”. Mother wavelet 𝜓(𝑎, 𝑏) undergoes translation and scaling operations to give self similar wavelet families as given by Equation.
𝜓(𝑎, 𝑏) =1
𝑎𝜓( 𝑡−𝑏
𝑎 ), (𝑎, 𝑏𝜖𝑅),> 0 (1)
Where a is scaling factor and b is translation factor.
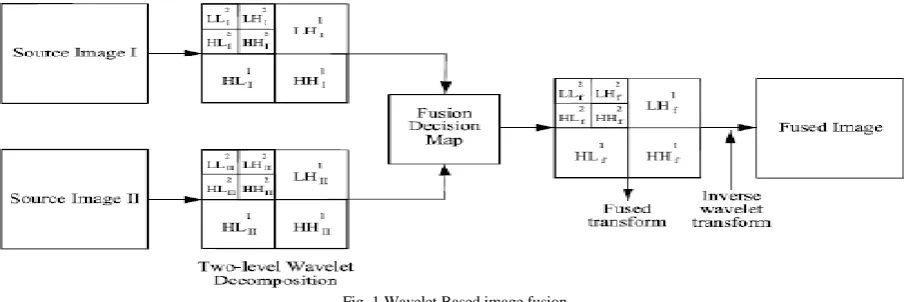
The wavelet transform decomposes the image into low-high, high-low, high-high sub-frequency bands and the low-low band which is shown in Fig. 1. The L-L band contains the average image information whereas the other bands contain directional information due to spatial orientation. Higher absolute values of wavelet coefficients in the high bands correspond to salient features such as edges or lines.
Fig. 1 Wavelet Based image fusion
The wavelets-based approach is appropriate for performing fusion tasks for the following reasons:-
1. It is a multi scale (multi resolution) approach well suited for different image resolutions. Useful in a number of image processing applications including the image fusion.
2. The discrete wavelets transform (DWT) allows the image decomposition in different kinds of coefficients preserving the image information. Those coefficients can be appropriately combined to obtain new coefficients so that the information in the original images is collected appropriately.
3. Once the coefficients are merged the final fused image is achieved through the inverse discrete wavelets transform (IDWT), where the information in the merged coefficients is also preserved.
III. WAVELET PACKET TRANSFORM
The wavelet packet method is a generalization of wavelet decomposition that offers a richer signal analysis. Wavelet packets are used for data compression and noise reduction. For a given wavelet function, we generate a library of bases called wavelet packet bases. Each of these bases offers a particular way of coding signals, preserving energy, and reconstructing exact features. The wavelet packets can be used for numerous expansions of a given signal.
The main difference is Wavelet transform is applied to low pass results (approximations) only and wavelet packet transform is applied to both low pass results (approximations) and high pass results (details).
The discrete wavelet transform (DWT) permits a time-frequency decomposition of the input signal, but the degree of frequency resolution in the DWT is typically considered too small for practical time-frequency analysis. But wavelet packets provide a computationally-efficient alternative with sufficient frequency resolution. Wpspectrum is used to perform a time-frequency analysis of your signal using wavelet packets.
Fig. 2 Wavelet tree decomposition Fig. 3 Wavelet packet tree decomposition
The best basis algorithm uses wavelet packets. For any given signal, the best basis algorithm decides which base represents the signal more efficiently.
1. The best basis algorithm finds a set of wavelet bases that provide the most desirable representation of the data relative to a particular cost function.
2. A cost function may be chosen to fit a particular application. 3. The value of the cost function is a real number.
4. Given two vectors of finite length, a and b, we denote their concatenation by [a b]. This vector simply consists of the elements in a followed by the elements in b.
5. We require the following two properties:
a. The cost function is additive in the sense that K([a b]) = K(a) + K(b) for all finite length vectors a and b.
b. K(0) = 0, where 0 denotes the zero vector.
c. The threshold cost function counts the number of values in a wavelet packet tree node whose absolute value is greater than a threshold value t.
6. When the wavelet packet tree is constructed, all the leaves are marked with a flag. The best basis calculation is performed bottom up (that is, from the leaves of the tree toward the root):
a. A leaf (a node at the bottom of the tree with no children) returns its cost value.
b. As the calculation recurses up the tree toward the root, if there is a non-leaf node, v1 is the cost value for that node. The value v2 is the sum of the cost values of the children of the node.
c. If (v1 <= v2) then we mark the node as part of the best basis set and remove any marks in the nodes in the sub-tree of the current node.
d. If (v1 > v2) then the cost value of the node is replaced with v2.
IV. SINGULAR VALUE DECOMPOSITION
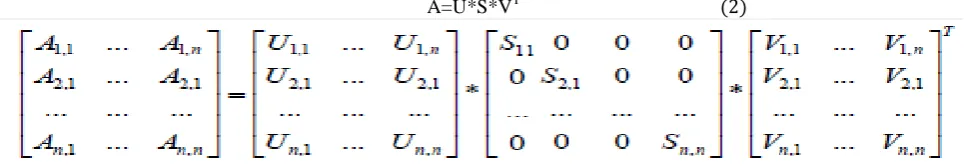
Singular value decomposition is a numerical technique which decomposes the input data into three sub matrices. SVD of an n x n matrix A is defined by the operation:
A=U*S*VT (2)
corresponding pair of singular vectors (SCs) denotes the geometry of that image. Here, U and V are unitary orthogonal matrices and S is a diagonal matrix.
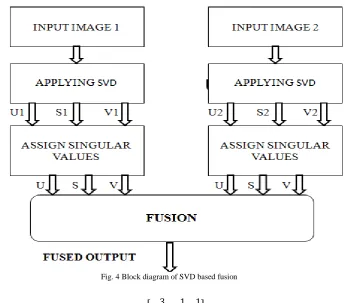
In this method, image fusion is achieved by applying SVD to two different blurred input images. By combining the useful information from these two images, we can produce a more informative and complete image. This can be achieved by applying SVD to the input images that would make the salient information of each of the image. In this method, image is decomposed into 3 components, U, S and V T which contains required information. Here, A is input image, U is left singular vector matrix, Columns of U are eigenvectors of matrix AAT. V is right singular vector matrix, Columns of V are eigenvectors of matrix ATA and S is the diagonal matrix whose diagonal elements are singular values of given signal and these are also called as eigen values of the given signal. These singular values represent the energy of the signal.
With this approach fused image output can be obtained by using the block diagram given in Fig. 4, and considering only certain components. In this technique we assigned different singular values which reduced the number of components from each matrix U, S, V and also preserving the actual image size. At last image fusion is performed using the reduced number of components and thus we can obtain the fused output.
Fig. 4 Block diagram of SVD based fusion
Let a matrix A
A= 3 1 1
−1 3 1
AT=
3 −1
1 3
1 1
AAT= 3 1 1
−1 3 1
3 −1
1 3
1 1
= 11 1
1 11
Next, we have to find the eigenvalues and corresponding eigenvectors of AAT. The eigen vectors are defined by the equation A⃗v = λ⃗v, and applying this to AAT gives us
11 1
1 11 x1 x2 =λ
x1 x2
We rewrite this as the set of equations
11x1+ x2 = λx1
x1+ 11x2= λx2
And rearrange to get
(11-λ)x1 +x2 = 0 x1+ (11-λ)x2 = 0 Solve for λ by setting the determinant of the coefficient matrix to zero,
(11 − λ) 1
1 11 − λ =0
(11- λ)(11- λ)-1.1=0 (λ-10) (λ-12)=0
λ =10, λ=12
Two eigenvalues are λ = 10, λ = 12. Plugging λ back in to the original equations gives us our eigenvectors. For λ = 10 we get
(11-10)x1+x2=0 x1=-x2
x1 = 1 and x2 = −1 since those are small and easier to work . Thus, we have the eigenvector [1,−1] corresponding to the eigen value λ = 10. For λ = 12 we have
(11-12)x1+x2=0 x1=x2
We’ll take x1 = 1 and x2 = 1. Now, for λ = 12 we have the eigenvector [1, 1].
In the matrix below, the eigenvector for λ = 12 is column one, and the eigenvector for λ = 10 is column two.
1 1
1 −1
Finally, we have to convert this matrix into an orthogonal matrix which we do by applying the orthonormalization process to the column vectors.
U=
1 √2
1 √2 1 √2 −
1 √2
ATA= 3 −1
1 3
1 1
3 1 1
−1 3 1 =
10 0 2
0 10 4
2 4 2
Find the eigenvalues of ATA by
10 0 2
0 10 4
2 4 2
x1 x2 x3 = λ x1 x2 x3
Which represents the system of equations
10x1+2x3= λx1 10x2+4x3= λx2 2x1+4x2+2x3= λx2
By solving the equations in the above procedure we get λ=0, λ=10, λ=12. Substituting λ values in the above equations we get the matrix
1 2 1
2 −1 2
1 0 −5
By taking magnitude of each column we get orthogonal matrix
V= 1 √6 2 √5 1 √30 2 √6 −1 √5 1 √30 1 √6 0 −5 √30
When we really want its transpose
VT=
1 √6 2 √5 1 √6 2 √6 −1 √5 0 1 √30 0 −5 √30
For S we take the square roots of the non-zero eigen values and populate the diagonal with them, putting the largest in s11, the next largest in s22 and so on until the smallest value ends up in smm
S= √12 0 0
0 √10 0
A=U*S*VT = 1 √2 1 √2 1 √2 − 1 √2
√12 0 0
0 √10 0
1 √6 2 √5 1 √6 2 √6 −1 √5 0 1 √30 0 −5 √30
= 3 1 1
−1 3 1
The purpose of SVD is not to actually reconstruct the original matrix but to use the reduced dimensionality representation to identify similar words and documents. SVD makes similar items appear more similar, and unlike items more unlike. This can be explained by looking at the vectors in the reduced versions of U and V above.
V. PERFORMANCE EVALUATION
5.1 Mean Square Error (MSE)
It is computed as the mean square error (MSE) of the corresponding pixels in the reference image Aij and the fused
image Bij. It will be nearly zero when the reference and fused images are alike and it will increase when the
dissimilarity increases. i – pixel row index, j – pixel column index, m, n- No. of row and column.
MSE=𝟏
𝐦𝐧
𝐧 𝐣=𝟏 𝐦
𝐢=𝟏 (Aij-Bij)2
5.2 Peak Signal to Noise Ratio (PSNR)
PSNR value will be high when the fused and reference images are alike and higher value implies better fusion.
PSNR=𝟐𝟎 𝐥𝐨𝐠𝟏𝟎(( L2)/(MSE)^0.5)
Where, Lin the number of gray levels in the image.
5.3 Entropy (EN)
Entropy is an index to evaluate the information quantity contained in an image. If the value of entropy becomes higher after fusing, it indicates that the information increases and the fusion performances are improved.
Entropy is defined
as:-EN=− 𝐋−𝟏
𝐈=𝟎 Pi𝐥𝐨𝐠𝟐𝐏𝐢
Where L is the total of grey levels, P is probability distribution of each level.
5.4 Standard Deviation (SD)
Standard deviation is composed of the signal and noise parts This metric is more efficient in the absence of noise. It measures the contrast in the fused image. Fused image with high contrast would have a high standard deviation.
SD=Sum(std(MX1))/256
VI. EXPERIMENTAL RESULTS
The proposed SVD technique is compared in terms of MSE, PSNR, EN, SD. We are considered reference image as Ir
and fused image as If to evaluate the performance of the proposed fusion algorithm. The complementary pair (data set1)
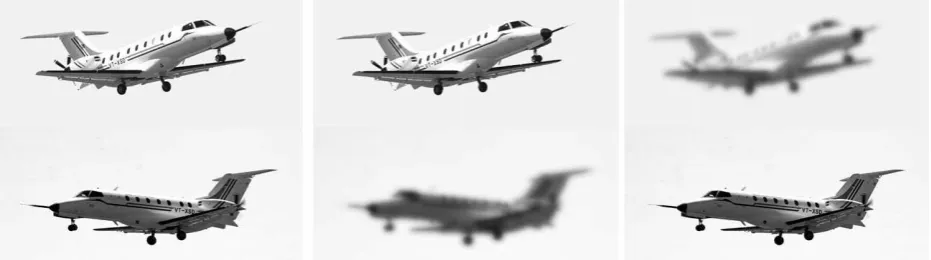
input images I1 and I2 are taken to evaluate the fusion algorithm and these images are shown in Fig. 5(b) and 5(c).The
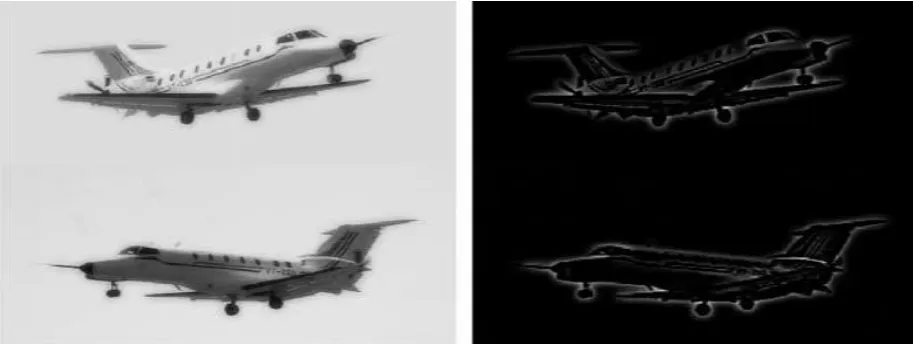
first column in Figs. 6-8 shows fused images and the second column shows the error images. The error is computed as difference between reference image and fused image. The fused and error images by one level of decomposition using SVD, wavelet fusion algorithms and wavelet packet algorithm are shown in Figs. 6, 7, 8 respectively. It is observed that the fused images of SVD and wavelet, wavelet packets are almost similar for these images. The reason could be because of taking the complementary pairs. One can see that the fused image preserves all useful information from the source images.
Fig. 6 Fused and error image using SVD
Fig. 7 Fused and error image using wavelets
Tab.1: Performance evaluation metrics of two methods
Image fusion Techniques RMSE PSNR EN SD
SVD 11.54 37.51 4.65 84.95
Wavelet 11.87 37.39 0 86.28
The performance metrics for evaluating the image fusion algorithms are shown in Table1. The metrics showed in tables in bold font are better among others. From the table it is observed that SVD performed well. The table gives comparison between SVD and wavelet. From the above table we observed that Root mean square error less and Entropy more for SVD which shows better performance.
Tab.2: Performance evaluation metricsof three methods
Image fusion Techniques MSE PSNR EN SD
SVD 0.12 27.34 4.65 84.95
Wavelet 0.14 26.64 4.65 84.50 Wavelet Packet 0.13 26.89 4.67 83.75
The performance metrics for evaluating the image fusion algorithms are shown in Table2. The metrics showed in tables in bold font are better among others. The performance of SVD nearly similar to wavelet and wavelet packets but only difference is it is easy to implement. In SVD the changes do not affect the singular values.
VII. CONCLUSION
A novel image fusion algorithm by SVD has been presented and evaluated. The performance of this algorithm is compared with conventional methods such as Wavelet and Wavelet Packets. It is concluded that image fusion by SVD perform almost similar to wavelets and wavelet packets. Because of using matrices SVD operation is very simple and it is used in many real-time applications. The major advantage of SVD is, singular values in a digital image are highly stable, so they do not change after various attacks. Moreover, SVD does not have a fixed set of basis vectors like FFT and wavelet etc... And its basis vectors depend on the data set.
REFERENCES
[1] V.P.S. Naidu, “Image Fusion Technique using Multi-resolution Singular Value Decomposition”, Defence Science Journal, Vol. 61, No. 5, pp. 479-484, 2011.
[2] Ajay Kumar Bhagat1 and Er. Dipti Bansal, “Image Fusion Using Hybrid Method with Singular Value Decomposition and Wavelet Transform”, ISO 9001:2008 Certified Journal, Volume 4, Issue 7, 2014.
[3] Ms. V.P.Sawant1, “Fusion Algorithm for Images based on Discrete Multi-wavelet Transform”, IOSR Journal of VLSI and Signal Processing (IOSR-JVSP), Volume 2, Issue 3, 2013.
[4] Gagandeep Kour, and Sharad P. Singh, “Low Quality Image Information Enhancement Using SVD Fusion Technique”, International Journal Of Engineering And Computer Science, Volume 2, Issue 11, pp. 3227-3231, 2013.
[5] Deepak Kumar Sahu1 and M.P.Parsai, “Different Image Fusion Techniques”, International Journal of Modern Engineering Research (IJMER) Vol. 2, Issue. 5, 2012.
[6] Asha P. Kurian, Bijitha, S. R., Lekshmi Mohan, Megha M. Kartha, and K. P. Soman, “Performance Evaluation of Modified SVD based Image Fusion”, International Journal of Computer Applications(0975 – 8887), Volume 58, No.12, 2012.
[7] AndrasRovid, Laszlo Szeidl and Peter Varlaki, “The HOSVD Based Domain and the Related Image Processing Techniques”, Volume 5, Issue 3, pp. 157-164, 2011.