Copyright 0 1996 by the Genetics Society of America
The Effects of Variable Mutation Rates Across Sites on the Phylogenetic
Estimation of Effective Population Size
or
Mutation Rate of DNA Sequences
Hong-Wen Deng
and
Yun-Xin Fu’
H u m a n Genetics Center, School of Public Health, University of Texas, Houston, Texas 77225 Manuscript received March 29, 1996
Accepted for publication July 29, 1996
ABSTRACT
Multiple hits at some sites of human mitochondrial DNA sequences suggest that the commonly assumed infinite-sites model can be violated. Under the neutral Wright-Fisher model without recombina- tion and population subdivision, we investigated, by computer simulations, the effect of multiple hits on the estimation of the essential parameter 0 = 4 N a by Fu’s UPBLUE procedure. We found that with moderate mutation rate heterogeneity, UPBLUE performs very well in terms of unbiasness and efficiency. Under extreme mutation rate heterogeneity, if sample size is reasonably large (e.g., >60), UPBLUE is still very satisfactory; otherwise we developed a new correction equation. Given knowledge of the degree of mutation rate heterogeneity, the performance of UPBLUE with the new correction equation was tested to be fairly satisfactory: there is almost no bias and the sampling variance is only slightly higher than the theoretical minimum variance. Thus, with an appropriate correction, UPBLUE is relatively robust to the multiple hits. In genealogies reconstructed by UPGMA, we found that the total length of branches directly linked to the tips is underestimated, and those far away tend to be overestimated, while the total length of all branches is not biased.
P
OLYMORPHISM at the DNA nucleotide level is the ultimate resolution of information on genetic vari- ation to study population evolution. A prominent pa- rameter in stochastic population genetics theory of evo- lution is 0, which is equal to 4 N g for diploid and 2Nepfor haploid genomes, where Ne is the effective popula- tion size and p is the mutation rate per DNA sequence (gene, locus) per generation. Given 8,
N,
can be esti- mated if p is known or vice versa. Inferences about 8 are commonly based on two quantities easily obtainable from a sample of n DNA sequences from a population. One is the average number of nucleotide differences in all pairwise comparisons (ii, known as the TAJIMA’S estimator), the other is the segregating (polymorphic) sites K(8
= K/a,, known as the WATTERSON’S estima- tor), where1 1
a,= 1
+ - + * - . + - .
2 ( n - 1)
Although easy to compute, these two estimators are not efficient, having large variances (WATTERSON 1975; TA- JIMA 1983); especially, the variance of ii does not dimin-
ish with an increasing sample size.
Recently, FU (1994a,b; also see LI and Fu 1994) devel- oped two more efficient estimation procedures for 8,
by making better use of the information in a sample. One is the phylogenetic estimator (Fu 1994a), which is
Curresponding author: Hong-Wen Deng, Human Genetics Center,
School of Public Health, University of Texas, Houston, TX 77225.
E-mail: [email protected]
’
E-mail: [email protected]Genetics 144. 1271-1281 (November, 1996)
based on the reconstructed genealogy for the sampled n DNA sequences. The other is the frequency estimator (Fu 1994b), which is based on classifylng segregating nucleotide sites into mutations of various classes, and making use of their frequencies. It is developed under the framework of a combination of coalescent theory, general linear model and Monte-Carlo integration, and can be used under a variety of population genetics mod- els. However, under the neutral infinite-sites Wright- Fisher model without recombination and population subdivision, it is slightly less efficient than the phyloge- netic estimator. The phylogenetic estimator uses more information from a sample and is nearly the most effi- cient estimator in practice (Fu 1994a,b). We thus study its statistical properties when some ideal assumptions necessary for its development are not fulfilled.
1272 H.-W. Deng and Y.-X. Fu
rectly, multiple hits under mutation rate heterogeneity were not considered by them.
At the interspecific level, mutation rate heterogeneity is not considered by many procedures in molecular evolu- tion, which may have serious consequences (OLSEN 1987; PALUMBI 1989; JIN and NEI 1990; LI et al. 1990; HASEGAWA and FUJIWARA 1993; KUHNER and FELSENSTEIN 1994; TA- TENO et al. 1994). Therefore, their effects on molecular clock calibration, phylogenetic inference, distance calcu- lation and transition bias estimation have attracted a growing number of research efforts (e.g., VAN DE PEER et al. 1993; YANG 1993; WAKELEY 1994; GU d al. 1995; RZHETSKY 1995). At the intraspecific level, multiple hits for a DNA sequence are less common unless there exists mutation rate heterogeneity. Although the effect of muta- tion rate heterogeneity is expected to be less serious com- pared with that at the interspecific level, it has not been studied for the estimation procedures of 8.
Under the neutral Wright-Fisher model without re- combination and population subdivision, we study the effects of multiple hits due to mutation rate heterogene- ity among sites on Fu's (1994a) UPBLUE procedure of phylogenetic estimation of
8.
Then we develop a new correction procedure for the adverse effects of multiple hits. Finally, we test the performance of the new correc- tion procedure.MODEL OF MUTATION RATE HETEROGENETITY AMONG SITES
Gamma distribution has been used widely to describe substituttion rate variation among different sites (UZ- ZELL and CORBIN 1971; NEI 1987; KOCHER and WILSON 1991; TAMURA and NEI 1993; GU et al. 1995; RZHETSKY 1995; ARE-BROSOU and EXCOFFIER 1996). Letting x be a random variable for the mutation rate at a nucleotide site, we use the following gamma distribution, which is determined by parameters a and
0,
to model x across sites:where
r(a)
is the gamma function defined byT ( a )
=y""e?dy. The mean (X) and the variance (02) of the gamma distribution are respectively, A =
a0
and a* =a@', and the relative magnitude of the rate heterogene- ity can be measured by the coefficient of variation of x
CVX(CVX =
6
=i)
The smaller the a , the larger the mutation rate hetero- geneity. a = 0.1, 0.5 and 1.0 may represent extreme, moderate and small rate heterogeneity, respectively (TAMURA and NEI 1993; WAKELEY 1993; TATENO et al.
1994; Gu et al. 1995; SULLIVAN et al. 1995). In particular, when CY = m, the substitution rates are uniform among
sites. The whole sequence mutation rate ( p ) is the sum of the mutation rates of all its L nucleotide sites; i.e., p
=
Zf:kl
x,, where xi is the mutation rate of the ith site. It is well known that the sum (such as p here) of L gamma-distributed random variables of parameters a and0,
also has a gamma distribution of parametersLa
and /3, with a coefficient of variation CV = (1/&).
ESTIMATION OF 0 WHEN THE GENEALOGY
OF A SAMPLE IS KNOWN
By genealogy, we mean collectively the topology con- necting the sequences in a sample to their most recent common ancestor, the branching orders in the topol- ogy and the number of mutations on each branch of the topology. The genealogy of a sample can be recon- structed by the existing phylogenetic reconstruction methods, and it is possible that the reconstruction is of high resolution. The estimator of 6'under a known genealogy thus represents the best that one can aim to achieve in practice. Therefore, studying such an estima- tor can serve as a starting point to estimate 8 from an estimated genealogy as in Fu (1994a).
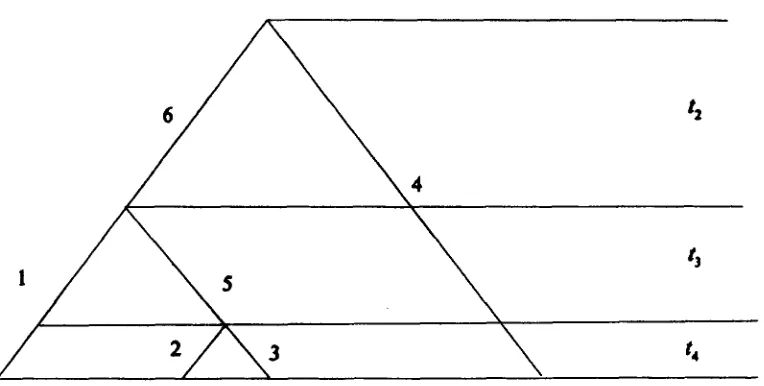
Theoretical background Let t k be the time duration (the number of generations) required for k sequences to coalesce into k - 1 sequences ( k
>
1) (Figure 1). Under the neutral Wright-Fisher model (Ne remains constant, all mutations are selectively neutral), without recombination and population subdivision, tk is a ran- dom variable following an exponential distribution(HUDSON 1982; KINGMAN 1982; TAJIMA 1983)
k ( k
-
1)f l t k )
k ( k - 1 )
4N, exp(- 4N, t k )
.
(2) Among the several definitions of N, (EWENS 1979), in- breeding effective population size seems to be the most suitable one in Equation 2 (Fu 1994a).There are exactly
2
( n - 1) branches in a genealogy of n DNA sequences, whose topology can be completely characterized by the following2
( n - 1) index variables (Fu 1994a). For branch i, we have n - 1 index variablesS,k ( k =
2,
.
..
,
n) such that sik = 1 if the branch has a segment during the time t k , and Sik = 0 otherwise. For illustration, the topology in Figure 1 is completely char- acterized by the 18 index variables (Table 1).Assume the number of mutations on branch i (n,) follows a Poisson distribution with parameter p l j , where
1, is the time length of branch i, and
The mean and the variance of ni are, respectively (Fu 1994a),
E ( ~ ~ ) =
ewi,
(4)1273
and the covariance of the numbers of mutations on branch i and j is (Fu 1994a)
cov (ni, nj) = & t P , (6)
where
The means of n,’s are linear functions of
8,
the variance of them and the covariance among them are quadratic functions of 8. Thus Fu’s (1994a) iterative BLUE (best linear unbiased estimator) procedure can be applied to these 2(n - 1) variables to obtain8,
the BLUE of 8. The lower bound of the variances of all possible unbi- ased estimator of 8 is (Fu and LI 1993)0
k= 1 8 + k
v .
rnln = n-11
(8)
The efficiency of the BLUE procedure under multiple hits can be measured against Vmin.
Simulations: Genealogies were simulated for DNA sequences with multiple hits due to mutation rate het- erogeneity across sites, and DNA sequence evolution was monitored along branches on each genealogy.
1. A DNA sequence of length L was generated ran-
TABLE 1
Index variable sik)s for the genealogy in Figure 1
k
i 2 3 4
1 0
2 0
3 0
4 1
5 0
6 1
~~
1
0 0
1 1
0
-
1
1 1
1 0 0
FIGURE 1.-An example of the topology of a geneal- ogy of four DNA sequences. The branches are num- bered consecutively from 1 through 6. The total time duration is divided into three intervals ti, b and t 4 ,
according to the branching events and the existing number of sequences dur- ing the time intervals.
2.
3.
4.
5 .
6.
domly as the most recent common ancestral se- quence of the n sequences sampled from a popula- tion.
Mutation rate at each site p, ( 1 = 1,
2,
. . .
, L ) was determined by random sampling from a gamma dis- tribution of parameters CY andp.
The mutation rate for the whole sequence p was equal toE;:,,
pi. For a given sample size n, p and N,, a number of genealogies were randomly constructed according to the coalescent theory (HUDSON 1982; KINCMAN 1982; TAJIMA 1983). Briefly, the topology of the gene- alogy was constructed, from the n nodes (represent- ing n sequences sampled) backward in time, by ran- domly joining two nodes at a time, until only one (representing the most recent common ancestor) was left. The time interval between two successive node joining events ( t k , k = 2, 3,. . .
,
n ) was deter- mined by a random variable from the exponential distribution of Equation 2.For each genealogy, s,k’s were inferred. The values of the time length of all the branches 1,’s were com- puted by Equation 3, and the w,’s and +s’s by Equa- tion
7.
For branch i ( i = 1, 2,
. . .
, 2n - 2), the mutations at each site were determined by a Poisson process, with its parameter being the product of 1, and p, ( 1 = 1, 2,. . .
,
L ) . To focus our study on the effects of multiple hits, we chose to use the simplest [JUKES CANTOR’S (1969) one-parameter] mutation model; in which, given a mutation event, the original nucle- otide has an equal probability to mutate to the other three. The total mutations of the sequence ( n , ) of branch i was the sum of the mutations across sites and recorded. The DNA sequences of all the nodes were determined from top down to the bottom tips (representing the sample from the population) of the genealogy.1274 H.-W. Deng and Y.-X. Fu
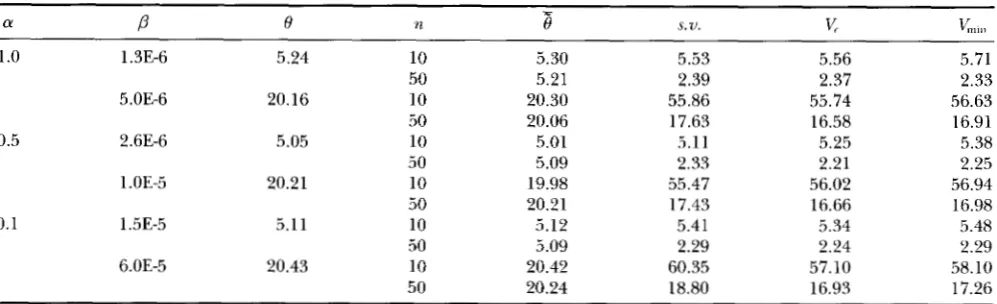
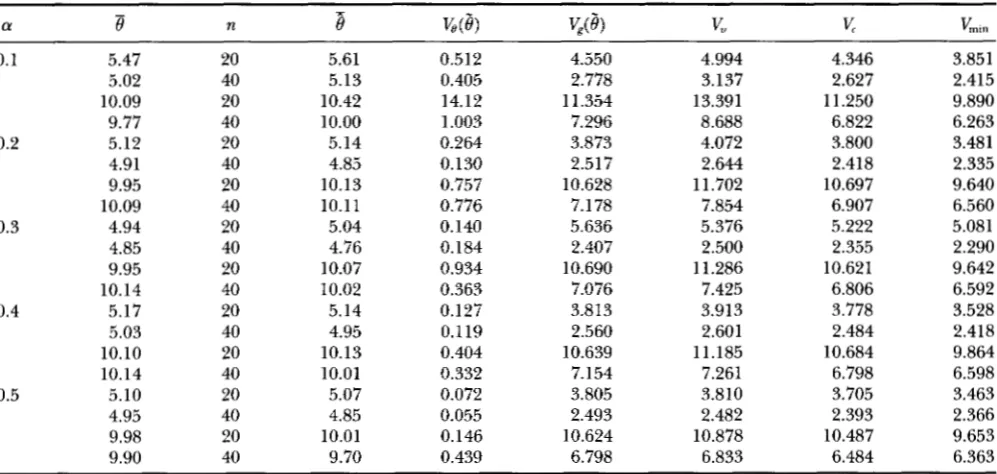
TABLE 2
Estimation of 8 with known genealogy under multiple hits due to mutation rate heterogeneity
1
.o
1.3E-6 5.24 1050
5.OE-6 20.16 10
50
0.5 2.6E-6 5.05 10
50
1 .OE-5 20.21 10
50
0.1 1.5E-5 5.1 1 10
50
6.OE-5 20.43 10
50
5.30 5.21 20.30 20.06 5.01 5.09 19.98 20.21 5.12 5.09 20.42 20.24
5.53 2.39 55.86 17.63 5.11 2.33 55.47 17.43 5.41 2.29 60.35 18.80
5.56 2.37 55.74 16.58 5.25 2.21 56.02 16.66 5.34 2.24 57.10 16.93
5.71 2.33 56.63 16.91 5.38 2.25 56.94 16.98 5.48 2.29 58.10 17.26
a and
P
aLe the parameters o,f the gamma distribution. With known genealogy, only one 6' is simulated for each gamma distribution. 6' is the average of 0 estimated over the sipulated genealogies.x,,,,
is lower bound of variances determined by Equation 8. is the approximate theoretical variance of 0; it is determined by Equation 9 o,f FU (1994a), employing the variance- covariance structure determined by Equations 5 and 6. s . ~ . is the sampling variance of6'.
Each estimator was obtained from 2000 simulated genealogies. n is the sample size of DNA sequences. For simulations in this table, sequence length L = 1000, N,,= 1000. 6' = 4 Npp, where p is the sequence mutation rate, determined as described in the text. Multiple hits were observed in simulations for all the parameter sets in this and the following tables.
Results From Table 2, it is evident that under multi- ple hits due to the rate heterogeneity, with known gene- alogies, the BLUE performs as well as under the infinite- sites model. There is no bias in 0 estimation, and the sampling variance is not different from Vmi,, and the theoretical variance derived under the infinite-sites model
(v).
These results should not be surprising. In infinite-sites model, the mutation events separating each pair of DNA sequences are known accurately by counting the number of segregating sites. However, as- suming a known genealogy, the mutation events are known exactly, thus multiple hitsper
se do not pose any problem in 0 estimation.THE PHYLOGENETIC ESTIMATOR OF 6'
In reality, the genealogy of sampled DNA sequences is unknown and must be estimated to apply the BLUE to estimate 0. Under the infinite-sites model, we can obtain an accurate distance matrix, upon which treeing
methods such as UPGMA (unweighted pair-group
method with arithmetic mean, NEI 1987) can be ap- plied. The genealogy reconstruction by UPGMA will cause an under estimation of 0, which can be corrected by (Fu 1994a)
8
= ( 0 . 0 3 3 5 a+
0.998?&)', (9)where is the estimator obtained by applying BLUE to the genealogy reconstructed by UPGMA.
8
is shown to be nearly unbiased with a variance close to Vmirr (Fu 1994a).With multiple hits, obtaining an accurate distance matrix is not easy. There are several studies on recov- ering genetic distance between interspecific sequences
(GOLDING 1983; TAMURA and NEI 1993; Gu et al. 1995; RZHETSKY 1995) in the presence of multiple hits under rate heterogeneity. They either depend on the inferred parameters of the underlying distribution of mutation rates across sites, or are limited to a few sequences due to the demanding computational requirement. Unbi- ased estimation of the parameters of the underlying distribution of mutation rates across sites is difficult. For studies of within-population evolution, the number of sequences sampled is often on the order of dozens, or even one hundred (e.g., VIGILANT et d . 1991) and the divergence among them is often relatively small
(compared to the interspecific data). In the absence of a simple method to compute distance with multiple hits under rate heterogeneity, JUKES-CANTOR'S (1969) method (which assumes constant mutation rates across sites) is chosen. Hence, the bias in estimating distance, thus likely 0 is expected. The question is how serious the bias is going to be, i.e., its direction and magnitude. Furthermore, can the bias be satisfactorily corrected?
Simulations: Random determination of mutation rates across sites from a gamma distribution, thus the p , is likely to affect the degree of bias of distance and 0 estimations if the sequence length (I,) is not long enough. Therefore, for a given gamma distribution, a
Mutation Rate and Population Size 1275
were determined as described in the previous section. We applied JUKES-CANTOR’S (1969) formulae to these sequences to reconstruct the distance matrix. JUKES CANTOR’S (1969) multiple mutation correction formula is
K =
-x
In (1 -X p ) ,
where K is the number of substitutions per site since the divergence of the two sequences, and
p
is the pro- portion of different nucleotides between them.There are a number of treeing methods for recon- structing phylogenetic relationship among different species (NEI 1987). Their relative performance for re- constructing genealogy from within-population DNA sequence data is not clear. The maximum likelihood method with a molecular clock may be the best choice from a theoretical point of view, but is computationally impractical when n is large or many genealogies have to be studied. The UPGMA is computationally simple and only requires that the evolution rates of different lineages are constant, which is met in this study and most likely by DNA sequences within populations or species. Thus, it was applied to the distance matrix to reconstruct the genealogy, from which sik’s were in- ferred, 1,’s were thus computed by Equation 3, and w,’s and
6;s
by Equation7.
The branch lengths of the re- constructed genealogy (n,’s) were taken to be the ex- pected number of mutations on the branches. Fu’s (1994a) BLUE procedure was applied to these 2 ( n -1) random variables (n,’s) to obtain the BLUE estimator of 8 with the UPGMA-reconstructed genealogy
(ao),
and the corrected estimatord
by Equation 9. By one- way ANOVA, the variation of8,
andd
was partitioned into that due to different 8( &), and that due to differ- ent genealogy (V,).The distance: Genealogy reconstruction by UPGMA
per
se does not result in an underestimation of the total branch length of the genealogy ( d ) . However, it under- estimates the total length of branches that are directly linked to the tips of the genealogy and overestimates those that are far away from the tips (Figure 2). This is because UPGMA, at each step, joins two nodes of minimum distance that are not necessarily the two nodes that coalesced, due to stochastic mutational oc- currences. Therefore, UPGMA tends to underestimate the lengths of branches closer to the tips and overesti- mate those closer to the root. Since lengths of branches closer to the tips of the genealogy tend to have smaller variances (Equations 5 and7),
they have higher weight on the outcome of the BLUE procedure. This explains why the UPGMA does not cause a biased estimation of(1, but when combined with BLUE procedure
(UPBLUE), results in an underestimate of 8, even un- der the infinite-sites model (Fu 1994a).
The distance computed byJUKES-CANToR’s formulae underestimates the true distance, as reflected by the underestimation of the total branch length of the re-
J
1.1
-
1.0-
0.9
-
0.8
0 2 6 8 10
Mutation size i
FIGURE 2.-The relationship of the ratio of the total num- ber of i mutations of the UPGMA reconstructed genealogy to
that of the true genealogy (Y-axis) and the mutation size i
(X-axis). A mutation is of size i (Fu 1994b) if it is has exactly i descendents in the sample. The larger the i of a mutation size, the further the branch where it occurs tends to be away from the tips of the genealogy, vice versa. Each dot in the plots is the mean of 10,000 simulations, in which the distance between each pair of sequences is known without error. The deviation of the ratio from 1.0 is totally due to genealogy reconstruction by UPGMA. The total branch length of the reconstructed genealogy equals that of the true genealogy in the above 10,000 simulations. For simulations in this plot, n is 10, 0 is -5.0, L is 600, and N, is 1000.
1276 H.-W. Deng and Y.-X. Fu
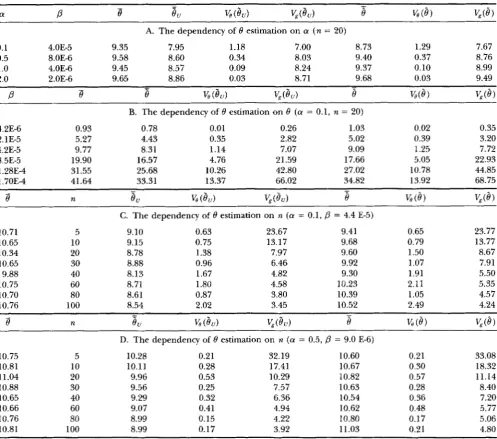
TABLE 3
T h e bias of distance estimation
A. The dependency of distance estimation bias on a ( n = 20)
0.1 4.0E-5 9.35 0.88 3.5E-4 6.2E-3
0.5 8.OE-6 9.58 0.95 0.0E-4 2.5E-3
1 .0 4.0E-6 9.45 0.97 0.0E-4 2.3E-3
2.0 2.0E-6 9.65 0.98 0.0E-4 1.9E-3
P
B
B. The dependency of distance estimation bias on 8
( a = 0.1)
2.1E-5 5.27 0.91 0.0E-3 6.0E-3
4.2E-5 9.77 0.88 0.2E-3 6.2E-3
8.5E-5 19.90 0.80 0.4E-3 8.2E-3
1.3E-4 31.55 0.75 0.9E-3 9.1E-3
1.7E-4 41.64 0.71 0.7E-3 9.7E-3
e
nC. The dependency of distance estimation bias on n
( a = 0.1,
P
= 4.4E-5)10.71 5 0.88 0.3E-3 1 1.5E-3
10.65 10 0.87 0.4E-4 8.3E-3
10.34 20 0.87 0.2E-3 6.4E-3
10.65 30 0.86 0.3E-3 5.7E-3 9.88 40 0.86 0.2E-3 5.3E-3 10.75 60 0.86 0.4E-3 4.4E-3 10.70 80 0.86 0.1E-3 3.9E-3 10.76 100 0.84 0.2E-3 3.9E-3
d is the total length of the true genealogy,
d
is that of the reconstructed genealogy. For a given gamma distribution, 208’s were simulated with r,lea_n 8. For each simulated 8, 400
genealogies were simulated. d / d is the mea? of the d / d over
all simulated samples. The total variation of d / d is partitioned, by one-way ANOVA, to the components due to 0 ( & ( d / d ) ) and different genealogy ( V , ( d / d ) ) . For simulations in this
table, L = 600, and N, = 1000.
estimation of 8, since the total mutational events are underestimated. For the simulated parameter set in Ta- ble 4, the trends of the degree of underestimation of 0 by
e,,
are similar to those of the distance estimation (Table 3 ) . Everything else being about the same, the smaller the a , or the higher the 0, or the larger the n,the larger the underestimation of 0 by
a[,.
The corrected estimator
6
with Equation 9: It is gen- erally underestimated, but not always (Table 4). For the simulated parameter set, everything else being about equal, the magnitude of bias (if any) will increase with a decreasing a , and an increasing 0. But unlike the bias of the distance and8(,
estimations, the bias of8
de- creases with an increasing n, due to the correction for n by Equation 9. When a is not so small ( a 2 0.5) and 0 is of moderate value(-lo),
the bias is very small(almost negligible compared with the variance), even with only 20 sequences (Table 4A). When a = 1.0 or 2.0, there is essentially no bias (for the true
0
of -10 and n of20),
because the mutation rate heterogeneity is small and multiple hits are relatively rare (though they exist). Even for a rather small a ( a = O . l ) , when8
is reasonably small(0
5 5.0),8
is nearly unbiased. When 0 gets larger(0
2 20.0), the bias oft!? is relatively large (Table 4B). However, even for LY = 0.1 with large sample sizes ( n exceeds 60), the bias oft!?
is very small (Table 4, C and D).
With n = 100 anda
= 0.1,t!?
is essentially unbiased; despite that Equation 9 was for correcting bias due to genealogy reconstruction by UP- GMA alone, and there is relatively large bias in d estima- tion then (Table 3C). Thus, with UPBLUE and the cor- rection Equation 9, the bias in estimating 0 due to bias of distance estimation and error in reconstructing gene- alogy are not simply additive. The bias in estimating 0 due to bias in distance estimation is more pronounced when n is small (Table 4, C and D ) .The variation of
6”
and6:
The variation of8(,
and8
due to random 0’s ( & ) is generally of relatively small importance, compared to that from random genealogy construction (V,) (Table 4). This suggests that the cor- rection procedure we are going to develop below will be relatively robust to the sampling of mutation rates across sites from a gamma distribution. With an increas- ing n, V, decreases monotonically, while V, does not change significantly. The larger variation of V, when a= 0.1 relative to a = 0.5 may be due to the larger coefficient of variation of p. Recall that pLdistributed as a gamma distribution with CV, =
l/dL*a,
where L is the sequence length.In summary, when n is sufficiently large (e.g., n 2 60) or the rate heterogeneity is not extreme (e.g., a 2 0.5), the UPBLUE procedure of FU (1994a) with the correction Equation 9 can still provide a satisfactory estimate of 0. Otherwise, new correction formulas is needed to obtain a better estimation.
CORRECTION FOR THE MEAN AND
VARIANCE OF ESTIMATION OF 8
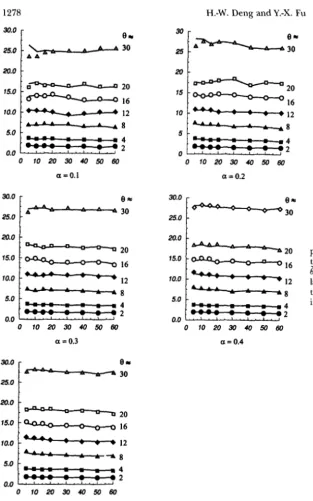
Correction for the mean: Simulations were per- formed for different parameter combinations of a , 0 and n, with other conditions being the same as de- scribed in the last section. Some results are shown in Figure 3. Clearly,
6 ,
is, on average, an underestimate of 0. The degree of underestimation is a function of n,Mutation Rate and Population Size
TABLE 4
Estimation of 8 with the UPGMA reconstructed genealogy
1277
a
P
8-
8,
v, (8,)
&(e,)
e
-%(e)
&(e,
A. The dependency of 8 estimation on a ( n = 20)0.1 4.OE-5 9.35 7.95 1.18 7.00 8.73 1.29 7.67
1
.o
4.OE-6 9.45 8.57 0.09 8.24 9.37 0.10 8.992.0 2.OE-6 9.65 8.86 0.03 8.71 9.68 0.03 9.49
0.5 8.OE-6 9.58 8.60 0.34 8.03 9.40 0.37 8.76
P
8s
v,
(e") &(e")
e
%(e)
& ( e )- -
B. The dependency of 0 estimation on 8 ( a = 0.1, n = 20)
4.2E-6 0.93 0.78 0.01 0.26 1.03 0.02 0.35
2.1 E-5 5.27 4.43 0.35 2.82 5.02 0.39 3.20
4.2E-5 9.77 8.31 1.14 7.07 9.09 1.25 7.72
8.5E-5 19.90 16.57 4.76 21.59 17.66 5.05 22.93
1.28E4 31.55 25.68 10.26 42.80 27.02 10.78 44.85
1.70E4 41.64 33.31 13.37 66.02 34.82 13.92 68.75
-
8
n8,
v, (8")
&(&I)e
%(e)
v,(e)
-C. The dependency of 0 estimation on n ( a = 0.1,
p
= 4.4 E-5)10.71 5 9.10 0.63 23.67 9.41 0.65 23.77
10.65 10 9.15 0.75 13.17 9.68 0.79 13.77
10.34 20 8.78 1.38 7.97 9.60 1.50 8.67
10.65 30 8.88 0.96 6.46 9.92 1.07 7.91
9.88 40 8.13 1.67 4.82 9.30 1.91 5.50
10.75 60 8.71 1.80 4.58 10.23 2.11 5.35
10.70 80 8.61 0.87 3.80 10.39 1.05 4.57
10.76 100 8.54 2.02 3.45 10.52 2.49 4.24
n
8,
v,
(8")
v , ( & J )e
v,
(8)
& ( e )8
- -D. The dependency of 8 estimation on n ( a = 0.5,
P
= 9.0 E-6)10.75 5 10.28 0.21 32.19 10.60 0.21 33.08
10.81 10 10.11 0.28 17.41 10.67 0.30 18.32
11.04 20 9.96 0.53 10.29 10.82 0.57 11.14
10.88 30 9.56 0.25 7.57 10.63 0.28 8.40
10.65 40 9.29 0.32 6.36 10.54 0.36 7.20
10.66 60 9.07 0.41 4.94 10.62 0.48 5.77
10.76 80 8.99 0.15 4.22 10.80 0.17 5.06
10.81 100 8.99 0.17 3.92 11.03 0.21 4.80
- ~ ~~
The simulation conditions ?re as described in the legend to Table 3.
8,
is the average ofe , ,
and8
is the average of8
over all the simulated samples. V,(e,)
and&(e,)
are, respectively, the variatiqn of 8, due to the random determination of 8 from the gamma distribution and the random genealogy construction, and V, ( 8 ) and& ( e )
are similarly defined, respectively.- -
- 0 . 0 1 1 3 d x
+
0.971& Note that in the above equations, the larger the a , the smaller are the terms involving a , which is consistent with the previous simulation results that the larger the0.0168 a , the smaller the bias introduced by multiple hits under
+
-
&*a - 0'00583-)
a ' (lo) the rate heterogeneity in 8 estimation. It is noted thateven if a tends to infinity, the coefficients of
d
x
and6
in Equations 9 and 11 do not agree with each other exactly. This is largely because Equation 11 was con- structed for the distance corrected for multiple hits byJUKESCANTOR'S (1969) method when n 5 60, while
.
(11) Theoretical variance of the estimation of 8: In the simulations, the sampling variance of8
comes from twoa sources: one is the random determination of 8 from
& i 2
Thus, one can obtain a n unbiased (or nearly unbiased) estimate of 0 by the following equation:
e
= ( 0 . 0 1 1 3 f i+
d&
- 0.0168 2 Equation 9 was for the true distance when n 100. 0.00583H.-W. Deng and Y.-X. Fu
20.0
1
15.0
1
aOQO-"-o-o
160
- 20
10.0 " 6 12
5.0
1
:
- 40.0 -2
0 1 0 2 0 3 0 4 0 5 0 6 0
a = 0 . 1
30.0
-
e =
' a
- 30
25.0
-
20.0
-
-
20
10.0
-
-
12 15.016
. -R
-2 0.0
0 1 0 2 0 3 0 4 0 5 0 6 0
a = 0.3
30.0 e r 25.0
1
30
5*0
1
m?
4
0.0
0 1 0 2 0 3 0 4 0 5 0 6 0
a = 0.5
201
l5
. 16
10
-
-
12 :---A8I-;
00 1 0 2 0 3 0 4 0 5 0 6 0
a = 0.2
5.0
-4
-2
0.0
0 1 0 2 0 3 0 4 0 5 0 6 0
a = 0.4
the gamma distribution ( & ( e ) ) , the other is the ran- dom genealogy determination ( Vg(8)). Phylogeny re- construction by UPGMA alone does not inflate the sam- pling variance of
8
(Fu
1994a). The approximate theoretical variance ofe
computed by Equation 9 ofFu
(1994a), using the variance-covariance structure of Equations 5 and 6, is for constant p, thus only approxi- mates
If,(&.
However, the total sampling variance of6
in the simulation may be approximated by taking into consideration that 0 is variable. Under the variable p, the corresponding Equations 4-6 are as follows:E ( % ) =
E,[E(n,/p)I
= w,*4N*E(p), (12)a:, = E , [ E ( n : ' / p ) ] - E'(nt) = 4N&(p)wi
+
Cbij(4N)*x
E($)+
W34N)*(E(PL')-
f % p ) ) = Wi4N6.W)+
+ti(4~p)*E(p')+
WT(~N~)'C~*(P), (13)FIGURE J.-Rel?tionship among the mean 8, sam- ple size n, mean 8 , and a. On each plot, Y-axis is :he mean BLi, X-axis is n. Each dot is the mean of 8" over 20 simulated 8's with 400 genealogies simu- lated for each 8. The curves are the regression Equa- tion 10. The number on the right side of each curve indicates the approximate simulated mean 8's.
COV nj) = Ep[E(%inJ~)l - E(ni)E(yj) = #,1(4Ne)*
X E(pL2)
+
w ~ u ~ ( ~ N ~ ) ' ( E ( P * ) - ~ ' ( p ) ) = +ii(4Ne)'X E($)
+
w,uj(4Np)'a'(p), (14) where wI)s and4 ; s
are determined by Equation 7. Note, if p is constant, a'(p) = 0, E ( p * ) = E ' ( p ) , Equations 12-14 recover Equations 4-6. If the mutation rates across sites follow a gamma distribution with parameters a andp
and the sequence length is L, p has a gamma distribution of parameters L*a andp.
Then in the above equations, E ( p ) =Lap,
a'(p) =I
&
'
.
0.3
0.4
0.5
Mutation Rate and Population Size 1279
TABLE 5
Properties of the BLUE estimates of 8 with the new correction Equation 11
-
CY 8 n
B
&(e)
v,@)
Vuv,
VL”0.1 5.47 20 5.61 0.512 4.550 4.994 4.346 3.851
5.02 40 5.13 0.405 2.778 3.137 2.627 2.415
10.09 20 10.42 14.12 1 1.354 13.391 11.250 9.890
9.77 40 10.00 1.003 7.296 8.688 6.822 6.263
0.2 5.12 20 5.14 0.264 3.873 4.072 3.800 3.481
4.91 40 4.85 0.130 2.517 2.644 2.418 2.335
9.95 20 10.13 0.757 10.628 11.702 10.697 9.640
10.09 40 10.11 0.776 7.178 7.854 6.907 6.560
4.94 20 5.04 0.140 5.636 5.376 5.222 5.081
4.85 40 4.76 0.184 2.407 2.500 2.355 2.290
9.95 20 10.07 0.934 10.690 11.286 10.621 9.642
10.14 40 10.02 0.363 7.076 7.425 6.806 6.592
5.17 20 5.14 0.127 3.813 3.913 3.778 3.528
5.03 40 4.95 0.1 19 2.560 2.601 2.484 2.418
10.10 20 10.13 0.404 10.639 11.185 10.684 9.864
10.14 40 10.01 0.332 7.154 7.261 6.798 6.598
5.10 20 5.07 0.072 3.805 3.810 3.705 3.463
4.95 40 4.85 0.055 2.493 2.482 2.393 2.366
9.98 20 10.01 0.146 10.624 10.878 10.487 9.653
9.90 40 9.70 0.439 6.798 6.833 6.484 6.363
The simulation conditions are as described in the legend to Table 4. V , is the total variance of 8 when sequence mutation rate varies as in the simulation. It is co-mputed by Equation 9 of Fu (1994a), using the variance-covariance structure determined
by Equation 13 and 14, substituting 8 in the Equation
8.
V , is the variance of 8 from constant putation rate. It is similarlyobtained, except that it uses the variance-covariance structure determined by Equations 5 and 6. 0 is the mean of 0 estimates using correction Equation 11. The other notations are the same as in Table 4.
ased. The fairly small bias of
e
is unlikely to be signifi- cant compared to its variance. The theoretical variance computed by using the variance-covariance matrix of Equations 13 and 14 ( V u ) closely approximates the total sampling variance of8
(V,(e)+
V,(e)), though slightly smaller. Similarly, the theoretical variance computed by using the variance-covariance matrix of Equations 5 and 6(3)
approximates V,(e), though smaller. However, V,(@ is always between V , and Vu, thus the latter two quantities may provide an interval estimate for&(e).
In practice, the mutation rate of a DNA sequence is normally constant within a population or a species. Thus in using UPBLUE, the sampling variance of 8estimation only comes from random genealogy deter- mination and may be approximated by V , ; or at least, its upper and lower bounds may be provided by
v,
andV,,
respectively. Encouragingly,Q(6)
is not much larger than the theoretical minimum variance ( Vmin), espe- cially when n is not so small ( n = 40).Therefore, when n is not large ( n 5 60), and the rate heterogeneity is extreme ( a 5 0.5), the UPBLUE procedure with correction Equation 11 can provide a nearly unbiased estimation of 8, with its sampling vari- ance very close to Vmin.
DISCUSSION
The present study revealed that, with multiple hits under mutation rate heterogeneity across sites, Fu’s
(1994a) UPBLUE procedure will sometimes result in a conservative (under-) estimation of the true
8.
However, only with extreme mutation rate heterogeneity, plus a relatively small sample size n, will the bias be significant. Even then, new correction equation can be constructed to be used in UPBLUE to yield a very efficient and nearly unbiased estimate of 9.In practice, if n is large
(.g.,
n 2 60), Fu’s (1994a) UPBLUE can be used directly to yield a nearly unbiased and efficient estimate of 8; otherwise, it is necessary to check if there are multiple hits due to the rate heteroge- neity across sites. With multiple hits, if the distribution of the mutation changes per site follows a Poisson distri- bution, the rate heterogeneity is not suggested and JUKES-CANTOR’S method may be used to reconstruct thedistance matrix, upon which Fu’s (1994a) UPBLUE may be used directly. If mutation rates across sites con- form to a gamma distribution, the number of the muta- tional changes per site should follow a negative bino- mial distribution (a well known result). Data analysis for within- and between-specific hypervariable DNA se- quences often revealed such a pattern
(.g.,
KOCHERand WILSOM 1991; TAMURA and NEI 1993; WAKELEY
1280 H.-W. Deng and Y.-X. Fu
ployed to obtain a nearly unbiased 0 estimate and its approximate sampling variance.
Since our main purpose is to investigate the qualitative effects of multiple hits under the rate heterogeneity on the phylogenetic estimation of 0, we used the simplest ( JUKESCANTOR’S one-parameter) mutation model. How- ever, the same logic and procedure should be easily ex- tended to incorporate more complex mutation models in the study, such as KIMURA’S (1980) two-parameter mu- tation model etc. IfJUKES-CANTOR’s one-parameter mu- tation model is seriously violated, the application of the correction Equations 11 with UPBLUE will likely result in a biased estimation. The investigation of the perfor- mance of UPBLUE of the phylogenetic estimator of 0 with more complex mutation models should be of some interest.
This study was performed under the neutral Wright- Fisher model without population subdivision and re- combination, which some real samples of DNA se- quences are likely to violate to a certain degree. When there is apparent population subdivision and recombi- nation, the phylogenetic estimator of 0 may be mis- leading due to the difficulty of reconstructing geneal- ogy (HUDSON and KAPLAN 1985; Fu 1994a). In this situation, the effects of multiple hits under the rate heterogeneity on 0 estimation can be investigated with Fu’s (199413) mutation frequency estimator.
We investigated here the frequently used model of the mutation rate heterogeneity across sites, i e . , the gamma distribution. Other models of among-site rate variation were used by some other workers. One is the multiclass model, which classifies sites into several classes, within each of which the mutation rate is con- stant (FITCH and MARGOLIASH 1967; SHOEMAKE and FITCH 1989; HASEGAWA et al. 1993). Another one is the log-normal distribution (OLSEN 1987). Although these models differ from each other, the qualitative effects of multiple hits under the rate heterogeneity in estimat- ing 0 should be similar. As demonstrated, mutation rate heterogeneity
per
se does not add an additional source of underestimation of 0 by Fu’s UPBLUE (section “Esti- mation of0 when the genealogy of a sample is known”).
It is the underestimation of genetic distance due to multiple hits under the rate heterogeneity that caused the additional bias. Thus, the correction Equation 11 may differ if different mutation rate variation models are used, but the qualitative conclusion of the present study should remain valid. That is, multiple hits will result in an underestimation (if any) of 0 with Fu’s(1994a) UPBLUE procedure.
As in Fu (1994a), under multiple hits, UPBLUE may be used in conjunction with the parsimony treeing method to yield a better estimate of 8. Although parsi- mony method partly recovers the number of mutations on sites under multiple hits, it generally underestimates it (WAKELEY 1993), thus likely the 0 estimate. The sub- stantial increase of computational time of the parsi-
mony method relative to the UPGMA method also pre- cludes it from the computer simulations in the present and Fu’s (1994a) studies, in which many genealogies and large samples are simulated. However, the use of the correction Equation 11 requires that the mutation rates across sites follow a gamma distribution and its parameter a be estimated, which may not always be true or easy in practice. Thus, without the knowledge of the distribution of mutation rates across sites, Fu’s (1994a) approach of using UPBLUE in conjunction with the parsimony treeing method may be adopted.
Due to mutation rate heterogeneity, multiple hits are common in the human mitochondrial control region, in which the distribution of mutation rates across sites is fit adequately by a gamma distribution (KOCHER and WILSON 1991; TAMURA and NEI 1993; WAKELEY 1993). For the sample of 63 American Indian sequences from mitochondrial control region (hypervariable region 1) (WARD et al. 1991), Fu (1994a) estimated 0 to be 13.32 by using UPBLUE in conjunction with parsimony. For this region, a is estimated (by the largest data set) to be 0.47 (WAKELEY 1993). By using UPBLUE with correction Equation 11 and assuming a = 0.47, 0 is estimated to be 13.84, slightly higher than Fu’s (1994a) estimate. In- terestingly, direct use of Fu’s (1994a) original UPBLUE procedure ( i e . , using the number of nucleotide differ- ence between two sequences as the distance between them directly), 0 is estimated to be 12.88, which is close to the above two estimates. Their differences are unlikely to be significant in comparison with their variances, which is -7.70. This appears at a glance surprising be- cause there are 26 segregating sites, while parsimony analysis shows that there are at least 41 mutations (WARD
et al. 1991; FU 1994a), so that the infinite-sites model is apparently violated. However, the truth is that the real requirement of Fu’s UPBLUE is to know the number of mutations between each pair of sequences, which strictly speaking does not require the assumption of the infinite- sites model. Since the sample size is reasonably large and a is not too small, Fu’s UPBLUE needs little correction as demonstrated in this paper. This example demon- strates the robustness of Fu’s UPBLUE procedure in the presence of multiple hits under mutation rate heteroge- neity.
We thank Drs. X. Gu, R. AoKlNs and two anonymous reviewers for helpful comments. The work was supported by First Award from National Institutes of Health to Y.-X.F.
LITERATURE CITED
ARIS-BROSOU, S . , and L. EXCOFFIER, 1996 The impact of population expansion and mutation rate heterogeneity on DNA sequence polymorphism. Mol. Biol. Evol. 1 3 495-504.
EWENS, W. J., 1997 Mathematical Population Genetics. Springer-Verlag.
FITC:H, W. M., and E. MAFSOLIASH, 1967 A method for estimating Berlin.
the number of invariant amino acid codon positions in a gene using cytochrome c as a model case. Biochem. Genet. 4: 579-
Mutation Rate and Population Size 1281
Fu, Y.-X., 1994a A phylogenetic estimator of effective population size or mutation rate. Genetics 136: 685-692.
Fu, Y.-X., 1994b Estimating effective population size or mutation rate using the frequencies of mutations of various classes in a sample of DNA sequences. Genetics 138: 1375-1386.
Fu, Y.-X., and W.-H. LI, 1993 Maximum likelihood estimation of population parameters. Genetics 134 1261-1270.
GOLDING, G. B., 1983 Estimates of DNA and protein divergence: an examination of some assumptions. Mol. Biol. Evol. 1: 125-142. GRIFFITHS, R. C., and S. TAVAIU?, 1993 Sampling theory for neutral
alleles in a varying environment. Proc. R. SOC. Lond. Ser. B344:
GRIFFITHS, R. C., and S. TAVAR~, 1994 Simulating probability distri- bution in the coalescent. Theor. Popul. Biol. 46: 131-159.
Gu, X., Y.-X. Fu and W.-H. LI, 1995 Maximum likelihood estimation of heterogeneity of substitution rate among nucleotide sites. Mol. Biol. Evol. 1 2 546-557.
HASEGAWA, M., and M. FUJIWARA, 1993 Relative efficiencies of the maximum likelihood, maximum parsimony, and neighbor-join- ing methods for estimation protein phylogeny. Mol. Phylogen. Evol. 2: 1-5.
HASEGAWA, M., A. DIRIENZO, T. D. KOCHER and A. C. WILSON, 1993 Toward to more accurate time scale for the human mitochon- drial DNA tree. J. Mol. Evol. 37: 347-354.
HUDSON, R., 1982 Testing the constant-rate neutral allele model with protein sequence data. Evolution 37: 203-217.
HUDSON, R., and N. L. KAPLAN, 1985 Statistical properties of the number of recombination events in the history of a sample of DNA sequences. Genetics 111: 147-164.
JIN, L., and M. NEI, 1990 Limitations of the evolutionary parsimony
method of phylogenetic analysis. Mol. Biol. Evol. 7: 82-102.
JUKES, T. H., and C. R. CANTOR, 1969 Evolution of protein mole- cules, pp. 21-132 in Mammalian Protein Metabolism, edited by H. N. MUNRO. Academic Press, New York.
KIMURA, M., 1969 The number of heterozygous nucleotide sites maintained in a finite population due to steady flux of mutations. Genetics 61: 893-903.
KIMURA, M., 1971 Theoretical foundation of population genetics at the molecular level. Theor. Popul. Biol. 2: 174-280.
KIMURA, M., 1980 A simple method for estimating evolutionary rate of base substitution through comparative studies of nucleotide sequences. J. Mol. Evol. 16: 11 1-120.
KINGMAN, J., 1982 On the genealogy of large populations. J. Appl. Probab. 19A 27-43.
KOCHER, T. D., and A. C. WIISON, 1991 Sequence evolution of mito- chondrial DNA in human and chimpanzees: control region and a protein coding region, pp. 41-64 in Evolution of LVe; Fossils,
Molecules and Culture, edited by S. OSAWA and T. HONJO. Springer,
Tokyo.
KUHNER, M. IC, and J. FELSENSTEIN, 1994 A simulation comparison of phylogeny algorithm under equal and unequal mutation rates. Mol. Biol. Evol. 11: 459-468.
KUHNER, M. IC, J. YAMATO and J. FELSENSTEIN, 1995 Estimating effec- tive population size and mutation rate from sequence data using Metropolis-Hastings sampling. Genetics 140: 1421-1430. 403-410.
LI, W.-H., and Y.-X. Fu, 1994 Estimation of population parameters and detection of natural selection from DNA sequences, pp. 112-125 in Non-Neutral Evolution, edited by B. GOLDING. C h a p man & Hall, New York.
LI, W.-H., M. G o w , P. M. SHARP, C. O’HUIGIN and Y. W. YANG, 1990 Molecular phylogeny of Rodentia, Lagomorpha, Primates, Artio- dactyla and Carnivora and molecular clocks. Proc. Natl. Acad. Sci. USA 87: 6703-6707.
NEI, M., 1987 Molecular Evolutionary Genetics. Columbia University Press, New York.
OISEN, G. J., 1987 Earliest phylogenetic branchings: comparing rRNA-based evolutionary tree inferred with various techniques. Cold Spring Harbor Symp. Quant. Biol. 52: 825-837.
PAI.UMBI, S. R., 1989 Rates of molecular evolution and the fraction of nucleotide positions free to vary. J. Mol. Evol. 29: 261 -273.
RZHETSKY, A,, 1995 Estimating substitution rates in ribosomal RNA genes. Genetics 141: 771-783.
SHOEMAKER, J. S., and W. M. FITCH, 1989 Evidence from nuclear sequences that invariable sites should be considered when se- quence divergence is calculated. Mol. Biol. Evol. 6: 270-289. SUI.I.IVAN, J., K. E. HOLSINGER and C. SIMON, 1995 Among site rate
variation and phylogenetic analysis of 12s rRNA in sigmodontine rodents. Mol. Biol. Evol. 12: 988-1001.
TAJIMA, F., 1983 Evolutionary relationship of DNA sequences in fi- nite populations. Genetics 105: 437-460.
TAMURA, K, and M. NEI, 1993 Estimating the number of nucleotide substitutions in the control region of mitochondrial DNA in human and chimpanzees. Mol. Biol. Evol. 10: 512-526. TATENO, Y., N. TAKFZAKI and M. NEI, 1994 Relative efficiencies of
the maximum likelihood, maximum parsimony, and neighbor- joining methods when substitution rate varies with sites. Mol.
Biol. Evol. 11: 261-277.
U L Z E I . , T., and K. W. CORBIN, 1971 Fitting discrete probability distri- butions to evolutionary events. Science 172: 1089-1096. VAN DE PEER, Y . , I. M. NEEFS, P. DERIJK and R. D. WACHTER, 1993
Reconstructing evolution from eukatyotic small-ribosomal-sub- unit RNA sequences: calibration of the molecular clock. J. Mol.
VIGIIANT, L., M. STONEKING, H. HARPENDING, K HAWKES and A. C. WILSON, 1991 African populations and the evolution of human mitochondrial DNA. Science 253: 1503-1507.
WAKELEY, J., 1993 Substitution rate variation among sites in hyperva- riable region 1 of human mitochondrial DNA. J. Mol. Evol. 37:
WAKELEY, J., 1994 Substitution rate variation among sites and the estimation of transition bias. Mol. Biol. Evol. 11: 436-442. WARD, R. H., B. L. FRAZIER, K. DEW-JAGER and S. PAABO, 1991 Exten-
sive mitochondrial diversity within a single American tribe. Proc. Natl. Acad. Sci. USA 88: 8720-8724.
WATTERSON, G., 1975 On the number of segregating sites. Theor. Popul. Biol. 7: 256-276.
Y m G , Z., 1993 Maximum-likelihood estimation of phylogeny from
DNA sequences when substitution rates differ over sites, Mol. Biol. Evol. 10: 1396-1401.
Evol. 37: 221-232.
613-623.