ABSTRACT
ESTRICH, NICOLE ASHLEY. Self-Assembly Properties of DNA Origami, Gold Nanostructures, and Diblock Compatibilizers. (Under the direction of Professor Thomas LaBean).
The well-characterized structure and reliable formation of the DNA double-helix provides a method for biological self-assembly at the sub-10 nm length scale. The field of DNA origami was predicated on this simple and dependable methodology, using the self-assembling nature of DNA as a structural tool rather than a genetic encoding material, through which many structures have been demonstrated.
Using attachment chemistry, nanoparticles and other nanometer-scaled components of a variety of materials can be site-specifically bound at docking positions on DNA origami, thus utilizing DNA origami as a templating method for simultaneously synthesizing a large number of copies (~1012) of a pre-designed architecture.
With this methodology in place, novel 3D wireframe DNA origami structures were designed and imaged using a positive-staining Transmission Electron Microscopy method never before used to image DNA origami. These architectures were designed such that specific incorporation of other nanocomponents can allow them to satisfy a number of intended uses, from applications ranging from optoelectronic sensing and detection to the fabrication of electronic device components and new types of computer architectures. However, obtaining high-yield products with high stability is a challenge.
By incorporating a compatibilizing diblock protein, stability issues related to incompatible solvent requirements of individual components may be overcome. Two candidate compatibilizers were characterized herein to determine the amount of
compatibilizing protein required to saturate 2D and 3D origami structures, surface dependent solubilization parameters, and protection in the presence of digestive nucleases. Additionally. stability improvements of DNA-coated gold nanosphere and gold nanorod components in the presence of compatibilizing proteins allow these nanocomponents to exist in higher salt concentrations without aggregation. Finally, hybrids of protein compatibilized DNA origami and protein compatibilized DNA-coated gold nanocomponents are explored to ensure that the compatibilizing protein does not interfere with the molecular recognition aspects of the system.
The work performed may enable massively parallel self-assembly in solution to become commercially relevant and perhaps eventually rival the 2D very large scale
Self-Assembly Properties of DNA Origami, Gold Nanostructures, and Diblock Compatibilizers
by
Nicole Ashley Estrich
A dissertation submitted to the Graduate Faculty of North Carolina State University
in partial fulfillment of the requirements for the degree of
Doctor of Philosophy
Materials Science and Engineering
Raleigh, North Carolina 2016
APPROVED BY:
_______________________________ _______________________________
Thomas LaBean Joseph Tracy
Committee Chair
BIOGRAPHY
Nicole Ashley Estrich was born in Raleigh, North Carolina on June 23, 1988 to parents Scott and Pamela Estrich. After developing an early love for mathematics, she was introduced to the wonders of physics at Broughton High School.
Nicole studied physics at the University of North Carolina at Chapel Hill and
graduated in 2010 with a B.S. in Physics and a minor in Mathematics. Nicole then joined Dr. Jon-Paul Maria‘s group at North Carolina State University in the department of Materials Science & Engineering and successfully defended her M.S. thesis in August, 2012. Nicole then went on to complete her PhD in Dr. Thom LaBean‘s lab in the same department, and
ACKNOWLEDGMENTS
Many thanks are in order. First, a tremendous thanks to Prof. Thom LaBean for his friendship and guidance. Not only did he provide insight, wisdom and an opportunity to grow, he was full of interesting conversation, and was a wonderful guide in Denmark. Also, thank you to my committee for believing in me. And Edna Deas, you are everyone‘s favorite person.
Of course, a thank you to all current and past group members, whose additional brains made brainstorming that much more productive, as well as providing friendship in and out of the lab: Alexandria Marchi, Ronnie Pedersen, Abhijit Rangnekar, and Jacob Majikes.
Additionally, I am so grateful for the extremely helpful guidance of Mauricio Pilo-Pais, Suchetan Pal, Wei-Chen ―Ivy‖ Wu, and Armando Hernandez-Garcia.
Nothing is possible without the help and support of a family. I‘m forever grateful for
TABLE OF CONTENTS
LIST OF TABLES ... vii
LIST OF FIGURES ... viii
CHAPTER 1. Introduction... 1
1.1 Overview ... 1
1.2 Motivation ... 2
1.3 Self-Assembly and Nanotechnology as it relates to DNA and Nanoparticle Organization ... 3
1.4 Fundamentals of DNA Self-Assembly ... 6
1.5 Structural DNA Nanotechnology and DNA Origami ... 8
1.6 Organization of Inorganic Materials on DNA Origami for Chiral/Optical, Electronic, and Biomedical Applications ... 14
1.7 Gold Nanoparticles ... 16
1.7.1 Gold Nanospheres ... 16
1.7.2 Gold Nanorods ... 19
1.8 Nanoparticle Arrangement as it relates to Electronics and Optics ... 20
1.8.1 Chiral Systems ... 21
1.8.2 Single-Electron Transistors in 3D ... 22
1.9 Towards Optoelectronic Goals with a Novel DNA Origami Structure ... 23
1.10 Compatibilization/Solubilization using Protein-based Polymers ... 25
1.11 Outline of This Dissertation ... 29
CHAPTER 2. Novel 3D Wireframe Tetrahedral DNA Origami and Positively Stained TEM of DNA Origami ... 31
2.1 Introduction ... 31
2.2 Experimental Design Considerations ... 32
2.3 Design, Synthesis, and AFM of Tetrahedron Design 1 ... 33
2.4 Design, Synthesis, and AFM of Tetrahedron Design 2 ... 37
2.5 Discussion and Conclusions ... 40
2.9 Sample Preparation and TEM for Method 3: Spermidine and Uranyl Acetate Staining
... 46
2.10 Discussion ... 47
2.11 Conclusions ... 49
CHAPTER 3. Gold Nanoparticle Functionalization and Hybridization ... 51
3.1 Introduction ... 51
3.2 DNA-Functionalization of 5 nm diameter Gold Nanospheres ... 54
3.3 Synthesis of 12 nm diameter, 50 nm length Gold Nanorods ... 63
3.4 DNA-Functionalization of 12 nm diameter, 50 nm length Gold Nanorods ... 69
3.5 Hybridization of Gold Nanoparticles and DNA Origami ... 75
3.6 Gold Nanospheres on DNA Origami ... 76
3.6.1 AFM and SEM imaging of Gold Nanospheres on Tall Rectangle Origami ... 77
3.7 Gold Nanorods on DNA Origami ... 80
3.7.1 SEM imaging of Gold Nanorod, Gold Nanoparticle, or DNA Origami Constructs ... 81
3.8 Conclusions ... 82
3.9 Methods ... 83
3.9.1 AFM Sample Preparation ... 83
3.9.2 SEM Sample Preparation ... 83
CHAPTER 4: Diblock Polypeptide Compatibilizer Interactions with Self-Assembled DNA Origami and Gold Nanostructures ... 85
4.1 Motivation ... 85
4.2 Diblock Proteins as Compatibilizing Agents ... 86
4.3 Materials and Methods ... 90
4.3.1 Materials ... 90
4.3.2 Design and Production of DNA Tetrahedra... 91
4.3.3 Preparation of DNA Origami ... 91
4.3.4 Preparation of DNA-coated AuNSs ... 92
4.3.5 Preparation of DNA-coated AuNRs ... 93
4.3.6 Preparation of Protein-DNA Origami or Protein-AuNP Complexes ... 93
4.3.7 Electrophoretic Mobility Shift Assay (EMSA)... 94
4.3.8 Atomic Force Microscopy ... 94
4.3.10 UV-Vis Spectroscopy ... 95
4.4 Results and Discussion ... 96
4.4.1 Binding Properties of Diblock Proteins and DNA origami ... 96
4.4.2 AFM Imaging of Protein-DNA Origami Complexes ... 98
4.4.3 Solubilization and Release-Time Analysis ... 102
4.4.4 Enzymatic Accessibility of Protein-Coated DNA ... 105
4.4.5 Annealing Origami in Protein ... 108
4.4.6 Stability of DNA Origami as a Function of Time... 112
4.4.7 Stability of protected DNA-AuNPs in High Salt Concentrations ... 113
4.4.8 Analysis of DNA Origami-AuNS Hybridization in the presence of Protein Compatibilizers ... 115
4.5 Conclusions ... 118
CHAPTER 5: Future Directions ... 121
5.1 Introduction ... 121
5.2 Motivations, Goals, and Objectives ... 122
5.3 Exploring the Compatibility of Block Polypeptides with SWCNTs ... 124
5.4 Assembly of Nanocomposite Structures including AuNPs and SWCNTs on DNA Origami in the presence of Protein Compatibilizers ... 124
5.5 Even Dispersion of Supramolecular Complexes within Agarose Hydro/Aerogels and Characterization of their Distribution, Homogeneity, and Electrical Properties. ... 126
5.6 Introducing Insulating Components... 128
5.7 Conclusions ... 131
REFERENCES ... 132
APPENDICES ... 168
Appendix A: Tetrahedra details and sequences from caDNAno ... 169
A1. Tetrahedron Design 1 ... 169
A2. Tetrahedron Design 2A ... 177
A3. Tetrahedron Design 2B ... 189
Appendix B. Additional figures relating to protein compatibilization ... 194
LIST OF TABLES
Table 1. Comparison of Self-Assembly and VLSI features. ... 3 Table 2. Example of required component quantities for a 1 L batch of AuNRs. For different batch sizes, the growth solution components scale linearly, whereas the Seed solution should always be measured in the same way so as to avoid errors introduced by measurement uncertainties. ... 64 Table 3. DNA staple sequences for Tetrahedron Design 1. Nucleotides written in red or green are capture sequences that may be excluded and the staple used only for structural purposes, or changed to another sequence to uniquely capture another nanoparticle. ―Crown‖ strands hold tetrahedron vertices tightly together and provide capture strands at the vertices. ... 169 Table 4. DNA staple sequences for Tetrahedron Design 2A. Strand names that include ―caps‖ indicate purely structural strands that may be used instead of its capture strand
LIST OF FIGURES
Figure 1. An example of top-down lithographic techniques. ... 2 Figure 2. A figure from Rothemund‘s original DNA origami paper46, which demonstrates the ability and versatility of the method. ... 9 Figure 3. Conformations of four-way junctions. Four DNA strands are associated to form a junction with four duplex arms, A) extended in a square planar geometry, ―extended-X form‖ or B) and C) associated to form the ―stacked-X structure‖, of a Holliday junction.72 ... 10 Figure 4. (Left) The routing scheme of Rothemund‘s Tall Rectangle, in which black
represents the scaffold and blue represents staple strands, and (Right) Tall Rectangle imaged via AFM in our lab. ... 12 Figure 5. Zoom-in of a portion of the Tall Rectangle DNA origami scaffold and staple map. Black represents the scaffold strand, red represents staple strands, and the blue strand is a staple strand with a ssDNA extension, designed to attract complementary ssDNA that may carry a cargo. This is an example of how DNA origami can be used as a programmable template, providing address labels to template where nanoparticles will bind... 13 Figure 6. Schematic from Alivisatos47 demonstrating the ability to use DNA to organize nanoparticles. ... 15 Figure 7. Left- and right-handed chiral structures. A) Two AuNRs arranged in different conformations on Tall Rectangle DNA Origami, and their corresponding CD spectra92. B) Different types of nanoparticles— silver, quantum dot, and two sizes of gold—arranged in different conformations, and their corresponding CD spectra 99. ... 22 Figure 8. Transistors and resistors arranged into examples of logic gates, A) an AND gate, and B) an OR gate182. ... 23 Figure 9. Schematic of assembly of a single electron transistor (SET), (A) initial plan
Figure 12. CaDNAno helix choices for the cross-sections of tetrahedra arms. A) For Design 1, using 4-helix rafts per arm, and B) for Design 2, using 6-helix bundles per arm. ... 32 Figure 13. 3D tetrahedral origami design. A) Strand trace for scaffold strand routing. Note that top and bottom arms represent a single connected edge with strand connections indicated by number labels. B) CanDo model of tetrahedral origami. C) The same model, with added single strand handles for binding other nanocomponents. ... 34 Figure 14. DNA scaffold and staples are mixed, annealed, filtered, and imaged by atomic force microscopy (AFM). ... 35 Figure 15. AFM of tetrahedral origami (Design 1). Wide field scan showing high quality of purified origami and inset of zoomed image showing an individual structure with the
designed architecture. ... 36 Figure 16. A) A block diagram of Tetrahedron Design 2 scaffold routing, in which each blue section represents the scaffold arranged in a six-helix bundle. Seam A is labeled to indicate the location of a seam. Seams B and C are shown, but not labeled. These seams indicate locations of high stress where it is possible for an arm to break open. B) CanDo output of Tetrahedron design 2... 38 Figure 17. Selected portions of the caDNAno designs of tetrahedron Design 2A (Left) and Design 2B (Right). Each portion is a zoom-in around the seam for one of arms A-C. Light blue represents the m13 scaffold, orange represents staple strands, and all other colors
represent staple strands that may have extended ssDNA captures. The exceptions are the grey strands in Design 2B, which represent long staples designed to maintain the seams of each of these arms... 39 Figure 18. AFM of tetrahedron A) Design 2A, with short seam staples like those of Tian and Gang267, in which tetrahedra do not form as designed, but rather break open, and B) Design 2B, with longer seam staples that hold the tetrahedra in the designed shape. ... 40 Figure 19. TEM images of DNA tetrahedra (Design 1) imaged via method 1 (EtBr and tungsten shadowing). ... 44 Figure 20. TEM images of DNA origami imaged via method 2 (spermidine and tungsten shadowing). (A-E) show images of tetrahedra (Design 1). Stress on the origami, and
Figure 22. TEM images of DNA origami imaged at 200 kV. A) Tall Rectangle imaged via method 2 (spermidine and tungsten shadowing). B) Tall Rectangle and C) tetrahedra (Design 1) imaged via method 3 (spermidine and Uranyl Acetate staining). ... 48 Figure 23. Tetrahedra (Design 1) imaged via A) method 1 (EtBr and tungsten shadowing) at 40 kV, B) method 2 (spermidine and tungsten shadowing) at 40 kV, C) method 3 (spermidine and uranyl acetate staining) at 40 kV, and D) method 3 at 200 kV. ... 48 Figure 24. Overview of the AuNS (top) and AuNR (bottom) DNA functionalization
procedures. ... 53 Figure 25. A schematic of AuNSs first with BSPP stabilization (Left), and then stabilized by functionalization with DNA (Right). ... 54 Figure 26. (Top and right) Single thiol modified DNA and (bottom left) dithiol modified DNA, before and after reduction, and bound to a gold surface. This schematic is modified from components in Ref.311... 56 Figure 27. UV illuminated electrophoretic assay (3% agarose, 1xTAE, stained with EtBr) of DNA-AuNSs and excess thiol-DNA. Lane 1 contains as-functionalized DNA-AuNSs, and is run to remove any excess thiol-DNA from the DNA-AuNSs. Lane 2 contains DNA-AuNSs that were previously centrifuge-filtered. The excess thiol-DNA band indicates that not all excess thiol-DNA were removed during centrifuge filtration. ... 59 Figure 28. UV-vis Absorbance Spectroscopy of DNA-AuNSs (red, short dashes) with excess thiol-DNA present, (blue, solid line) after centrifuge filtration to remove most but not all of the excess thiol-DNA, and (green, long dashes) gel electrophoresed and Freeze ‗N Squeezed to remove any excess thiol-DNA. All samples have been brought to the same AuNS
Figure 32. (Left) Schematic of AuNR shape and dimensions, in which the radius is 6 nm and the full height of the AuNR is 50 nm, making the ―a‖ value 38 nm. (Right) Calculation of AuNR surface area, maximum loading of thiols on a AuNR surface, and amount of excess thiol-DNA added to solution during the functionalization process. ... 70 Figure 33. UV-vis absorbance spectroscopy showing the consequences of removing CTAB and replacing with DI H2O instead of SDS. AuNRs in CTAB (red, dotted line) vs. AuNRs washed and resuspended in water (solid, blue line). The AuNR longitudinal peak is blue-shifted, indicating partial aggregation... 72 Figure 34. UV-vis absorbance spectroscopy of AuNRs and single-thiol-DNA (solid, blue line) and later, those same AuNRs, fully functionalized with DNA, after NaCl and TAEMg addition to show that the peak position is maintained (green, short dashes). Also shown are AuNRs with dithiol-DNA (red, long dashes), which shows a peak shift and peak broadening, indicating aggregation. ... 73 Figure 35. Both native CTAB-AuNRs and lipoic-acid AuNRs are aggregated and cannot enter the gel. The thiol-AuNRs migrate into the gel and remain red in color. ... 75 Figure 36. EtBr stained agarose gel electrophoresis (1% agarose, 1xTAEMg) of A) DNA-AuNSs, B) Design 1 tetrahedra with excess ssDNA, C) filtered Design 1 tetrahedra, and D) tetrahedra hybridized with AuNSs, in which the AuNSs are in 5x excess of the origami. (Top) White light illuminated image of the gel and (bottom) UV illuminated. ... 77 Figure 37. Tall Rectangle origami with AuNSs A) along one edge, and B) along two edges, or C) at each corner. For each of A and B, i) shows a schematic of the desired product, ii) shows AFM images of the samples, and iii) shows SEM images of the samples. For C, i) shows the schematic, ii) shows SEM images, and iii) shows TEM images using the method from Chapter 2... 79 Figure 38. A) Tall Rectangle origami with a AuNR on one edge. i) Schematic and ii) SEM images. B) Tall Rectangle origami with a AuNR on each edge. C) Design 1 tetrahedra with a AuNR on an arm, and D) the same but with AuNSs at the vertices. E) A core-satellite
structure with AuNSs bound to a AuNR... 82 Figure 39. Candidate diblock protein compatibilizers. A) Schematic of C4-BK12 and its predicted 3D structure, and B) schematic of C4-BK12 associated with dsDNA (black). C) Schematic and predicted 3D structure and sequence of C8-BSso7d. D) AFM of each diblock protein complexed with linear dsDNA (i, iv) or with circular M13mp18 ssDNA (ii, iii, v, vi). Images from Refs.51,239... 88 Figure 40. Electrophoretic Mobility Shift Assay for 7.2 kbp Tall Rectangle DNA origami complexed with A) C4-BK12, and with B) C8-BSso7d. Each lane has ~100 ng of DNA.
Figure 41. Electrophoretic Mobility Shift Assay for 5.4 kbp Tetrahedral DNA origami (Design 1) complexed with A) C4-BK12, and with B) C8-BSso7d. Each lane has ~100 ng of DNA. Protein/DNA bp ratio is shown at the top. ... 98 Figure 42. (Top) Dry AFM images and (bottom) corresponding height maps (in nm) of single molecules of Tall Rectangle DNA origami complexed with C4-BK12 at different protein per bp ratios. (A) 0.054 protein/bp, (B) 0.108 protein/bp, (C) 0.215 protein/bp, (D) 0.378 protein/bp, (E) 0.538 protein/bp, (F) 0.861 protein/bp. Scale bar is 50 nm. ... 100 Figure 43. (Top) AFM images and (bottom) corresponding height maps (in nm) of single molecules of Tall Rectangle DNA origami complexed with C8-BSso7d at different protein per bp ratios. (A) 0.013 protein/bp, (B) 0.059 protein/bp, (C) 0.094 protein/bp, (D) 0.125
protein/bp. Scale bar is 50 nm... 100 Figure 44. (Top) AFM images and (bottom) corresponding height maps of single molecules of Design 1 Tetrahedral DNA origami complexed with C4-BK12 at different protein per bp ratios. (A) 0.054 protein/bp, (B) 0.108 protein/bp, (C) 0.215 protein/bp, (D) 0.378 protein/bp, (E) 0.538 protein/bp, (F) 0.861 protein/bp. Scale bar is 50 nm. ... 101 Figure 45. (Top) AFM images and (bottom) corresponding height maps of single molecules of Design 1 Tetrahedral DNA origami complexed with C8-BSso7d at different protein per bp ratios. (A) 0.013 protein/bp, (B) 0.059 protein/bp, (C) 0.094 protein/bp, (D) 0.125 protein/bp. Scale bar is 50 nm. ... 101 Figure 46. DNA origami in 1xTAEMg, bound to a mica surface, and imaged over time. Panels show the origami imaged after 0, 60, and 120 minutes. ... 103 Figure 47. DNA origami in 1xTAEMg, bound to a mica surface. At time zero, C4-BK12 protein was added to bring the solution to 0.059 protein/bp, and imaged over time. Panels show the origami imaged after 0, 60, and 120 minutes. ... 103 Figure 48. DNA origami in 1xTAEMg, bound to a mica surface. At time zero, C8-BSso7d protein was added to bring the solution to 0.075 protein/bp, and imaged over time. Panels show the origami imaged after 0, 25, and 50 minutes. ... 104 Figure 49. Enzymatic protection assay of Tetrahedra DNA A) without protein protection, B) complexed with C4-BK12 (0.861 protein/bp), and C) complexed with C8-BSso7d (0.188
ptn/bp). Samples were incubated with DNAse I and aliquots of reaction samples were stopped with EDTA at different times. Aliquots were run in an agarose gel to detect the degradation of DNA (stained with EtBr). Top numbers are incubation time in minutes. .... 107
protein/bp, 6 mM Mg2+, I) 0.054 protein/bp, 12.5 mM Mg2+. Large scan area scale bar is 500 nm. Inset scale bar is 50 nm; scale bar for inset A is for inset A only. Scale bar for inset I is the scale bar for all other insets... 109 Figure 51. Tall Rectangle origami annealed in varying amounts of C8-BSso7d protein and TAEMg buffer. A) 0.5 protein/bp, 2 mM Mg2+, B) 0.5 protein/bp, 6 mM Mg2+, C) 0.5 protein/bp, 12.5 mM Mg2+, D) 0.188 protein/bp, 2 mM Mg2+, E) 0.188 protein/bp, 6 mM Mg2+, F) 0.188 protien/bp, 12.5 mM Mg2+, G) 0.05 protein/bp, 2 mM Mg2+, H) 0.05
protein/bp, 6 mM Mg2+, I) 0.05 protein/bp, 12.5 mM Mg2+. Large scan area scale bar is 500 nm. Inset scale bar is 50 nm. ... 110 Figure 52. AFM of Tall Rectangle origami and Tetrahedral origami (Design 1), who share the same scaffold strand sequence, and were mixed in solution in 1xTAEMg containing (A) no protein, (B) C4-BK12 at 0.054 protein/bp, or C) C8-BSso7d at 0.075 protein/bp and allowed to incubate at room temperature for four days. ... 113 Figure 53. (Left) DNA-AuNS control without protein and (Right) DNA-AuNSs with 0.125 C8-BSso7d protein/bp before (red, solid lines) and two hours after (blue, dotted lines) exposure to 25 mM Mg acetate. The control shows a drop in absorbance after Mg2+ addition, whereas the protein-protected sample does not exhibit this drop in absorbance. ... 114 Figure 54. (Left) DNA-AuNR control without protein and (Right) DNA-AuNRs with 0.125 C8-BSso7d protein/bp before (red, solid lines) and two hours after (blue, dotted lines) exposure to 25 mM Mg acetate. The control shows a drop in absorbance after Mg2+ addition, whereas the protein-protected sample does not exhibit this drop in absorbance. ... 115 Figure 55. Dry AFM images of Tall Rectangle hybridized with AuNSs on the corners A) protected with 0.188 C8-BSso7d protein/bp before hybridization, and B) control without protein protection. ... 117 Figure 56. Analysis of origami-AuNS complexes in clusters vs. alone in a control sample without protein (blue) and with protein (red). ... 117 Figure 57. TEM of silica-coated 12 nm x 50 nm AuNRs. ... 129 Figure 58. Schematic of proposed mechanism for DNA-functionalizing silica-coated
Figure 61. CaDNAno (top) cross-section of arm helices and (bottom) strand routing map for Tetrahedron Design 2B. ... 190 Figure 62. Additional time-points for solubilization and release of DNA origami from mica surface after 0.075 C8-BSso7d protein/bp addition. Scale bar is 500 nm. ... 194 Figure 63. 0.8% Agarose, 1xTAEMg gel with samples mixed with 0.09 U DNase / ug DNA at various time points. Tall Rectangle origami A) with 0.188 C8-BSso7d protein/bp, B) with 0.861 C4-BK12 protein/bp, or C) control without protein addition. ... 195 Figure 64. Agarose gel electrophoresis (1% agarose, 1xTAEMg) stained with EtBr showing that protein-complexed samples are charge neutral and do not enter the gel whereas control samples without protein addition migrate into the gel. ... 196 Figure 65. Dry AFM images of A) Control samples of AuNSs on the corners of Tall
Rectangle origami, with no protein addition, and B) the same samples complexed with 0.188 C8-BSso7d protein/bp. ... 197 Figure 66. Dry AFM of Tall Rectangle and AuNSs incubated on mica in 1xTAEMg. ... 198 Figure 67. White light illuminated gel image of standard method samples vs. one-pot
CHAPTER 1. Introduction
1.1 Overview
1.2 Motivation
In the electronics industry today and for the past many decades, top-down lithography has been employed to create the transistors and circuitry that are used in all of our
conventional computing hardware.
The process starts with a substrate that is coated with a photo-sensitive polymer resist. A patterned mask is placed over the resist, and then it is exposed to UV light, either
crosslinking or depolymerizing the resist, depending on the type of polymer. The resist is then introduced to a developing solution, in which the depolymerized portions are washed away, uncovering the underlying substrate. A material of interest can then be deposited onto the substrate, and the remainder of the photoresist removed. Then perhaps the process would be repeated to coat subsequent layers of other materials until a device formed.
Figure 1. An example of top-down lithographic techniques.
even with tricks for patterning at fractional wavelengths, the wavelengths of UV light obscure features any smaller. Secondly, while this process can be performed in parallel – with many structures on a single substrate – there is a limit to how many can be produced on a chip. There are, likewise, multiple lithographic iterations per device, limiting the
throughput. Lastly, and perhaps most importantly, is that lithography is inherently 2D. In this document, I will focus on an idea that has the ability to solve these shortcomings. Using the self-assembling nature of DNA, which forms double helical structures reliably and on the molecular level, nanoscale structures can be attained with features resolved down to 1.5 nm in one direction, the diameter of a DNA helix, and about 3.5 nm in a second direction, the length between one full helical turn of DNA, 10.5 base pairs. Not only that, since
molecular assembly is inherently 3D, it enables new types of computer architectures.
Table 1. Comparison of Self-Assembly and VLSI features.
Feature Self-Assembly VLSI
Fabrication scale >1012 components ~109 components
Dimensionality Inherently 3D 2D / planar
Resolution limit 1.5-3.5 nm 10 nm
1.3 Self-Assembly and Nanotechnology as it relates to DNA and Nanoparticle Organization
where possible3,4. Because of this low nanometer size range, conventional top-down tools are not realistically able to assemble nanostructures. Instead, self-assembly can be utilized to, without human intervention, organize components into patterns or structures with natural, bottom-up organization or formation in response to external stimuli5,6. Self-assembly and nanotechnology have thus piqued the interest of scientists worldwide because of their potential effects in so many fields, from medicine to communications, and electronics. That is because the chemical and physical behavioral properties of nano-scaled materials can allow us to explore and develop novel devices and strategies within this miniaturized scale. Much of what has been explored is the synthesis and control of noble metal nanoparticles, as the miniaturization of these materials help us to understand the physical and chemical
differences between bulk materials and the scaled down clusters of a limited number of atoms7–10. These synthesized particles are often formed as fairly monodisperse, solution phase colloids which come in a variety of compositions and shapes, from wires, spheres, rods, disks, prisms, cubes, and branched structures7–37. In this nanoscale regime, materials have larger than normal surface area to volume ratios, thereby affecting their surface energies and interactions with their surroundings, where the effects are most profound the smaller the dimensions38. As scientists gain understanding of these effects and how to control them, more nanomaterials are being synthesized and tailored for optical, electrical, mechanical, magnetic, or chemical properties serving applications from biodiagnostics to catalysis39–43.
highly predictable base-pairing of DNA allows us to use DNA not as a genetic material, but as a structural material, and programmably fabricate designed nanostructures from the bottom up, resolved down to 1.5 nm, creating billions of copies of a structure in a droplet of water. Perhaps the greatest feature of DNA self-assembly is that it‘s inherently 3D, which can afford certain traditionally 2D architectures, such as logic circuits and motherboards, to be built in 3D.
Nadrian Seeman led the way in introducing DNA as a programmable, self-assembling structural material when, after contemplating the M.C. Escher work Depth, he was inspired to find a means of producing periodic matter with regularly spaced binding sites—to use DNA lattices to orient molecules in three dimensions44. His work assembling DNA-based junctions in the 1980s44,45 led the way for the field of DNA origami. Years later, when specifically desired DNA sequences could be reliably and inexpensively synthesized, the field of DNA origami was brought to life by Paul Rothemund in 200646, as will be described later.
Even before the advent of DNA origami, scientists, starting with Alivisatos and Mirkin in 1996, were manipulating and controlling the placement of nanoparticles and other nanoobjects using DNA47,48, though high yields and high stability are often tricky or
bottom-up, not just from the atomic and nanoscale but to the macro scale, to create massively parallel self-assembly in solution. Eventually, this assembly technique should allow these technologies to become commercial relevant and perhaps eventually rival the 2D very large scale integration methods such as lithography that dominate device industries today.
1.4 Fundamentals of DNA Self-Assembly
Since DNA will be the main self-assembly tool used in this document, it is important to note some fundamentals of DNA before moving forward with DNA-functionalized nanoparticles and compatibilization agents.
DNA is a fundamental component of living organisms, and stores information required to build cells52. It is made up of four nitrogenous bases, which pair
complementarily. There is Adenine (A), which binds with Thymine (T), and Guanine (G) which binds with Cytosine (C). The nucleoside of a base is linked to a carbon of a
deoxyribose sugar. A nucleoside can form ester bonds with phosphates on the 3‘ and 5‘
aromatic rings of neighboring bases. The most common dsDNA form, and the one used in this dissertation, is the right-handed B-helix, which makes a full helical turn every 10.4 base pairs, which covers a distance of 3.4 nm and has a diameter of approximately 2 nm54.
DNA Nanotechnology uses DNA base pairing as an assembly mechanism, rather than as a means of storing genetic information, exploiting the predictable complementarity of these base sequences to create supramolecular structures that are programmed to form particular shapes, for particular functionalities. For example, it is possible to precisely engineer DNA structures such that single-stranded overhangs called ―sticky ends‖ exist beyond the body of the double-helix; these can be used to selectively recognize other, complementary strands and thus build DNA structures. In order to utilize the predictable assembly mechanisms of DNA, it is important to understand the thermodynamic effects on DNA hybridization and melting. DNA has a transition temperature (annealing or melting temperature) at which the strands cooperatively transform from the single-stranded state to the double-stranded state or vice-versa. This temperature is determined by the DNA sequence (nucleotide makeup), length, concentration, and by the composition of the solvent, i.e. the solvent‘s polar strength, permittivity, and overall ion makeup which contributes to charge
screening55. By taking these thermodynamic effects into account, DNA can be selectively hybridized or dehybridized through temperature control.
1.5 Structural DNA Nanotechnology and DNA Origami
DNA-based nanotechnology encompasses the engineering of synthetic DNA strands to encode information necessary for formation of desired structures on the molecular level56– 59
. Properly designed sets of DNA oligonucleotides self-assemble into highly-organized structures with nanometer-scale feature resolution.
The major advantage of DNA as a self-assembling structural material over other supramolecular systems is that DNA‘s well-understood Watson-Crick base-pairing rules act as a programming language with which to input organizational instructions. B-form DNA, the structure adopted by double-stranded DNA (dsDNA) under standard solution conditions, readily forms during the annealing of complementary strands. This specifically
programmable molecular recognition, as well as the large vocabulary of available sequences, makes it ideal for controlling the assembly of nanostructures.
In-between the realization that DNA could be used as a structural material and the advent of DNA origami, there were intermediate DNA structures built that were not scaffolded origami, but rather simpler periodic structures. For example, Seeman and Fu‘s
long and some shorter strands of ssDNA71. Then in 2006 came Paul Rothemund with the larger, higher yield, scaffolded DNA origami structures46.
Figure 2. A figure from Rothemund‘s original DNA origami paper46, which demonstrates the ability and versatility of the method.
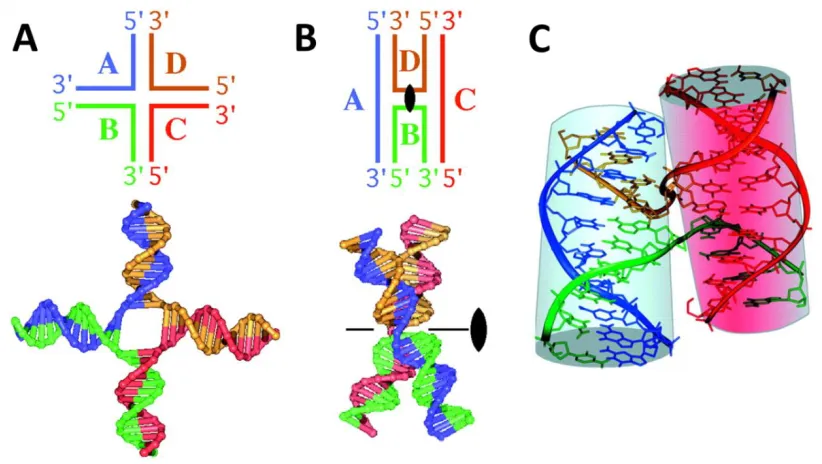
The field of DNA origami is a technique that comprises the specific nanoscale folding of DNA to create arbitrary two- and three-dimensional shapes by exploiting the physico-chemical self-assembly of DNA to specifically position atoms using the aforementioned crossovers and Holliday junctions. Figure 3 shows an example of an open crossover structure comprised of four DNA strands, which is easy to see and draw in a flat manner. However, the shown flat, open state is not a stable solution structure. Base stacking
Figure 3. Conformations of four-way junctions. Four DNA strands are associated to form a junction with four duplex arms, A) extended in a square planar geometry, ―extended-X form‖ or B) and C) associated to form the ―stacked-X structure‖, of a Holliday junction.72
Using one long biological strand of single-stranded DNA as a scaffold (usually M13mp18 bacteriophage single-strand genome) and many synthetic helper strands known as staples to fold the scaffold back and forth upon itself, one can design a rastered shape using crossovers called Holliday junctions such that a larger, woven DNA structure will form in solution. The staple strands force the scaffold strand to fold into the shape that is dictated by the staple set‘s design. Annealing of complementary strands is achieved by mixing the
Figure 4. (Left) The routing scheme of Rothemund‘s Tall Rectangle, in which black
represents the scaffold and blue represents staple strands, and (Right) Tall Rectangle imaged via AFM in our lab.
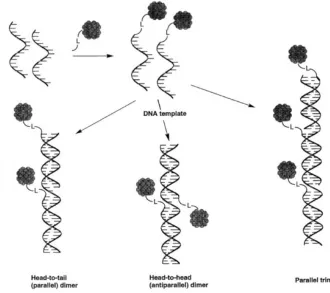
The birth of the field of DNA origami, while novel and interesting, did not on its own provide functional nanostructures that would be useful in other fields. However, it was obvious that that these origami structures could be utilized as a programmable, functional nano-breadboard, a tool capable of arranging other materials with different, perhaps more functional properties (Figure 5). Unpaired, single-strand regions (ssDNA) extending from the ends of double-strand domains can be used to specifically bind other dsDNA or
space. Anything that can be labeled with single-stranded DNA, for example,
DNA-functionalized AuNPs, quantum dots, carbon nanotubes, etc., can be specifically labeled to self-assemble onto pre-defined locations on DNA origami structures. Motivated by the possibility of providing an alternative to conventional top-down fabrication methods, this dissertation focuses on the DNA-functionalization and incorporation of AuNPs with programmable molecular assemblies.
1.6 Organization of Inorganic Materials on DNA Origami for Chiral/Optical, Electronic, and Biomedical Applications
The ultimate goal of this project is to assemble functional objects at the nanometer scale, and although DNA itself doesn‘t always have the properties needed to make functional
materials, it can be used as a smart material to arrange other objects that are functional. By doing so, nanoscience can manipulate matter on length scales that fall between those explored by traditional chemists and physicists, who manipulate atoms and bonds on the scale of approximately 0.1 to 10 nm, and biological engineers, who investigate structures on the micron scale.
As mentioned, Alivisatos and Mirkin et al. first demonstrated the ability to use DNA to organize nanoparticles in 199647,48. In this work, the staple strands are further
Figure 6. Schematic from Alivisatos47 demonstrating the ability to use DNA to organize nanoparticles.
Since Alivisatos‘ idea, many scientists have functionalized a variety of objects
(AuNSs, AuNRs, silver nanoparticles, quantum dots, carbon nanotubes, etc.) with DNA and incorporated them into DNA origami structures58,79–99. This has been done for investigations into the chiral and optical realms as well as electronic realms.
1.7 Gold Nanoparticles
This section details the history and uses of AuNSs as well as gold AuNRs.
1.7.1 Gold Nanospheres
Spherical AuNPs have been used throughout history, as exemplified by the Lycurgus Cup and stained glass windows, to dyes and pigments, to medicinal remedies100. The
nanoparticles have a unique red color, due to its strong surface plasmon resonance band in the visible region of the electromagnetic spectrum101. This band exists due to the excitation and oscillation of the electron cloud at the surface of the gold particles, which arises in the presence of incoming light with frequencies matching the resonant frequencies of the particles. As the particles grow in size, the peak wavelength red-shifts, moving to longer wavelengths102. This tunability and detectability makes AuNSs remarkable objects of study.
Michael Faraday reported a synthetic strategy to produce colloidal AuNSs in 1857103. He used phosphorus to reduce gold chloride, AuCl4; since then, his ion-reduction strategy has influenced many protocols that have since been developed to improve control of the
a layer of negatively-charged, non-specifically bound molecules107. In 1993, scientists began to explore replacing the citrate molecules with thiols, alkanethiols, amines, polymers,
dendrimers, proteins, peptides, or DNA to act as a barrier between individual particles and prevent aggregation100,108,109. In particular, the use of thiolated DNA can protect as well as provide functionality through chemical recognition abilities, and will be used heavily throughout this dissertation.
In 1996, two groups, Alivisatos et al. and Mirkin et al, were able to use thiol-modified oligonucleotides of short, synthetic DNA sequences to stabilize AuNSs47,48. Alivisatos
worked to functionalize these particles with a low density of oligos per particle, where Mirkin densely packed oligos on the particle‘s surface. The electrostatic repulsion of the
negatively charged phosphate-sugar backbones of the DNA made dense packing difficult, and thus limited stability was reached, unless monovalent salts such as NaCl were added. These salts screen charges, reducing the repulsive interactions of the DNA backbones, to allow for denser DNA packing and better surface coverage, and thus better stability of the gold colloids. Careful design of the oligos chosen for functionalization has led to unique assembly possibilities, as are detailed below.
AuNSs functionalized with a particular single-stranded DNA sequence and a second set of AuNSs functionalized with the complementary DNA sequence, when mixed, form double-stranded DNA, linking the particles together into aggregate matrices, changing the surface plasmon resonance. Unlike unstable nanoparticle aggregation, this type of
of bound strands present, the length of the strands, the nucleotide make-up of the sequence, size of the particle, or other factors such as the presence and length of an intermediate linker strand, the formation of aggregates can be tailored to have different interparticle distances, and form 1D, 2D, or 3D structures, either in amorphous, short-range ordered structures or even into well-defined face-centered cubic or body-centered cubic crystal lattice systems111– 120
. Similarly, providing a large excess of one type of DNA-conjugated nanoparticle can yield discrete core-satellite structures rather than bulk aggregates121–125. With these parameters and abilities, DNA-AuNSs have been used in different nanoassembly strategies47,48,126, as
biodiagnostic probes39,127,128, and in nanotherapeutics129–132.
Likewise, beyond simple particle-particle bonds, DNA-conjugated nanoparticles can be designed to function as a ―smart glue‖ for these particles to self-assemble in particular
places on surfaces or substrates. For example, monolayers of DNA on surfaces such as gold, silica, or DNA tiles, can attract particles, which can then be used to create multi-layered DNA-AuNS assemblies in a layer-by-layer assembly fashion133–143. In this way, these assemblies can be used for nanocircuit integration, biological nano-array fabrication, catalysis, and sensing applications144–147. DNA-AuNSs have been used as probes to detect metal ions, small molecules, protein, and DNA using detection methods such as absorbance, fluorescence, Raman spectroscopy, light scattering, and electrical signal readouts48,136,139,148– 163
1.7.2 Gold Nanorods
Wet chemical AuNR synthesis has evolved over time, as each evolution in synthesis method comes with improvement of material quality and ease of synthesis. First were templated synthesis methods, introduced by Martin et. al. in 199216,164,165, in which gold was electrochemically deposited within the pores of nanoporous template membranes. Next came another electrochemical route by Wang et. al. in 1997 in which transition metal clusters were synthesized within reverse micelles in organic solvent systems166,167. The current method, used within this dissertation, is a seeded growth of monodisperse colloidal particles to first grow spherical gold nanoparticles in solution, and then preferentially nucleating gold onto only certain crystal faces of the seed particle, thereby producing a rod shape. The formation mechanism is not fully understood, however, the accepted hypothesis is that a micellar bilayer surfactant called CTAB absorbs onto the growing AuNRs with trimethylammonium headgroups of the first monolayer preferentially binding to the crystallographic faces of gold that exist on the sides of pentahedrally twinned parts of the gold on the sides of the rods, rather than at the tips of the rods168,169. Thus, preferential adsorption of CTAB to certain crystal faces during growth influences the growth of gold onto the nanoparticle seeds. These methods and variations on each have been reviewed170.
These AuNRs, which are anisotropic materials, show quite unique optical properties170. They have a high extinction coefficient for visible and near infrared
wavelengths and strong local plasmon fields at the ends of the rods due to the lightning rod effect171,172. Not only that, higher order assemblies of AuNRs have different optical
distance between rods, and orientation92,98,173. These unique optoelectronic properties have made AuNRs quite useful in the cellular imaging and cancer therapy realms as well as in biosensing, as they allow for quantitative evaluation of target yields174–179.
Although the use of CTAB is effective in providing directional growth, its bilayer nature makes subsequent ligand exchange challenging, and is one of the obstacles facing AuNR use in large-scale applications. Additionally, these nanorods can be difficult to precisely position in a massively parallel fashion, and it becomes more difficult to obtain high yields as the complexity of multi-component architectures increases. Recent works reporting the arrangement of AuNRs on DNA origami have not shown the organization of more than three AuNRs per structure92,180,181. Furthermore, nanorods and conjugated forms of them have a limited shelf-life and require careful storage conditions. These issues have made AuNRs a challenge, however, the use of compatibilizing agents may make them more viable.
Possible applications of AuNRs and AuNSs will be discussed, as it is likely that the difficulties in using AuNRs will be overcome in the near future.
1.8 Nanoparticle Arrangement as it relates to Electronics and Optics
While AuNRs, AuNSs, and DNA origami have already begun being shown to be applicable in many different ways, there is still room for innovation and growth. The
1.8.1 Chiral Systems
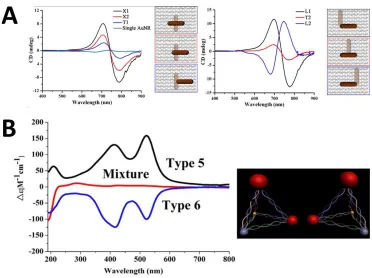
Chirality is the overall handedness of a system, which affects its dichroic response, that is, the system‘s differential interaction with right versus left circularly polarized light.
These changes can be detected when optically active components are plasmonically coupled to form a chiral superstructure. Plasmons are periodic oscillations within a particle‘s electron
Figure 7. Left- and right-handed chiral structures. A) Two AuNRs arranged in different conformations on Tall Rectangle DNA Origami, and their corresponding CD spectra92. B) Different types of nanoparticles— silver, quantum dot, and two sizes of gold—arranged in different conformations, and their corresponding CD spectra 99.
1.8.2 Single-Electron Transistors in 3D
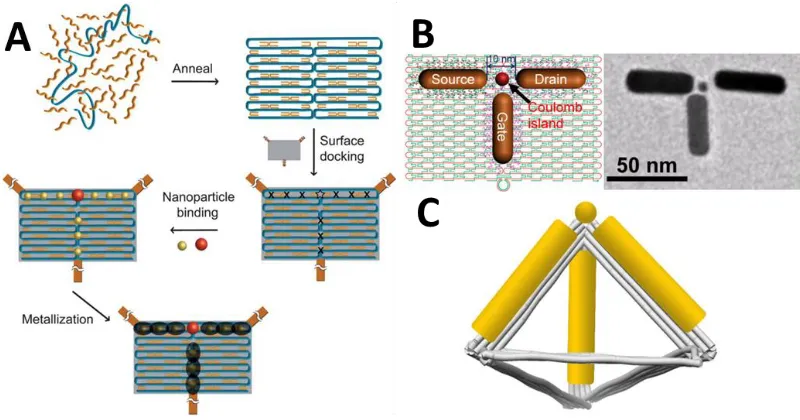
For electronic applications, perhaps the most desirable device to build is a transistor. The core nanostructure for a single-electron transistor has recently been formed by Wang et al.87, but what remains unpublished is electronic tests of these core nanostructures, likely due to the burden of precisely placing these transistors and connecting them to electrodes.
electrodes onto individual transistor structures, it would be possible to test individual structures. This work is likely on its way from the Wang group. If accomplished, transistors and other components can be synthesized into logic-gate formations and other larger-network structures.
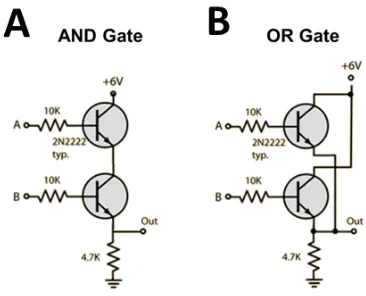
Figure 8. Transistors and resistors arranged into examples of logic gates, A) an AND gate, and B) an OR gate182.
1.9 Towards Optoelectronic Goals with a Novel DNA Origami Structure
This document will seek to utilize gold as a functional material, as it can serve a purpose in many types of applications. Many examples of DNA-templated metallic
Figure 9. Schematic of assembly of a single electron transistor (SET), (A) initial plan mapped out186, (B) experimental results of core-SET nanostructure87, and (C) schematic for 3D SET.
Each step involved in these functionalization and hybridization processes has some degree of error, inherent in molecular assembly, thus requiring purification steps, producing side-products and wasted material187. This is a major drawback compared to traditional lithographic techniques. Designed assemblies must either be useful even when not exactly wired as designed, through the pursuit of architectures that show robust behaviors even with some non-deterministic assembly and allowances for some level of fabrication errors, or else the problems associated with the cause of the fabrication errors must be solved.
the overall waste and yield by a small margin. In order to enter the realm of viability, larger leaps must be made, and to do that, one must investigate the cause of these losses.
1.10 Compatibilization/Solubilization using Protein-based Polymers
At least part of the cause for low yield is a discrepancy in the solubilities of different components under the same solution conditions, thus limiting the mixing time available for the system to find its desired, low energy conformation states. DNA origami requires fairly high salt concentrations to shield internal negative charges and stabilize desired compact folded structures, however high salt also screens charges on AuNPs and promotes their aggregation. Using a compatibilizing agent to protect the different components under somewhat non-ideal solution conditions should lead to increased time available to find their lowest energy states and increased assembly yield of the desired structure. The
compatibilizing agents used in this dissertation are made up of modular artificial proteins. The modular artificial proteins used herein are macromolecular materials that are genetically encoded and synthesized polypeptide sequences188–197. These ―protein-based polymers,‖ a phrase coined by Tirrell and Capello in 1990, were first reported via the
these polymers may in turn be controlled. Similar to the way in which DNA sequences are made up of the four nucleotides A, C, G, and T, protein-based polymers are made up of the 20 natural amino acid units, as well as the incorporation of some unnatural amino acids198–203. By using amino acids to build polymers, it is possible to use biomimetics to take advantage of nature‘s head-start on research, and copy certain functional sequences from naturally
occurring proteins such as blocks/domains like the alpha-helix or beta-sheet, and then incorporate these structures with protein-domains to make polymer-protein hybrids204–207, thereby creating new functional materials with a combination of desired
properties189,194,195,208,209.
It is possible for long, repetitive sequences of protein-based polymers to be
genetically unstable. An alternate method to chemically synthesize long polypeptides is to use block polypeptides.
Once an amino acid sequence of a protein-based polymer has been designed, there are a variety of ways to produce the molecules of synthetic artificial genes. Some techniques include concatemerization189,190,194,209,210, overlap extension rolling circle amplification (OERCA)211,212, and the method used for the block polypeptides explored in this dissertation, recursive directional ligation (RDL)51,189,190,194,196,209,210,212–215. In this method, developed in 2002, stepwise addition of the basic sequence units is performed until the final desired length is formed196.
hydrogen bonding within the minor or major grooves of the DNA216–218,221–228, and thus many of the naturally binding protein domains end up with characteristic structural motifs216,217,223– 225,229
. The block polypeptides explored in this dissertation mimic viral coat proteins, which bind to nucleic acids by mediating the condensation of the nucleotides into regular and stable supramolecular structures. There is a basic region that binds to DNA, a hydrophobic region that leads to protein-protein self-assembly, and a hydrophilic region that shields the bound entity from further interactions with other constituents. The basic region or block that binds DNA works via electrostatic complexation. That is, counterions are released from a
positively charged amino acid, for example lysine, histidine, or arginine, which is on the protein, and from the negatively charged phosphate groups of the nucleic acid backbones. The protein-protein interactions occur via lateral cooperative self-assembly of allosteric conformational changes upon binding to the DNA, whereby many weak bonds such as hydrogen bonding, van der Waals forces, pi-pi stacking or beta-sheet stacking occur at once to form larger structures. The shielding block gives colloidal stability to the other assembled parts so that they do not aggregate, by modulating particle interactions through surface modifications.
By using DNA-binding proteins, it is possible to form artificial viruses and DNA delivery systems210,230–236, optically map and sequence single DNA molecules237, or, as is relevant to this dissertation, create protein-based polymers for the protection of DNA-based nanomaterials.
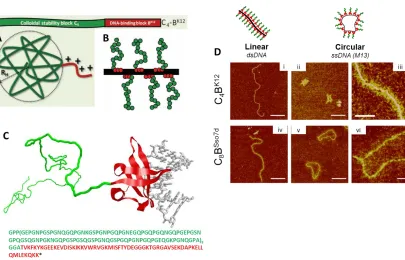
properties50,51,238. The artificial proteins, synthesized in recombinant yeast cells, contain a C-block or colloidal domain and a B-C-block or binding domain and have been shown to complex with DNA molecules to form structures reminiscent of filamentous viruses (Figure 10A-C). Proposed uses include nonviral gene delivery and modulation of interactions with other solution components during nanoscale self-assembly.
Figure 10. Candidate diblock protein compatibilizers. A) Schematic of C4-BK12 and its predicted 3D structure, and B) schematic of C4-BK12 associated with dsDNA (black). C) Schematic and predicted 3D structure and sequence of C8-BSso7d. D) AFM of each diblock protein complexed with linear dsDNA (i, iv) or with circular M13mp18 ssDNA (ii, iii, v, vi). Images from Refs.51,239
Of particular interest here are two of this group‘s monodisperse diblock polypeptides,
able to bind to DNA,) that alter the properties of dsDNA by neutralizing charge, increasing apparent diameter (Figure 10A,B,Di-iii), minimizing non-specific aggregation, and
protecting DNA from enzymatic degradation51. The other is known as C8-BSso7d, which contains a DNA-specific binding B-block and a similar, hydrophilic, gelatin-like C-block (Figure 10C,Div,v,vi). These diblock proteins thereby maintain desired DNA structures that would otherwise degrade, disassemble, and/or aggregate over time. It has been shown that their block polypeptides bind extremely well to plasmid DNA without causing intramolecular collapse or intermolecular clustering51.
Herein, the C4-BK12 and C8-BSso7d diblock polypeptides have been tested in association with more complex DNA structures, corroborating their results with simpler dsDNA molecules, as will be shown in Chapter 4.
1.11 Outline of This Dissertation
This chapter has outlined the background of DNA origami, nanoparticle attachment, and block polypeptides that may act as compatibilizing agents.
Chapter 2 describes two novel designs of 3D wireframe DNA tetrahedra, as well as a method to positively stain and image DNA origami via Transmission Electron Microscopy (TEM).
Chapter 3 describes the methods used to DNA functionalize AuNSs and AuNRs, and documents their hybridization onto DNA origami.
DNA-protein complexes in solution, on surfaces, and in different environments, including high salt concentrations as well as environments containing digestive nucleases, and describes my findings and their significance.
CHAPTER 2. Novel 3D Wireframe Tetrahedral DNA Origami and Positively Stained TEM of DNA Origami
2.1 Introduction
A variety of 2D and 3D nanostructures have been engineered from DNA origami, with a broad range of geometries and complexities74,76. Most of the 3D structures have been bulk structures, though some wireframe structures exist77,240, and due to size limitations of DNA scaffolds, the size of existing 3D structures has been fairly limited67,75,78,241–243. In order to create a structure that can be useful for many types of experiments, from chiral and optical experiments to creating the building blocks for nanoelectronic circuitry production, we imagined a wire-frame DNA tetrahedron large enough to allow for independent
programming of materials onto each arm and vertex. In particular, we ensured that the structure could accommodate a nanorod (up to 50 nm in length) per edge and nanoparticle (up to 25 nm in diameter) per vertex (Figure 11). Note that while other DNA tetrahedra exist70,84,99,244–264, none are as large as those designed herein, and thus none of the previously published tetrahedra are capable of organizing nanorods on their edges.
2.2 Experimental Design Considerations
To design these wire-frame DNA tetrahedra, a variety of factors were considered. The tetrahedron must be stiff enough to maintain its shape during various processing steps in order to be viable as a device template. It was also necessary to ensure that the structure would form with high yield, without tangling during formation. Finally, the functional staples must be populated enough to allow 2-5 capture strands per binding site, or else particles would not remain bound.
During the course of my PhD, I designed and synthesized two tetrahedral structures, with some designed differences, as will be explained below. One of the main differences is in the structure of the tetrahedra arms (Figure 12). This allowed for variances in stiffness, as well as surface area available to bind to a substrate.
Figure 12. CaDNAno helix choices for the cross-sections of tetrahedra arms. A) For Design 1, using 4-helix rafts per arm, and B) for Design 2, using 6-helix bundles per arm.
2.3 Design, Synthesis, and AFM of Tetrahedron Design 1
To accommodate large aspect ratio materials, this design comprises 50 nm arm lengths, which were created using a designed routing scheme (Figure 13A) for the single-strand M13mp18 DNA scaffold single-strand in which each arm consists of four DNA helices. Four-helix arms were chosen to increase the rigidity of the structure, whereby arms made of fewer helices would be less rigid. The helices of each arm are bound to one another using Holliday junction-like crossovers, so that the scaffold rasters smoothly through the 3D structure without undesirable tangling. In the scaffold routing design, the strands never cross so as to further lessen the chance for the scaffold to become tangled. Lastly, there is roughly the same number of connections from each arm at the vertices, so as to keep the structure as symmetrical as possible upon formation, with approximately equal amounts of stress at each of the four vertices. The vertices are not simply held together with staple strands, which could easily be displaced or removed, but rather held in place by using the scaffold itself to maintain the shape of the tetrahedron.
The CanDo finite element modeling software266 was used to confirm that our scaffold plus staples strands were predicted to fold up in solution as designed in the caDNAno
software, the output of which is shown in Figure 13B. The 3D solution shape and flexibility of DNA nanostructures in CanDo are predicted based on the assumption that the mechanical response of the DNA double-helix is well approximated by a homogeneous elastic rod with axial, twisting, and bending moduli that have been measured experimentally. The designed staple sequences are compiled and ordered through Integrated DNA Technologies (IDT).
Figure 14. DNA scaffold and staples are mixed, annealed, filtered, and imaged by atomic force microscopy (AFM).
The tetrahedral origami was assembled in the lab by mixing 100 uL of solution containing M13mp18 scaffold (5 nM, New England Biolabs, 7249 nt long), with the
1xTAEMg buffer, centrifuging at 2400 g for 2 minutes, adding extra buffer, and repeating the centrifugation process for 4 total filtrations).
The purified origami structures were then pipetted onto a freshly cleaved mica surface and imaged via AFM (Figure 15). The negatively charged mica surface attracts the positive Mg2+ ions in solution as well as the Mg2+ ions sitting on the phosphates in the DNA itself, which in turn attract the negatively charged DNA, and bind the origami to the surface. The wide field AFM image and the zoomed image in Figure 15 demonstrate that the tetrahedral origami forms as designed and in very high yield (little visible byproduct). The 3D tetrahedra typically appear flattened in the AFM mages, which is to be expected due to the strong association of the DNA with the mica surface.
Figure 15. AFM of tetrahedral origami (Design 1). Wide field scan showing high quality of purified origami and inset of zoomed image showing an individual structure with the
2.4 Design, Synthesis, and AFM of Tetrahedron Design 2
In order to create a tetrahedron structure with slightly different parameters, such as the amount of surface area available to come in contact with a substrate, as well as a change in stiffness of the arms and a change in how the vertices are bound together, a second tetrahedron was designed with 6-helix bundled arms rather than the 4-helix rafts used in design 1. This tetrahedron was adapted from Ye Tian and Oleg Gang‘s octahedron267
, but altered such that each vertex comprises three arm-ends as opposed to the four used in the octahedron, and the length of each arm is much longer for the tetrahedron design than for the octahedron design (increased from 29 nm to 50 nm in length). The scaffold routing of the tetrahedron arms are roughly shown in Figure 16A, in which each blue line comprises a six-helix bundle. Staple strands are then incorporated to hold the scaffold in place. The six-six-helix tetrahedron design is divided into two subsequent versions, 2A and 2B, which are
identical, as the only differences are not staple locations but where staple breaks occur. The output from CanDo is shown in Figure 16B.
Synthesis of these tetrahedra is identical to that of Design 1, and AFM images of Design 2A and 2B can be found in Figure 18.
Figure 17. Selected portions of the caDNAno designs of tetrahedron Design 2A (Left) and Design 2B (Right). Each portion is a zoom-in around the seam for one of arms A-C. Light blue represents the m13 scaffold, orange represents staple strands, and all other colors
Figure 18. AFM of tetrahedron A) Design 2A, with short seam staples like those of Tian and Gang267, in which tetrahedra do not form as designed, but rather break open, and B) Design 2B, with longer seam staples that hold the tetrahedra in the designed shape.
2.5 Discussion and Conclusions
The AFM of these tetrahedra are more three-dimensional, i.e. less flattened than the four-helix tetrahedra from the previous section. It is likely that this tetrahedron design will be useful in future experiments. In addition to the opportunities afforded by the tetrahedron structure as designed, the open tetrahedra of Design 2A can be used in tensegrity experiments with minor adjustments, such as ordering seam staples with a long portion of ssDNA that can be unlocked with a particular DNA key, similar to unlocking and tensegrity experiments performed in other groups73,268–270.
2.6 TEM Preparation of DNA Origami samples
Since measuring dimensions and sizes are often important for investigations of various parameters regarding DNA origami structures (and especially DNA structures with nanoparticles, for example, gold nanoparticles (AuNPs) that have been metallized), AFM is not the best microscopy method available, due to the effects of tip broadening (the effects of tip radius, curvature, and cone angle). Dimensions are better measured using electron
microscopy, as tip effects are not at play, and instead are measured by the deflection of electrons. In this section, TEM is utilized as a method of examining DNA origami systems.
It is not straightforward to perform TEM of DNA structures, or of mixtures of high and low electron density materials at once, as is the case with DNA and AuNPs, which will be discussed later. In order to image DNA at all, which is made up of light elements, one must take care to perform electron microscopy gently, that is, at a low voltage, so that the beam does not simply pass through without detecting the sample. Secondly, in order to clearly visualize DNA, it is necessary to stain with heavier elements, the most common of which is uranyl acetate74,75,268,271–273. However, staining alone is often not the only necessary practice to visualize DNA. In order to arrest the DNA on the surface of a carbon grid,
preventing it from simply rinsing away during the rinse of excess uranyl acetate, it is necessary to incorporate an intermediate constituent that has both the proper charge to promote binding as well as the proper size so as to allow the DNA‘s helical structure to
and putrescine, are suitable. Spermine has too many charges, and putrescine, not enough. Another viable candidate is ethidium bromide (EtBr). Usually used to stain DNA in
electrophoretic assays, EtBr is also an intercalating agent with DNA, and able to bind DNA to the surface of a carbon grid. The following procedures were adapted from those developed by Professor Jack Griffith (at the Cancer Research Center at University of North Carolina Medical School, Chapel Hill, NC)274–277.
Herein are 3 methods used to visualize DNA via TEM:
Method 1. EtBr and tungsten shadowing: Charge grids with EtBr, add sample, and then
tungsten shadow to add a thin layer of metal.
Method 2. Spermidine and tungsten shadowing: Charge grid using ion discharge, add
positively charged spermidine buffer to the DNA, and incubate DNA/spermidine sample onto
grid, then tungsten shadow similar to method 1.
Method 3. Spermidine and uranyl acetate staining: Same as the spermidine method, but
instead of tungsten shadowing, stain with uranyl acetate. (Note that it is also possible to
produce results using the EtBr method with uranyl acetate staining.)
For all methods, DNA origami is diluted to 0.5 nM using 40 mM Tris / 6 mM Mg
acetate. Any water used was deionized and distilled. TEM grids are 400 mesh copper grids,
with in-house, thin carbon films on them, as they are made to be thinner than the carbon grids
2.7 Sample Preparation and TEM for Method 1: EtBr and Tungsten Shadowing
EtBr stock solutions are diluted to 0.03 mg/mL. On parafilm, a droplet of diluted EtBr
is pipetted, and a grid floated on top of the domed drop, protected from light with a cover,
and incubated for 30 minutes. The grids are then placed on filter paper to dry. Then, using
self-closing tweezers, the grids are held in air as up to 20 uL of DNA sample is incubated on
them for 3 minutes. Next, the grid is swirled in ~95% ethanol (EtOH) for 5-10 seconds, and
then put on filter paper to dry. The grid is then placed into a vacuum system equipped with
liquid nitrogen and a tungsten wire between two electrodes. After pumping the chamber
down to 2x10⁻⁶ Torr, the grids are rotated as tungsten is deposited at ~3.5x10⁻⁶ Torr, with 6.5
A through the tungsten wire, for 2-5 min, depending on deposition rate and desired film
Figure 19. TEM images of DNA tetrahedra (Design 1) imaged via method 1 (EtBr and tungsten shadowing).
2.8 Sample Preparation and TEM for Method 2: Spermidine and Tungsten Shadowing Carbon TEM grids are negatively charged by ion discharging them for ~2 min. In this
way, the surface of the carbon grid is bombarded with charged ions and creates carboxyl
groups on the surface. Thus, the carbon becomes more hydrophilic. Six petri dishes are set
up, two of which are filled with deionized water (DI H2O), the next with 25% EtOH, 50%
EtOH, 75% EtOH, and ~95% EtOH. Using 10x spermidine buffer, 19 uL of DNA sample is
second water bath (exposing the grid to air as little as possible in each transition), swirled in
the second DI H2O dish and left in this bath for 3 minutes. Similarly, the grid is moved to
each subsequent dish, swirled, and left for 5 minutes in each EtOH pool. After 5 minutes in
the last bath, the grid is placed face-up on filter paper to air dry. Tungsten shadowing is then
performed the same as in method 1. Images of DNA tetrahedra (Design 1) and Tall Rectangle
from this method are shown in Figure 20.
Figure 20. TEM images of DNA origami imaged via method 2 (spermidine and tungsten shadowing). (A-E) show images of tetrahedra (Design 1). Stress on the origami, and
2.9 Sample Preparation and TEM for Method 3: Spermidine and Uranyl Acetate Staining
A note about this method: Spermidine and uranyl acetate have the potential to create
unwanted side products, however if simply TAE buffer or similar were used without the
spermidine, rinsing away the uranyl acetate could also remove the DNA.
The carbon grids are negatively charged by ion discharging for ~2 min. Using 10x
spermidine buffer, 19 uL of DNA sample are mixed with 1 uL of spermidine buffer and
pipetted up and down ~10x to mix. Grids are then held in self-closing tweezers, and the
simple incubated on the grid for 3 minutes. The grid is then swirled in a petri dish filled with
DI H2O for ~5-10 sec, then allowed to sit for 3 min. The grid is again held in self-closing
tweezers, and a drop of 2% uranyl acetate is added and incubated for 3 min. The grid is then
put onto filter paper to remove excess UA, and then onto a clean sheet of filter paper to dry
for ~5 minutes, and then imaged via TEM. Images of DNA tetrahedra (Design 1) and Tall
Figure 21. TEM images of DNA origami imaged via method 3 (spermidine and Uranyl Acetate staining). (A-C) tetrahedra (Design 1) and (D-F) Tall Rectangle.
2.10 Discussion
The previous TEM images were collected at 40 kV on a Tecnai/FEI TEM. At higher
voltages, resolution is improved but contrast is decreased. The same samples prepared and
imaged above were imaged on a JEOL 2000 FX TEM at 200 kV to demonstrate this
Figure 22. TEM images of DNA origami imaged at 200 kV. A) Tall Rectangle imaged via method 2 (spermidine and tungsten shadowing). B) Tall Rectangle and C) tetrahedra (Design 1) imaged via method 3 (spermidine and Uranyl Acetate staining).
In order to compare each method, an image of DNA tetrahedra (Design 1) from each
imaging method is reprinted for side-by-side comparison in Figure 23 below.
Figure 23. Tetrahedra (Design 1) imaged via A) method 1 (EtBr and tungsten shadowing) at 40 kV, B) method 2 (spermidine and tungsten shadowing) at 40 kV, C) method 3 (spermidine and uranyl acetate staining) at 40 kV, and D) method 3 at 200 kV.