A periodic potential underdamped stochastic resonance method and
its application for gear fault diagnosis
Zhixing Li1, 2, Xiandong Liu1, Tian He1*, Yingchun Shan1
1 School of Transportation Science and Engineering, Beihang University, Beijing, China 2School of Mechanical Engineering, University of Science & Technology Inner Mongolia,
Baotou, China
*Corresponding author: Tian He, [email protected]
Abstract: The vibration feature of weak gear fault is often covered in strong background noise, which makes it necessary to establish weak feature enhancement methods. Among the enhancement methods, stochastic resonance (SR) has the unique advantage of transferring noise energy to weak signals and has a great application prospection in weak signal extraction. But the traditional SR potential model cannot form a richer potential structure and may lead to system instability when the noise is too great. To overcome these shortcomings, the article presents a periodic potential underdamping stochastic resonance (PPUSR) method after investigating the potential function and system signal-to-noise ratio (SNR). In addition, system parameters are further optimized by using ant colony algorithm. Through simulation and gear experiments, the effectiveness of the proposed method was verified. We concluded that compared with the traditional underdamped stochastic resonance (TUSR) method, the PPUSR method had a higher recognition degree and better frequency response capability.
Keywords: fault diagnosis, stochastic resonance, periodic potential, underdamped, weak
signal
1. Introduction
Gearboxes are widely used in mechanical equipment transmission, which health
working can effectively reduce costs and energy consumption. However, gearboxes are often affected by the component failures, which reduce the transmission efficiency of the equipment, thereby increasing energy consumption and possibly even fatal effects.
[1]. Therefore, timely detection and accurate extraction of fault characteristics are particularly important [2, 3]. Vibration signal detection is usually used to extract fault
characteristics, but machinery gearboxes often work coupled with other components amid a strong background noise. Therefore, extracting early faults amid strong noise is very difficult [4, 5].
To obtain important characteristics information from the vibration signals of mechanical equipment, many scholars have done much research on such signal processing methods such as local mean decomposition [6, 7], singular value decomposition [8, 9], ensemble empirical mode decomposition [10, 11], and wavelet transform [12, 13]. Those methods are widely used in the fault diagnosis of mechanical
equipment and have achieved fruitful results, but they all improve detection by filtering noise. When using those methods to reduce noise, a useful signal may be reduced or even destroyed. However, stochastic resonance (SR) is a recent noise-assisted data processing method. Compared with the traditional weak signal detection method, SR does not eliminate noise to detect weak signals, but transfers noise energy to weak signals and improves weak signal while eliminating noise. SR was first proposed in the study of paleometeorological glaciers by Benzi [14]. Then with increasing research by experts, SR began in physics [15], chemistry [16], and biology [17], and has been applied in many engineering and technical fields. To overcome the limitation of small parameters under the condition of adiabatic approximation, Tan et al. proposed an
adaptive frequency-shifted and rescaling transform SR method for a time-frequency index to detect high-frequency signals in actual engineering [18]. Leng et al. studied the SR of a two-dimensional Duffing oscillator with large parameters [19]. Subsequently, Lei et al. proposed an adaptive overdamped SR weak fault diagnosis method based on an ant colony algorithm [20]. Li et al. used a chaotic ant colony algorithm to optimize system parameters and applied it to planetary gearbox fault diagnosis [21]. Liu et al. proposed an adaptive SR detection method based on an improved artificial fish swarm algorithm, the numerical simulation and bearing experiments show that this method can effectively extract weak fault signals [22]. Then, Li et al. proposed a multicomponent population average SR of singular value
extracting weak signals [23, 24]. Qiao et al. proposed a piecewise linear SR weak fault diagnosis method, which solved the output saturation characteristics of bistable SR by establishing a piecewise potential model [25]. Han et al. proposed an adaptive variable-scale frequency-shifted band-pass SR denoising method based on empirical mode decomposition to detect multifrequency weak signals [26].
However, the above studies were based on overdamped SR.In the overdamped SR, the inertia and damping factor are neglected. When considering the system inertia and damping factor, the SR model becomes a second-order differential equation, which is
equivalent to secondary filtering and has better signal output effect. Therefore, researchers have further studied underdamped SR. In terms of underdamped SR, Lu et al. proposed a bistable underdamped SR method, which adjusted the system parameters by variable step size to achieve the maximum SNR output [27]. López proposed underdamped SR based on the FitzHugh–Nagumo potential and used an improved particle swarm optimization algorithm to achieve optimal parameter matching, the effectiveness of that method was verified by simulation and bearing experiments [28]. Lei et al. used the synergistic effect of the vibration signal, potential structure, and damping factor and used the weighted SNR as the evaluation index of the output signal to achieve weak signal extraction [29]. The above studies achieved
certain research results in underdamped SR but were limited to a bistable SR system. The potential structure adjustment was too singular and it was difficult to form a rich potential structure, so the optimal match between potential structure, noise, and the periodic signal could not be achieved. In addition, a bistable SR system achieves noise energy consumption by adjusting the barrier height and the well depth. However, excessive adjustment of a nonlinear potential system not only increases the response time of the system but also increases its instability.
To solve the above problems, we propose a weak fault diagnosis method for a periodic potential underdamped stochastic resonance (PPUSR) system. This method can not only independently adjust the barrier height, depth and width of the potential
algorithm. At the same time, the continuous potential well can consume excessive noise energy, thereby reducing noise interference, improving the stability of the system, and enhancing weak signal detection ability.
The rest of the paper is as follows: Section 2 describes the PPUSR model, SNR of the PPUSR model, and parameters optimization based on ant colony algorithm. Section 3 proposes a weak fault diagnosis method for PPUSR and simulates the method. Section 4 describes the verification of the effectiveness of the proposed method through gear experiments in the lab and rolling mill gearbox engineering practice. Section 6 is the
conclusion.
2. PPUSR method
2.1. The introduction of PPUSR model
SR uses the synergy of the input signal and noise in a nonlinear system to enhance the signal energy and identify weak signals. The three conditions generated by SR are nonlinear systems, input signals, and noise. When the three all achieve optimal matching relations, SR has the most obvious amplification effect on the signal. The traditional SR is bistable or tristable, affecting the enhancement of weak signals, in order to improve the weak signal enhancement ability for SR. In this paper, PPUSR
potential model is studied,the nonlinear system that is potential function [30]
introduced is
2 0
( ) cos ( )
U x =U kx
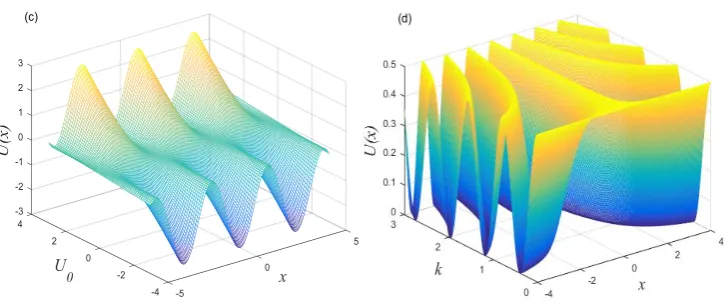
Fig. 1. Potential function U x( ) versus x. (a) Different parameter k with fixed U0 =1. (b) Different parameter k with fixed U0 =2. (c) Three-dimensional potential function U x( )
versus U0 and x with fixed k=1. (d) Three-dimensional potential function U x( ) versus
k and x with fixed U0 =0.5.
The potential model changes with the parameters, as shown in Fig. 1. Fig. 1a and 1c
show that as the potential system parameter U0 increases, the bottom position of the potential well is fixed, and the barrier height and well depth increase continuously. In Fig. 1b and 1d, when the potential system is adjusted with the increase of k, the barrier height and well depth are unchanged, but the width of the potential well gradually
increases. As the parameters U0 and k increase, the potential depth, the barrier height, and the width increase, and vice versa. Therefore, the change of the barrier
To further analyze the PPUSR mechanism, and the SNR of the PPUSR potential model is analyzed here. In accordance with the potential model, we considered particle motion in a PPUSR system to get
( )
( )
( )
2 2
dU x
dx dx
S t N t
dt = − dt − dt + + (2)
where U x( ) is the periodic potential function. is the damping factor.
( )
cos 2 dS t =A f t is a periodic signal, where A is amplitude, fd is frequency.
( ) 2 ( )
N t = D t is the Gauss white noise with zero mean satisfies
[ ( ) ( )] 2 ( )
E N t n t− = D , D is noise intensity. Combining Eq. (1) with Eq. (2)
yields
( ) ( )
20
2 2 cos sin cos 2 d 2 ( )
dx dx
kU kx kx A f t D t
dt = − dt + + (3)
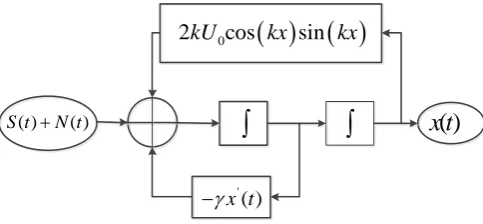
The PPUSR system model is shown in Fig. 2.
( ) ( ) S t +N t
( ) ( )
02kU cos kx sin kx
' ( )
x t
−
x t( )Fig. 2. PPUSR system model
2.2. SNR analysis of PPUSR potential model
To analyze the output SNR of the PPUSR model under small parameters, first let
=0
( ) ( )
( )
( )
02 +Acos Ω 2
dx y dt dy
kU cos kx sin kx t D t
dt = = + (4)
In addition, letA=0, D=0, and dy 0
dt = . In the range (0,2)
, Eq. (4) can get the two
singular points as follows:
(
1, 1)
, 0 2x y
k
= and
(
x y2, 2)
, 0k
= . The Jacobian
matrix obtained by linearizing Eq. (4) at the singularity
(
x y1, 1)
is 1 2 0 0 1 2 0 R k U = − , and its corresponding singular value is 2 1 2 2k U0
,= − . Similarly, the Jacobian
matrix obtained by linearizing Eq. (4) at the singularity
(
x y2, 2)
is 2 2 0 0 1 2 0 R k U = , and its corresponding singular value is 2
1 2 0
λ,= 2k U . Then the steady-state
probability density function ( , , )x y t of the particle motion can be derived by using
the Fokker–Planck equation [31]
(
)
(
)
(
( ) ( )
)
(
)
(
)
0
2 2
ρ , , yρ , , 2 cos sin A cos Ωt , ,
x
ρ , ,
x y t x y t kU kx kx x y t
t y
D x y t
x y = − − + + + (5)
According to the adiabatic approximation theory, the SPD function corresponding to Eq. (5) can be further derived as
( , , )
( , , ) exp[ e ]
st
U x y t x y t N
D
= − (6)
where N is the normalized constant and U x y te( , , ) is the generalized potential
(
)
2 2( )
01
, , cos Ω
2 e
U x y t = y +U cos kx −Ax t
(7)
To further analyze the mechanism of the SR potential model, we concluded that the escape rate of particles is
( )
1 2 1(
2 2)
(
1 1)
2
, , t , ,
β β λ
R exp
2π λ D
e e
U x y U x
t y t
− +
= −
(8)
Eq. (7) is substituted into Eq. (8) to get
( )
1 2 1 02
β β λ
exp exp cos Ω
2π λ 2
U A R t D Dk t = − −
(9)
The Taylor expansion of Eq. (9) can be obtained by
( )
1 2 1 0 2 22
β β λ 1
exp 1 cos Ω cos Ω
2π λ 2 2 2
U A A
R t t
D Dk Dk
t
= − − + +
(10)
Let 0 1 2 1 0
2 β β λ exp 2π λ U R D = − −
. Due to the output power spectrum of the system is
( )
1( )
2( )
S ω =S ω +S ω (11)
where let 1 0
2
A
R R
Dk
= , so we can get
(
)
(
) (
)
3 2 2 1
1 2 2 2
0 β δ ω Ω δ ω Ω 8 Ω R R S k = − + +
+ (12)
(
)
(
)
2 2 2 2
0 1
2 2 2 2 2 2
0 0
2 R
R β 1
2 R Ω 4 R Ω
S k = − + + (13)
( )
(
)
1
2 0
0 2 2
1
0 0
2 2 2
2 2
2 0 0
2
2 exp
S ω dω π U
exp 1
S ω Ω 32 2
16 exp Ω
2π
U U A
A D
SNR
k D D k U U
D
D
−
−
= = − −
= − +
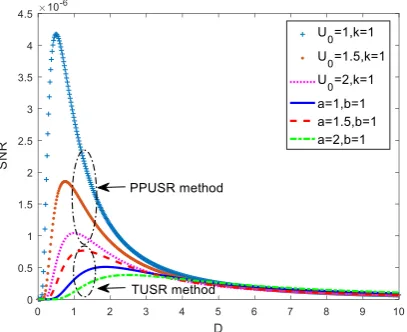
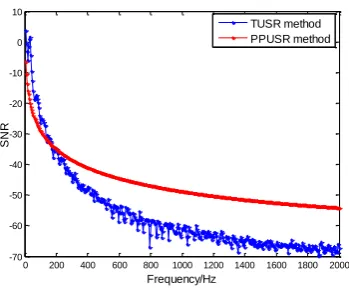
(14)To show the advantage of using the proposed method to process the signal, under the same noise intensity, the SNRs with a change of the potential parameter are shown in Fig. 3. The SNR curve of the PPUSR method is also obtained, and the SNR is much higher than that of the traditional underdamped stochastic resonance (TUSR) method in [27]. Therefore, it can be concluded that for the same noise intensity and parameters, the ability of PPUSR to extract weak faults is much better than that of TUSR method.
Fig. 3. Comparison of SNR between PPUSR method and TUSR method
2.3. Parameters optimization based on ant colony algorithm
According to the above analysis, the parameters can be optimally matched by
adjusting the parameters U0 and k . This paper optimizes the system parameter adjustment potential model based on the ant colony algorithm to achieve the best match between the potential model, the input signal and noise, thus obtaining the best SNR output. The ant colony system was first proposed by the Italian scholars Dorigo and Maniezzo [32]. The basic idea of applying the ant colony algorithm to solve the optimization problem is that the ants with shorter paths release more pheromone. With the advancement of time, the concentration of pheromone accumulated on the shorter
the end, the whole ants will concentrate on the best path under the action of positive feedback, and the corresponding solution is the optimal solution to be optimized.
In order to compare the SNR output of PPUSR method and TUSR method, the ant colony algorithm is used to optimize the parameters of two SR systems. Simulate a
small parameter signal, S t( )=Acos(2 f t0 ), where the sampling frequency fs =5, signal amplitude A=0.01, signal frequency f0 =0.008, noise intensity D=0.5, data length N=5000, number of ants m=100, pheromone evaporation coefficient
0.9
= , maximum iteration number n=20, pheromone increase intensity coefficient
200
Q= , pheromone concentration q=200, damping factor =1. The parameters
optimization range are [0, 10], the matching parameters and SNR are obtained by the
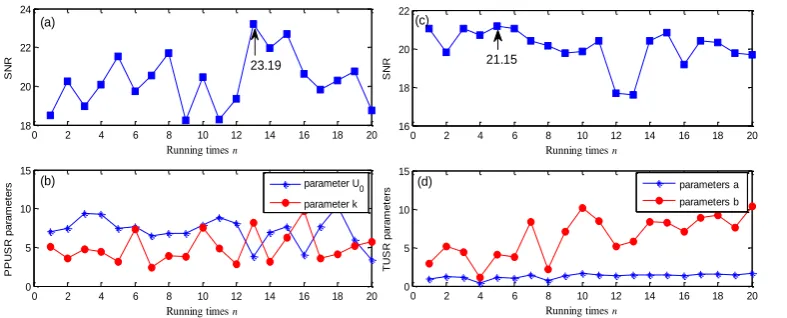
ant colony algorithm optimization system parameters of PPUSR method and TUSR method in Fig. 3. Comparing Figs. 3a and 3b, the output SNR of PPUSR method is 23.19 dB, and the output SNR of TUSR method is 21.15 dB. Therefore, it can be judged that the PPUSR method has a better SNR output under the same conditions, that is, has better SR effect.
Fig. 4. Output SNR of PPUSR and TUSR method for ant colony
0 2 4 6 8 10 12 14 16 18 20
18 20 22 24
Running times n
S
N
R
0 2 4 6 8 10 12 14 16 18 20
0 5 10 15
Running times n
P P U S R p a ra m e te
rs parameter U0
parameter k
(a)
(b)
23.19
0 2 4 6 8 10 12 14 16 18 20 16
18 20 22
Running times n
S
N
R
0 2 4 6 8 10 12 14 16 18 20 0
5 10 15
Running times n
TU S R p a ra m e te
rs parameters a
parameters b
(c)
(d)
3. The weak fault diagnosis strategy based on PPUSR model
3.1. PPUSR weak fault diagnosis method
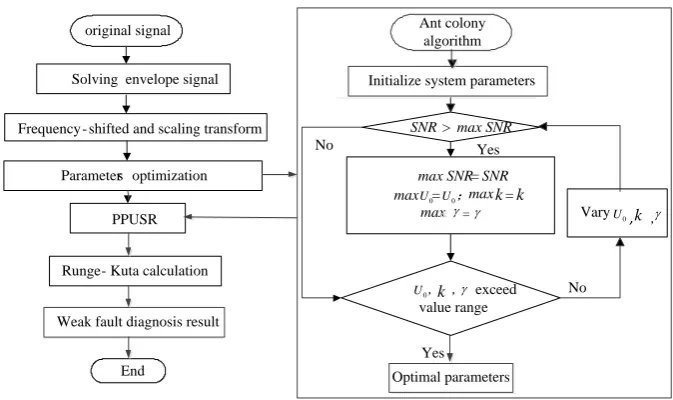
In accordance with the above analysis, we propose a weak fault diagnosis method for the PPUSR model. The main process is described as follows:
Parameters optimization
Runge- Kuta calculation
End
Yes
Initialize system parameters
SNR > max SNR
max SNR = SNR max = ;max =
max
exceed value range
Vary , No
No Yes
=
Solving envelope signal
PPUSR original signal
Frequency- shifted and scaling transform
=
, ,
Ant colony algorithm
Weak fault diagnosis result
Optimal parameters
0
U
0
U
0
U U0
k
k , k k
Fig. 5. PPUSR weak fault diagnosis process
(1) Signal preprocessing. The collected vibration signal is processed to obtain an
envelope signal. Then the input signal is initially processed by using a shifting-frequency and rescaling transform to meet small parameter requirements under approximate adiabatic conditions.
(2) Initializing of the parameters of the system. The parameters include ant colony size, step size, optimization range, maximum iteration number, pheromone evaporation coefficient, and the pheromone increasing intensity coefficient.
(3) Parameter optimization. Calculate the corresponding probability according to the prior knowledge and pheromone concentration, and find the optimal path of the ant;
that is, find the optimal combination of parameters U0 and k.
( )
( )
( )
( )
(
)
' 1 1 1 '2 2 2
2 1
'
3 3 3
3 2
'
4 3 4 3 4
1 2 3 4
1 2 3 4
; ;
/ 2 ;
/ 2;
1 1
/ 2;
/ 2; 1 1
1 ( 2 2 ) / 6;
1 2 2 /
x U x n y S n N n y y n
x U x n y h y S n N n y y n x h
x U x n y h y S n N n y y n x h
y y n x h x U x n y h y S n N n
x n x n y y y y h y n y n x x x x h
= − − + + = = + = − + − + + = + = − + − + + + + = + = − − + − + + + + + = + + + +
+ = + + + + 6;
(15)
where f t x( , ) is the two derivatives of the potential function, and h is the calculated
interval.
10 / 2 1
10 log ( d )
N i d i A SNR A A = = −
(16)where N is the data length, Ad is amplitude of the fault characteristic frequency in
the power spectrum,
/ 2 1 N i d i A A = −
is amplitude of the power spectrum for sum noise.(5) Evaluation of output results. Find the optimal SNR and the corresponding optimal parameter match. If the optimal parameter is within the optimization range, expand the range of the corresponding parameter and return to step 3; otherwise, go to step 6. (6) Signal post processing. Substituting the obtained optimal parameters into the PPUSR system, the fault characteristic frequency of the vibration signal is finally extracted.
3.2. Simulation verification
The parameters of PPUSR method and the TUSR method were set to U0 = =k 1, 1
a= =b respectively, and the frequency response curves were obtained in Fig. 6. We can get the SNR curves of both methods decreasing with increasing frequency.
Fig. 6. Frequency response of PPUSR and TUSR methods
To verify the effectiveness of the proposed method, we processed the simulated gear fault signal by the PPUSR weak fault diagnosis method. The noise was added as signal interference. The simulated gear fault signal was expressed by
2( ) sin(2 ) exp [ ( ) d] 2 ( )
S t =A ft −d t−n t T + D t
(17)
The PPUSR equation for the simulated gear fault signal was
( ) ( )
( )
2
0
2 2 cos sin
dx dx
kU kx kx S t
dt = − dt + (18)
where A=1 is the signal strength, f =1KHz is the modulation frequency, d =6fs
( fs =10KHz is the sampling frequency) is the attenuation rate, n
( )
t =[t/Td] is thecontrol pulse,
( )
t is the Gaussian white noise, 2D =1 is the noise intensity,0.01786 d
T = is the interval pulse ( fd =1/Td =56Hz is the drive frequency), and the
sampling time is 0.5 s. Figs. 7a and 7b show the simulated gear fault signals without
and with noise respectively.
0 200 400 600 800 1000 1200 1400 1600 1800 2000 -70
-60 -50 -40 -30 -20 -10 0 10
Frequency/Hz
S
N
R
Fig. 7. Simulated gear signals. (a) Periodic signal without noise. (b) Periodic signal with noise. (c) Spectrum. (d) Envelope spectrum.
Fig. 8. PPUSR and TUSR methods to extract simulated gear faults. (a) PPUSR method waveform. (b) PPUSR method spectrum. (c) TUSR method waveform. (d) TUSR method spectrum. We can be seen from Fig. 7c that the simulated gear fault signal does not detect any fault information in the spectrum due to strong noise interference. In Fig. 7d, the target
signal is also completely covered by the strong noise, so the fault frequency of the simulated gear signal is not recognized. To verify the effectiveness of the proposed method, the envelope signal was processed by the PPUSR system. To meet the requirements of small parameters, the envelope signal was a shifting-frequency and rescaling transform, and then the ant colony algorithm was used to adaptively optimize the system parameters and damping factor; the parameter combination was
0.4723
U = , k=1.2, and =0.06. When the parameters were put into the PPUSR
can be seen from Fig. 8a, the time domain waveform exhibited a periodic variation. In Fig. 8b, it can be seen that the simulated fault characteristic frequency was prominent, and its amplitude was 0.16736 higher than the surrounding noise. As a comparison with the proposed method, we used the TUSR method to process the simulated gear signals. The ant colony algorithm was also used to optimize the system parameters and damping
factors to obtain a=1.102, b=4.96, and =0.0075. The parameters were put into
the TUSR system, and the time domain and spectrum were obtained, as shown in Figs. 8c and 8d. The fault characteristic frequency could also have been extracted by the TUSR method, but the characteristic frequency peak was seriously interfered with by the surrounding noise, and its amplitude was only 0.03971 higher than that of the surrounding noise. The above analysis shows that when the noise was too large, the
periodic potential could consume too much noise interference through multiple potential wells, and the bistable system was singular due to the adjustment of the system potential structure. When the noise was driven too much, the instability of the bistable system was enhanced, which affected the enhancement of the weak signal.
4. Experimental verification
4.1. Gear experimental verification
To further verify the effectiveness of the proposed method, we detected a gear fault characteristic frequency using the power transmission fault diagnosis test bench shown in Fig. 9. We cut a crack 1 mm deep and 0.15 mm wide in the root of the gear in the root direction to simulate an early failure. The modulus of the gear was 1.5. The
parameters of the gear were Z1=100, Z2 =29, Z3 =90, and Z4 =36. The motor speed was 840 r/min, the sampling frequency was 5120 Hz, and the data length was 4,096 points. Because the speed of the motor was reduced by a planetary gearbox, the
transmission ratio was 4.571, so the input shaft speed of the parallel shaft gearbox was 183.767 r/min; that is, the rotation frequency was 3.063 Hz. According to vibration analysis theory, the fault characteristic frequency of the faulty tooth was
10.561 d
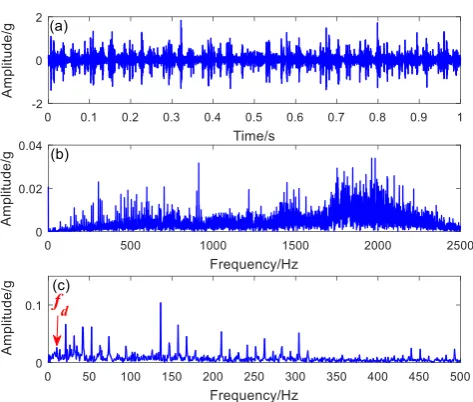
f = Hz. The time domain waveform and spectrum of the vibration data
time domain waveform that although multiple impacts can be seen, the target frequency could not be determined due to noise interference, and there were multiple low-frequency and high-low-frequency noises in the spectrum; the fault characteristic low-frequency components were completely covered by noise. In Fig. 10c, the fault characteristic frequency can be seen, but the interference frequency was too high. The fault characteristic frequency could not be accurately judged. The fault characteristic frequency was extracted by the PPUSR method and the TUSR method. To meet the small parameter requirement, by using the ant colony algorithm to optimize the
parameters and damping factors of the two systems, we got U0 =1.627, k=0.684,
0.019
= , and a=1.275, b=2.064, =0.0021. The parameters and damping
factors were substituted into the SR system. The time domain waveforms and spectrum are shown in Fig. 11. Comparing Fig. 11a with 11c, the PPUSR method clearly had greater periodicity than did the TUSR method. Comparing Fig. 11b with 11d, it can be seen that the fault characteristic frequency extracted by the PPUSR method was
obviously manifested, the doubling frequency component appeared, and the fundamental frequency amplitude was 1.0217 higher than that of the surrounding noise. The TUSR method also extracted the fault characteristic frequency, but it was seriously interfered with by the surrounding noise. The fundamental frequency amplitude was only 0.1054 higher than the surrounding noise, and the doubling frequency was also interfered with by the noise. Therefore, the gear failure experiment demonstrated again that the proposed method was superior to the TUSR method and had better recognition.
Fig. 10. Gearbox faults: (a) Waveform. (b) Spectrum. (c) Envelope spectrum.
Fig. 11. PPUSR and TUSR methods to extract gearbox faults: (a) PPUSR waveform. (b) PPUSR spectrum. (c) TUSR waveform. (d) TUSR spectrum.
4.2. Rolling mill Gear experimental verification
When the rolling mill was inspected, it was found that the gearbox had slight abnormal vibration, but the equipment failure detection system did not issue an alarm, and the equipment was still in normal operation. The rolling mill gearbox is shown in Fig. 12a. In order to detect and prevent fault in the early stage, the measuring point of the acceleration sensor was arranged in the axial position of the input shaft of the rolling mill gearbox. The ZonicBook/618E tester was used to collect the vibration signal of the measuring point. The sampling frequency is 2560 Hz. The numbers of sampling points were 2048 points, the motor speed was 1300r/min, and the corresponding input shaft
surrounding noise, and the impact signal cannot be seen. In Fig. 13b, the frequency of 715 Hz is the maximum energy, and a dense sideband occurs. According to Table 2, the fault may appear on the transmission axis II, but the energy of the sideband is small, and the interval of the sideband cannot be determined. In Fig.13c, although we can see the fault characteristic frequency of the gear, the surrounding noise is seriously disturbed. Therefore, we cannot judge the specific faulty gear. The gear signals were processed by the proposed method and the TUSR method. The ant colony algorithm is used to optimize the system parameters and damping ratio, and the combination of
parameters were U0 =0.25 , k=1.423, r=0.197 and a=2.7 , b=0.0109, 0.402
r= ,respectively. Comparing with Fig. 14a and Fig. 14c, the time domain waveform curve has better periodicity in Fig. 14a. In Fig. 14b and 14d, both methods
yield a characteristic frequency of 19.2 Hz. According to Table 1, it can be judged that the gear on the transmission shaft II is faulty. Through disassembly, we find that the gear on the transmission shaft II has broken tooth in Fig. 12b, which was consistent with the actual situation. Comparing Fig. 14b and 14d, Fig. 14b not only has the characteristic frequency but also the frequency multiplication was seen, and the recognition degree of the gear fault characteristic frequency was better. Therefore, the effectiveness of the proposed method was proved again by the gear fault, and it had better effect than the TUSR method.
Fig. 12 Rolling mill gearbox faults: (a) Fault detection site. (b) Gear broken tooth
Table 1. Frequency conversion of each axis and meshing frequency of each gear pair Transmission
shaft
Tooth ratio
Rotating speed (r/min)
Rotation frequency(Hz)
Meshing frequency(Hz)
II 33/38 1129 18.82 715
III 42/89 533 8.89 790
IV 21/74 151 2.52 186
V 24/85 43 0.72 61
VI 38/38 43 0.72 27
Fig. 13. Rolling mill gearbox faults: (a) Waveform. (b) Spectrum. (c) Envelope spectrum.
Fig. 14. PPUSR and TUSR methods to extract rolling mill gearbox faults: (a) PPUSR waveform. (b) PPUSR spectrum. (c) TUSR waveform. (d) TUSR spectrum.
5. Conclusion
To overcome disadvantage of TUSR fault detection method, this paper proposes a PPUSR method and studies the potential function, and SNR of the simulated system based on the PPUSR phenomenon. After presented method was validated by theoretical and experimental, the following conclusions can be drawn:
well by adjusting the parameter U0. Therefore, it has a richer potential model structure and can achieve the best match between potential structure, periodic signal, and noise.
(2) When the noise is too great, the oscillation of the particles between potential wells in the TUSR system is too fast due to the limitation of the potential model. The excessive noise will cause noise interference in a finite bistable system, which will easily lead to instability of the system. PPUSR can make the particles transition through multiple potential wells, thus consuming excessive noise energy and improving the stability of the system.
(3) According to experimental and engineering application verification results, the PPUSR weak fault diagnosis method can obtain larger fault characteristic frequency amplitude than can the TUSR method. In addition, PPUSR method had a better SNR
for extracting high-frequency signals than the TUSR method.
Acknowledgement
This work was supported in part by the National Natural Science Foundation of China
(NSFC) under Grant 51805275, and in part by the Beijing Key Laboratory of Long-life Technology of Precise Rotation and Transmission Mechanisms under Grant BZ0388201703.
References
[1]Y. Tan, H. Zhang, H. Zhou. A Simple-to-Implement fault diagnosis method for open switch fault in wind system PMSG drives without threshold setting, Energies, 11(2018) 2571.
[2] Z. Feng, X. Chen, M. Liang. Joint envelope and frequency order spectrum analysis based on iterative generalized demodulation for planetary gearbox fault diagnosis under nonstationary conditions, Mechanical Systems and Signal Processing, (2016) 242-264.
[3] R. Dhekale, B. Jadhav, P. Patil. Satellite image (multispectral) enhancement techniques in wavelet domain: An overview, International Journal of Computer Applications, 112 (2015) 16-20. [4] D. Abboud, J. Antoni, S. Sieg-Zieba, M. Eltabach. Envelope analysis of rotating machine vibrations in variable speed conditions: A comprehensive treatment, Mechanical Systems and Signal Processing, (2017) 200-226.
Low-Speed rotating machinery, IEEE Transactions on Instrumentation and Measurement, 8 (2018) 1887-1899.
[6] W. Liu, Q. Gao, G. Ye, R. Ma, X. Lu. A novel wind turbine bearing fault diagnosis method based on integral extension LMD, Measurement, (2015) 70-77.
[7] N. Huang, L. Fang, G. Cai, D. Xu, H. Chen, Y. Nie. Mechanical fault diagnosis of high voltage circuit breakers with unknown fault type using hybrid classifier based on LMD and time segmentation energy entropy, Entropy, 9 (2016) 322.
[8] A. Drouot, H. Noura, L. Goerig, P. Piot. Actuators additive SVD-based fault-tolerant control for a combat aircraft, Control Applications, (2015) 960-965.
[9] B. Yang, R. Liu, X. Chen. Fault diagnosis for a wind turbine generator bearing via sparse representation and Shift-Invariant K-SVD, IEEE Transactions on Industrial Informatics, 3 (2017) 1321-1331.
[10] L. Yu, W. Dai, L. Tang. A novel decomposition ensemble model with extended extreme learning machine for crude oil price forecasting, Engineering Applications of Artificial Intelligence, (2016) 110-121.
[11] Y. Lei, M. Zuo. Fault diagnosis of rotating machinery using an improved HHT based on EEMD and sensitive IMFs, Measurement Science and Technology, 12 (2009) 125701.
[12] J. Seshadrinath, B. Singh, B. Panigrahi. Incipient interturn fault diagnosis in induction machines using an analytic wavelet-based optimized Bayesian inference, IEEE Transactions on neural networks and learning systems, 5 (2014) 990-1001.
[13] J. Chen, J. Pan, Z. Li, Y. Zi, X. Chen. Generator bearing fault diagnosis for wind turbine via empirical wavelet transform using measured vibration signals, Renewable Energy, (2016) 80-92. [14] B. McNamara, K. Wiesenfeld. Theory of stochastic resonance, Physical Review A, 9 (1989) 4854-4869.
[15] F. Duan, D. Rousseau, F. Chapeau-Blondeau. Residual aperiodic stochastic resonance in a bistable
dynamic system transmitting a suprathreshold binary signal, Physical Review E Statistical Nonlinear
and Soft Matter Physics, 1 (2004)011109.
[16] A. Flores, S. Manilla, N. Huidobro. Stochastic resonance in the synaptic transmission between hair cells and vestibular primary afferents in development, Neuroscience (2016) 416-429.
plasticity on the synchronisation in a random Hodgkin-Huxley neuronal network, Communications in Nonlinear Science and Numerical Simulation, 2015, 34.809
[18] J. Tan, X. Chen, J. Wang, H. Chen, H. Cao, Y. Zi, Z. He. Study of frequency-shifted and rescaling stochastic resonance and its application to fault diagnosis, Mechanical Systems and Signal Processing, 3 (2009) 811-822.
[19] Y. Leng, Z. Lai, S. Fan, Y. Gao. Large parameter stochastic resonance of two-dimensional Duffing oscillator and its application on weak signal detection, Acta Physica Sinica, 23 (2012) 316-322.
[20] Y. Lei, D. Han, J. Lin, Z. He. Planetary gearbox fault diagnosis using an adaptive stochastic resonance method, Mechanical Systems and Signal Processing, 1 (2013) 113-124.
[21] Z. Li, B. Shi. An adaptive stochastic resonance method for weak fault characteristic extraction in planetary gearbox, Journal of Vibroengineering, 2017, 19 (3): 1782-1792.
[22] X. Liu, J. Yang, H. Liu. Optimizing the adaptive stochastic resonance and its application in fault diagnosis, Fluctuation and Noise Letters, 4 (2015) 1550038.
[23] Z. Li, B. Shi. Research of fault diagnosis based on sensitive intrinsic mode function selection of EEMD and adaptive stochastic resonance, Shock and Vibration, 11 (2016) 2841249.
[24] Z. Li, B. Shi. Extracting weak fault characteristics with adaptive singular value decomposition and stochastic resonance, Transactions of the Chinese Society of Agricultural Engineering, 11 (2017) 60-67.
[25] Z. Qiao, Y. Lei, J. Lin, F. Jia. An adaptive unsaturated bistable stochastic resonance method and its application in mechanical fault diagnosis, Mechanical Systems and Signal Processing, (2017) 731-746.
[26] D. Han, P. Li, S. An. P. Shi. Multi-frequency weak signal detection based on wavelet transform and parameter compensation band-pass multi-stable stochastic resonance, Mechanical Systems and Signal Processing, (2016) 995-1010.
[27] S. Lu, Q. He, F. Kong. Effects of underdamped step-varying second-order stochastic resonance for weak signal detection, Digital Signal Processing, 36 (2015) 93-103
[29] Y. Lei, Z. Qiao, X. Xu, et al. An underdamped stochastic resonance method with stable-state matching for incipient fault diagnosis of rolling element bearings, Mechanical Systems and Signal Processing, (2017), 148-164.
[30] S.Saikia , A.Jayannavar , M.Mahato. Stochastic resonance in periodic potentials,Physical Review E Statistical Nonlinear and Soft Matter Physics, 83 (2011) 061121
[31] G. Hu, G. Nicolis, C. Nicolis. Periodically forced Fokker–Planck equation and stochastic resonance, Physical Review A, 42 (1990) 2030-2041.