Clinical Interventions in Aging
Dove
press
O r I g I n A l r e s e A r C h
open access to scientific and medical research
Open Access Full Text Article
Correlation of physical function with the
thickness of multiple muscles of the quadriceps
femoris in community-dwelling elderly individuals
Ken nishihara1
hisashi Kawai2
Takeshi Kera2,3
hirohiko hirano4
Yutaka Watanabe2
Yoshinori Fujiwara2
Kazushige Ihara5
hunkyung Kim2
Masashi Tanaka4
shuichi Obuchi2
1Department of Physical Therapy,
saitama Prefectural University, saitama, Japan; 2Tokyo Metropolitan
Institute of gerontology, Tokyo, Japan;
3Department of Physical Therapy,
Takasaki University of health and Welfare, gunma, Japan; 4Tokyo
Metropolitan geriatric hospital, Tokyo, Japan; 5Department of social
Medicine, hirosaki University graduate school of Medicine, Aomori, Japan
Purpose: The purpose of this study was to clarify the reference values of muscle thicknesses
by age and to elucidate the association of muscle thickness with physical function in a large group of community-dwelling elderly individuals.
Participants and methods: The muscle thicknesses of the rectus femoris (RF), vastus
interme-dius (VI), and quadriceps femoris (QF) in 777 of 831 enrolled elderly individuals were measured by ultrasonography, and physical function was measured using knee extension strength (KES), one-legged stance, walking, Timed Up and Go, and grip strength tests. Muscle thickness data were divided by sex and categorized into 5-year age groups. Differences in muscle thickness and KES among the age groups were examined, and correlations between muscle thickness and physical function test results were compared by age. The non-parametric independent two-sample Mann–Whitney U-test, Kruskal-Wallis test, and Spearman’s correlation coefficients were used in the statistical analysis.
Results: Thickness of the RF showed fewer significant differences among all groups and less
decreases compared to thickness of the VI in older age groups, especially in men. Thicknesses of the RF, VI, and QF correlated with KES in almost all the thicknesses of muscles in the 65–69 and 70–74 years age groups in men and in almost all age groups in women. The decrease in muscle thicknesses and degree of correlations with aging were different between men and women.
Conclusions: Reductions in the thicknesses of the muscles and KES differed by age group
and sex. Our results could be used for prescribing exercise in community-dwelling elderly individuals of varying ages.
Keywords: community-dwelling elderly individual, physical function, muscle thickness,
ultrasonogram
Introduction
Low activity level with age causes muscle volume decline with disuse muscle atrophy and changes in muscle tissue, such as sarcopenia, accompanied by a decrease in muscle strength and decline of physical function and disability in activities of daily living. Since the risk of falling significantly increases with declines in muscle volume, the establishment of a method to evaluate muscle function is imperative.1,2
Disuse muscle atrophy in elderly individuals tends to occur unevenly among muscles rather than occurring in all muscles uniformly. Ikezoe et al3 compared the muscle thicknesses between a group of young women and groups of elderly women, and reported that the muscle thicknesses of all muscles, except for the soleus, were significantly smaller in the groups of elderly women than in the group of young women. Furthermore, noticeable quadriceps femoris (QF) muscle atrophy occurred in the Correspondence: Ken nishihara
Department of Physical Therapy, saitama Prefectural University, 820 sannomiya, Koshigaya, saitama 343-8540, Japan Tel/fax +81 48 973 4315
email [email protected]
Journal name: Clinical Interventions in Aging Article Designation: Original Research Year: 2018
Volume: 13
Running head verso: Nishihara et al
Running head recto: Physical function and thicknesses of multiple QF muscles DOI: 177237
Clinical Interventions in Aging downloaded from https://www.dovepress.com/ by 118.70.13.36 on 20-Aug-2020
For personal use only.
Dovepress
nishihara et al
elderly group with long-term bed rest. The significant decline of muscle thickness in the lower extremities, except for the soleus, was also reported in another elderly group compared with a young group.4 The QF, one of the most important antigravity muscles along with the soleus for maintaining the standing position, is an important muscle when investigating changes in physical function with age.
Cross-sectional imaging of tissue by ultrasonography has recently attracted attention for safety reasons. Moreover, high-resolution imaging is possible because of technological advances of ultrasound devices with high reproducibility.5
The measurement of muscle thickness would be useful for evaluating muscle strength or performance, because muscle volume is associated with muscle strength and power; furthermore, the muscle cross-sectional area is correlated with muscle thickness.6–9
Some reports have compared ultrasound-measured muscle thickness of the QF or rectus femoris (RF), which is part of the QF, along with the vastus intermedius (VI), vastus lateralis, and vastus medialis, with physical function,10–13 but the sample sizes of these reports were not very large. More-over, fewer reports of the thicknesses of multiple muscles in the QF exist.14
Therefore, this study aimed to clarify age-specific refer-ence values of the thicknesses of multiple muscles, such as the RF and VI in the QF, for the possibility of unevenly occurring disuse muscle atrophy in community-dwelling older adults; and to elucidate, in more detail, the changes with aging by investigating the correlation of thicknesses of the QF, RF, and VI with physical function, as measured by knee extension strength (KES), walking speed, one-legged stance (OLS), and grip strength (GS).
Materials and methods
Participants
Participants were community-dwelling older adults aged 65–89 years. They were recruited through invitations for checkups that were sent to 6,699 residents in nine areas around the Tokyo Metropolitan Institute of Gerontology. A total of 831 elderly individuals (356 men, 475 women) were enrolled in this study.
Study approval was obtained from the Ethical Committee of the Tokyo Metropolitan Institute of Gerontology (approval number: H14 in 2016) and the Saitama Prefectural University Ethics Committee (approval number: 27055). Written informed consent was obtained from each participant before the study was performed.
Measurement of muscle thickness
The Mysono U6 (Medison, Seoul, Korea) ultrasound device was used. A linear probe (5–12 MHz) set to 8.8 MHz was placed on the participant’s skin perpendicular to the skin surface. The participant was fully relaxed and maintained a standing position. The measurement was performed at the midpoint between the anterior superior iliac spine and the upper edge of the patella according to the method described in previous reports.5,15 The probe was positioned perpen-dicular to the longitudinal QF axis, and a transverse plane scan was performed at a depth of 5 cm, or 5.5 cm in cases of insufficient images, in order to have the femur displayed on the image (Figure 1).
The thickness of the QF was defined as the distance between the lower boundary of the subcutaneous fat and the surface of the femoral bone. The RF and VI were considered to be separated by the fascia between the RF and VI. Thus, the thickness of the QF was the sum of the thicknesses of the RF and VI. To improve the image quality, the degree of the probe was adjusted slightly, and a generous amount of gel was applied between the probe and skin.
Measurement of physical function
Kes
A specially designed frame with a dynamometer attached (Isoforce GT610S, OG Giken, Okayama, Japan) was used
Figure 1 Ultrasonogram of the QF.
Notes: The dotted line indicates the reference for measuring the muscle thickness of each muscle. D1: muscle thickness of the rF; D2: muscle thickness of the VI.
Abbreviations: QF, quadriceps femoris; rF, rectus femoris; VI, vastus intermedius. ' PP
' PP
Clinical Interventions in Aging downloaded from https://www.dovepress.com/ by 118.70.13.36 on 20-Aug-2020
Dovepress Physical function and thicknesses of multiple QF muscles
to measure maximum isometric knee extension torque of the dominant leg (42 left legs and 789 right legs). The participant was seated in a chair of sufficient height, with his/her hip and knee in the initial position of 90° flexion. The participant’s ankle was placed against the pressure recording attachment of the dynamometer, and he/she exerted maximum effort in extending the knee for more than 3 seconds, during which the maximum exerted value was measured. The length between the lateral knee joint fissure gap and the attachment was measured. Maximum knee extension torque was calculated as the strength multiplied by the length (Nm). The values were measured twice and averaged.
Ols
The participant was asked to hang his/her upper limbs downward naturally with eyes open, and the time that one leg could be maintained off the floor was recorded; timing stopped when the foot touched the floor again. The longest measurement time was 60 seconds. If the lifted leg touched the supporting leg, the test was repeated.
normal walking (nW)
The participant was asked to walk at a natural speed for a total distance of 8 m. The time interval between when the foot first crossed the 3-m mark until the foot crossed the end of the measurement area was recorded.
Fast walking(FW)
The participant was asked to walk as fast as possible for a distance of more than 8 m. The values were measured twice and averaged.
Timed Up and go (TUg) test
The participant was initially seated on a chair with his/her back pressed against the back support; the times required to stand, walk to a marker placed 3 m from the chair, turn around, and return to a seated position were measured. The values were measured twice and averaged.
gs
GS of the dominant hand was tested as the participant stood with feet apart, taking care to prevent any compensatory motion.
These measurements of muscle thickness and physical function were performed according to methods described in previous reports, which showed large intraclass correlation coefficients of the measured values.5,16
The measurements of physical function were not obtained from participants with angina pectoris, myocardial infarction, severe diabetes (with hypoglycemic attack, a fasting plasma glucose level of 200 mg/dL or higher, or complications of retinopathy or nephropathy), or severe hypertension (systolic blood pressure of 180 mmHg or higher or diastolic blood pressure of 110 mmHg or higher), as revealed through nurses’ interviews. After excluding those individuals, 777 subjects underwent the measurements of physical function.
statistical analyses
All data by sex are expressed as median and 25th–75th percentile. The non-parametric independent two-sample Mann–Whitney U-test was used to compare characteristics between men and women.
The measured data were separated by sex, and then participants were grouped into 5-year age intervals up to 79 years of age; for example, there was one group for each sex in the 80-year-old or older age group in order to maintain more than 50 participants per group. The median values for thicknesses of the RF, VI, and QF are reported by sex and age groups (65–69, 70–74, 75–79, and 80 years or older). Non-parametric multiple comparisons were conducted using the Kruskal-Wallis test to examine the differences between each measured thickness among the groups. Furthermore, Spearman’s correlation coefficients between muscle thickness and measurements of physical function were examined. The correlation levels for this study were defined as follows: if the correlation coefficient (r) was ±0.2–0.4, then we considered it a weak correlation; if it was ±0.4–0.7, it was considered a moderate correlation; and if it was ±0.7–0.9, it was consid-ered a strong correlation. Statistical analyses were conducted with IBM SPSS, version 21.0 (IBM Corp., Armonk, NY). Statistical significance was defined as a P-value,0.05.
Results
Age-specific reference values of muscle
thickness and Kes
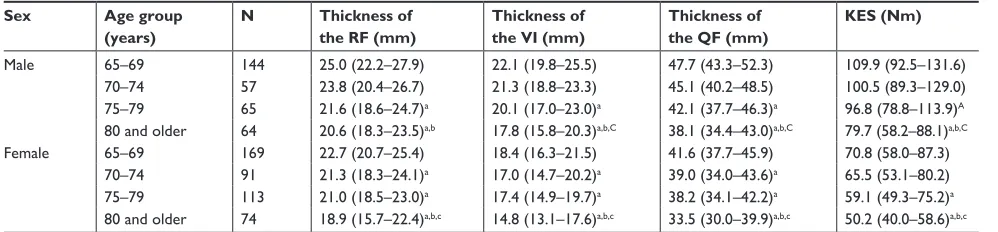
The participants’ characteristics are shown in Table 1. Refer-ence values of the thickness of the QF and KES by age groups are shown in Table 2 and separated by sex. Thicknesses of the RF, VI, and QF and KES were significantly decreased among age groups for men and women (Table 2).
Correlations between muscle thicknesses
and physical function test results
Significantly weaker or moderate positive correlations were identified between KES in multiple age groups and
Clinical Interventions in Aging downloaded from https://www.dovepress.com/ by 118.70.13.36 on 20-Aug-2020
Dovepress
nishihara et al
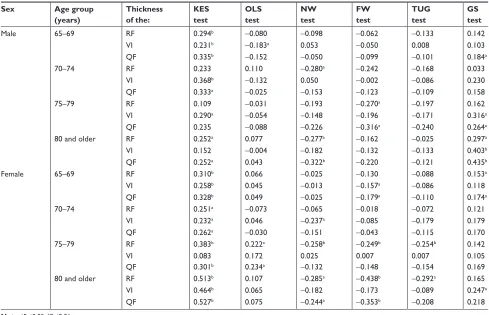
thicknesses of the RF, VI, and QF for men and women. A negative correlation was shown between fewer groups for muscle thicknesses and results of the NW, FW, and TUG tests, and positive correlations were shown for muscle thicknesses and GS among a few age groups for men and women (Table 3).
Discussion
Some participants in our study had chronic diseases; of the 777 participants, 342 had hypertension (44.0%), 48 had stroke (6.2%), 116 had heart disease (14.9%), and 98 had diabetes (12.6%). The rates of the four chronic diseases were very similar with those of a previous study (less than 1% differences), which investigated more than 4,471 participants of the same age (65 years or older) and almost similar sex and age distributions from four communities in Japan.17 There-fore, the measured data could be considered as the standard values for community-dwelling elderly persons.
Herein, we aimed to clarify the impact of changes in muscle thickness by investigating its relationship with physical function according to age groups, and our results are interpreted below.
Comparisons of muscle thickness and
Kes among age groups
The present study’s results showed that muscle thickness and KES decreased with aging because these values were signifi-cantly smaller in the older age groups than in the younger age groups (Table 2). This supports the notion that a decrease in muscle cross-sectional area with aging leads to a decrease in muscle strength.6 The thickness of the QF continuously decreases after middle age according to a previous study.18 However, the thicknesses of the RF, VI, and QF were main-tained until age 70–74 years in men, whereas those of the RF, VI, and QF decreased from age 70–74 years. KES was maintained in women aged 70–74 years in this study.
Table 1 Participants’ characteristics
Variable Men (n=330) Women (n=447) P-value
Age (years) 72.0 (66.0–78.0) 73.0 (67.0–78.0) =0.163
height (cm) 164.7 (160.1–168.7) 151.7 (147.9–155.2) ,0.001
Body mass (kg) 63.6 (57.6–70.8) 50.5 (46.2–55.6) ,0.001
BMI (kg/m2) 23.6 (21.9–25.6) 22.3 (20.3–24.2) ,0.001
Kes (nm) 100.3 (81.3–120.0) 62.5 (51.8–77.9) ,0.001
Thickness of the rF (mm) 23.5 (20.2–26.6) 21.8 (18.9–24.2) ,0.001
Thickness of the VI (mm) 20.7 (18.0–23.7) 17.3 (14.9–19.8) ,0.001
Thickness of the QF (mm) 44.5 (39.0–49.0) 39.4 (34.2–44.0) ,0.001
Ols (seconds) 60 (14.0–60.0) 60.0 (28.0–60.0) ,0.001
nW (seconds) 3.6 (3.2–4.0) 3.5 (3.2–3.9) =0.516
FW (sec) 2.45 (2.2–2.8) 2.6 (2.4–2.9) ,0.001
TUg test (sec) 5.0 (4.3–5.7) 5.3 (4.7–6.1) ,0.001
gs (kg) 35.0 (29.0–39.5) 22.0 (19.0–24.0) ,0.001
Note: Data are shown as median (25th–75th percentile).
Abbreviations: BMI, body mass index; FW, fast walking; gs, grip strength; Kes, knee extension strength; nW, normal walking; Ols, one-legged stance; QF, quadriceps femoris; rF, rectus femoris; TUg, Timed Up and go; VI, vastus intermedius.
Table 2 Multiple comparisons of muscle thicknesses and Kes among age groups
Sex Age group
(years)
N Thickness of
the RF (mm)
Thickness of the VI (mm)
Thickness of the QF (mm)
KES (Nm)
Male 65–69 144 25.0 (22.2–27.9) 22.1 (19.8–25.5) 47.7 (43.3–52.3) 109.9 (92.5–131.6)
70–74 57 23.8 (20.4–26.7) 21.3 (18.8–23.3) 45.1 (40.2–48.5) 100.5 (89.3–129.0)
75–79 65 21.6 (18.6–24.7)a 20.1 (17.0–23.0)a 42.1 (37.7–46.3)a 96.8 (78.8–113.9)A
80 and older 64 20.6 (18.3–23.5)a,b 17.8 (15.8–20.3)a,b,C 38.1 (34.4–43.0)a,b,C 79.7 (58.2–88.1)a,b,C
Female 65–69 169 22.7 (20.7–25.4) 18.4 (16.3–21.5) 41.6 (37.7–45.9) 70.8 (58.0–87.3)
70–74 91 21.3 (18.3–24.1)a 17.0 (14.7–20.2)a 39.0 (34.0–43.6)a 65.5 (53.1–80.2)
75–79 113 21.0 (18.5–23.0)a 17.4 (14.9–19.7)a 38.2 (34.1–42.2)a 59.1 (49.3–75.2)a
80 and older 74 18.9 (15.7–22.4)a,b,c 14.8 (13.1–17.6)a,b,c 33.5 (30.0–39.9)a,b,c 50.2 (40.0–58.6)a,b,c Notes: Data shown as median (25th–75th percentile). a,A 65–69 years age group, b70–74 years age group, and c,C 75–79 years age group (uppercase superscript letters (A,C):
P,0.05, lowercase superscript letters (a,b,c): P,0.01).
Abbreviations: Kes, knee extension strength; QF, quadriceps femoris; rF, rectus femoris; VI, vastus intermedius.
Clinical Interventions in Aging downloaded from https://www.dovepress.com/ by 118.70.13.36 on 20-Aug-2020
Dovepress Physical function and thicknesses of multiple QF muscles
After investigating thicknesses of the RF and VI in the QF among men and women, we found that thicknesses of the RF showed slightly fewer significant differences and less decreases in older age groups in men (Table 2). Because the thickness of the RF is considered to be maintained despite aging, changes in the RF and VI would manifest differently with aging, although both muscles partly form the QF. The RF and VI are located on the front of the femur and directly involved in knee extension; however, the decrease in the thickness of the QF with aging would occur mainly in the VI, whereas the thickness of the RF would be main-tained in men.
Correlation between muscle thicknesses
and physical function test results
A positive correlation was shown between KES and the thicknesses of the RF, VI, and QF in multiple age groups for men and women; however, fewer correlations were shown between muscle thicknesses and results of the OLS, NW, FW, and TUG tests for men and women, and between muscle thicknesses and GS in women (Table 3). Thus, among
the variables, KES was the most correlated with muscle thickness.
Thicknesses of the RF and VI correlated with KES in men aged 65–69 years, and only the thickness of the VI correlated with KES in men aged 70–74 years. In women, thicknesses of the RF and VI correlated with KES in women of all age groups, except the thickness of the VI in women aged 75–79 years.
Thickness of the QF, which is the sum of the thicknesses of the RF and VI, correlated with KES in three of four groups of men and all groups of women. In other words, muscle strength was determined by the muscle thickness in women, because the QF correlated with KES in all age groups. Muscle strength in men was related to muscle quality or the nervous system, not just muscle thickness, because the muscle thick-nesses were not correlated with KES in some age groups.
Changes in muscle thickness and Kes
with aging
The measurement of maximal muscle strength requires a large load to be applied to the related joint, and imposes a
Table 3 Correlation coefficients between muscle thicknesses and measurements of physical function
Sex Age group
(years)
Thickness of the:
KES test
OLS test
NW test
FW test
TUG test
GS test
Male 65–69 rF 0.294b -0.080 -0.098 -0.062 -0.133 0.142
VI 0.231b -0.183a 0.053 -0.050 0.008 0.103
QF 0.335b -0.152 -0.050 -0.099 -0.101 0.184a
70–74 rF 0.233 0.110 -0.280a -0.242 -0.168 0.033
VI 0.368b -0.132 0.050 -0.002 -0.086 0.230
QF 0.333a -0.025 -0.153 -0.123 -0.109 0.158
75–79 rF 0.109 -0.031 -0.193 -0.270a -0.197 0.162
VI 0.290a -0.054 -0.148 -0.196 -0.171 0.316a
QF 0.235 -0.088 -0.226 -0.316a -0.240 0.264a
80 and older rF 0.252a 0.077 -0.277a -0.162 -0.025 0.297a
VI 0.152 -0.004 -0.182 -0.132 -0.133 0.403b
QF 0.252a 0.043 -0.322b -0.220 -0.121 0.435b
Female 65–69 rF 0.310b 0.066 -0.025 -0.130 -0.088 0.153a
VI 0.258b 0.045 -0.013 -0.157a -0.086 0.118
QF 0.328b 0.049 -0.025 -0.179a -0.110 0.174a
70–74 rF 0.251a -0.073 -0.065 -0.018 -0.072 0.121
VI 0.232a 0.046 -0.237a -0.085 -0.179 0.179
QF 0.262a -0.030 -0.151 -0.043 -0.115 0.170
75–79 rF 0.383b 0.222a -0.258b -0.249b -0.254b 0.142
VI 0.083 0.172 0.025 0.007 0.007 0.105
QF 0.301b 0.234a -0.132 -0.148 -0.154 0.169
80 and older rF 0.513b 0.107 -0.285a -0.438b -0.292a 0.165
VI 0.464b 0.065 -0.182 -0.173 -0.089 0.247a
QF 0.527b 0.075 -0.244a -0.353b -0.208 0.218
Note:aP,0.05, bP,0.01.
Abbreviations: FW, fast walking; gs, grip strength; Kes, knee extension strength; nW, normal walking; Ols, one-legged stance; QF, quadriceps femoris; rF, rectus femoris; TUg, Timed Up and go; VI, vastus intermedius.
Clinical Interventions in Aging downloaded from https://www.dovepress.com/ by 118.70.13.36 on 20-Aug-2020
Dovepress
nishihara et al
temporary increase and decrease of blood pressure during the performance.19 In contrast, the measurement of muscle thickness with an ultrasound device might replace these high-intensity tests because there is less physical burden. Moreover, individual analysis of each muscle would also be possible.
Changes in muscle with aging have been reported to show decreased muscle volume and altered muscle quality, as exhibited by a mixture of fatty or connective tissue by echo intensity on an ultrasonogram.20,21 Age-related physical functional decline includes decreased muscle volume, and can accompany the accumulation of connective tissues in the affected muscles. There were no significant correlations between KES and thicknesses of the RF, VI, or QF in men aged 75–79 or 80 years or older; this could indicate the accumulation of connective tissues.
There are a few limitations to this study. First, the par-ticipants were community-dwelling older individuals. Thus, further research is needed to compare these data with groups of participants with other characteristics. Second, muscle thickness in older participants was not compared to that in young participants, such as those aged 20–29 years. Third, the region of interest used for measuring muscle thickness represents only a small portion of each muscle.
We think it would be very interesting to actively perform research in other similar groups around Japan. The results may show differences related to geography, or they may be very similar to those of our current study. Further research is needed on this topic, and we would be interested in compar-ing our data with findcompar-ings from future studies.
Conclusion
Reductions in the thicknesses of the muscles and KES dif-fered by age groups and sex. Furthermore, although the RF and VI jointly compose the QF, the decreases in muscle thicknesses and correlation with aging were different for each muscle.
Acknowledgments
This study was supported by JSPS KAKENHI (Japan Society for the Promotion of Science KAKENHI, grant numbers 15K01469 and 16K01853); the Research and Develop-ment Grants for Longevity Science from the Japan Agency for Medical Research and Development (grant number 16dk0110018h0001); and Longitudinal Study in Tokyo Metropolitan Institute of Gerontology.
Disclosure
The authors report no conflicts of interest in this work.
References
1. Malafarina V, Uriz-Otano F, Iniesta R, Gil-Guerrero L. Sarcopenia in the elderly: diagnosis, physiopathology and treatment. Maturitas. 2012; 71(2):109–114.
2. Woo N, Kim SH. Sarcopenia influences fall-related injuries in community-dwelling older adults. Geriatr Nurs. 2014;35(4):279–282. 3. Ikezoe T, Mori N, Nakamura M, Ichihashi N. Age-related muscle
atrophy in the lower extremities and daily physical activity in elderly women. Arch Gerontol Geriatr. 2011;53(2):e153–e157.
4. Ikezoe T, Mori N, Nakamura M, Ichihashi N. Atrophy of the lower limbs in elderly women: is it related to walking ability? Eur J Appl Physiol. 2011;111(6):989–995.
5. Fukumoto Y, Ikezoe T, Yamada Y, et al. Skeletal muscle quality assessed from echo intensity is associated with muscle strength of middle-aged and elderly persons. Eur J Appl Physiol. 2012;112(4):1519–1525. 6. Lexell J, Taylor CC, Sjöström M. What is the cause of the ageing
atrophy? Total number, size and proportion of different fiber types studied in whole vastus lateralis muscle from 15- to 83-year-old men. J Neurol Sci. 1988;84(2–3):275–294.
7. Lindemann U, Mohr C, Machann J, Blatzonis K, Rapp K, Becker C. Association between thigh muscle volume and leg muscle power in older women. PLoS One. 2016;11(6):e0157885.
8. Franchi MV, Longo S, Mallinson J, et al. Muscle thickness cor-relates to muscle cross-sectional area in the assessment of strength training-induced hypertrophy. Scand J Med Sci Sports. 2018;28(3): 846–853.
9. Kawakami Y, Akima H, Kubo K, et al. Changes in muscle size, archi-tecture, and neural activation after 20 days of bed rest with and without resistance exercise. Eur J Appl Physiol. 2001;84(1–2):7–12. 10. Strasser EM, Draskovits T, Praschak M, Quittan M, Graf A. Association
between ultrasound measurements of muscle thickness, pennation angle, echogenicity and skeletal muscle strength in the elderly. Age. 2013;35(6): 2377–2388.
11. Seymour JM, Ward K, Sidhu PS, et al. Ultrasound measurement of rectus femoris cross-sectional area and the relationship with quadriceps strength in COPD. Thorax. 2009;64(5):418–423.
12. Thomaes T, Thomis M, Onkelinx S, Coudyzer W, Cornelissen V, Vanhees L. Reliability and validity of the ultrasound technique to measure the rectus femoris muscle diameter in older CAD-patients. BMC Med Imaging. 2012;12:7.
13. Abe T, Loenneke JP, Thiebaud RS. Morphological and functional relationships with ultrasound measured muscle thickness of the lower extremity: a brief review. Ultrasound. 2015;23(3):166–173. 14. Giles LS, Webster KE, Mcclelland JA, Cook J. Can ultrasound
measure-ments of muscle thickness be used to measure the size of individual quadriceps muscles in people with patellofemoral pain? Phys Ther Sport. 2015;16(1):45–52.
15. Watanabe Y, Yamada Y, Fukumoto Y, et al. Echo intensity obtained from ultrasonography images reflecting muscle strength in elderly men. Clin Interv Aging. 2013;8:993–998.
16. Mijnarends DM, Meijers JM, Halfens RJ, et al. Validity and reliability of tools to measure muscle mass, strength, and physical performance in community-dwelling older people: a systematic review. J Am Med Dir Assoc. 2013;14(3):170–178.
17. Seino S, Shinkai S, Iijima K, et al. Reference values and age differences in body composition of community-dwelling older Japanese men and women: a pooled analysis of four cohort studies. PLoS One. 2015; 10(7):e0131975.
18. Arts IM, Pillen S, Schelhaas HJ, Overeem S, Zwarts MJ. Normal values for quantitative muscle ultrasonography in adults. Muscle Nerve. 2010; 41(1):32–41.
Clinical Interventions in Aging downloaded from https://www.dovepress.com/ by 118.70.13.36 on 20-Aug-2020
Clinical Interventions in Aging
Publish your work in this journal
Submit your manuscript here: http://www.dovepress.com/clinical-interventions-in-aging-journal
Clinical Interventions in Aging is an international, peer-reviewed journal focusing on evidence-based reports on the value or lack thereof of treatments intended to prevent or delay the onset of maladaptive correlates of aging in human beings. This journal is indexed on PubMed Central, MedLine,
CAS, Scopus and the Elsevier Bibliographic databases. The manuscript management system is completely online and includes a very quick and fair peer-review system, which is all easy to use. Visit http://www.dovepress. com/testimonials.php to read real quotes from published authors.
Dovepress
Dove
press
Physical function and thicknesses of multiple QF muscles
19. Seals DR, Washburn RA, Hanson PG, Painter PL, Nagle FJ. Increased cardiovascular response to static contraction of larger muscle groups. J Appl Physiol Respir Environ Exerc Physiol. 1983;54(2):434–437. 20. Pillen S, Tak RO, Zwarts MJ, et al. Skeletal muscle ultrasound:
correla-tion between fibrous tissue and echo intensity. Ultrasound Med Biol. 2009;35(3):443–446.
21. Nishihara K, Kawai H, Hayashi H, et al. Frequency analysis of ultrasonic echo intensities of the skeletal muscle in elderly and young individuals. Clin Interv Aging. 2014;9:1471–1478.
Clinical Interventions in Aging downloaded from https://www.dovepress.com/ by 118.70.13.36 on 20-Aug-2020