ECE for NTM control on ITER
H. van den Brand1a,2, M.R. de Baar1b,2, N.J. Lopes Cardozo1a and E. Westerhof2
1 (a) Fusion Science and Technology Group (b) Control Systems Technology Group,
Eind-hoven University of Technology P.O. Box 513, 5600 MB EindEind-hoven, The Netherlands 2 FOM Institute DIFFER - Dutch Institute for Fundamental Energy Research,
Associa-tion EURATOM-FOM, Trilateral Euregio Cluster, P.O. Box 1207, 3430 BE Nieuwegein, The Netherlands
Abstract. Control of Neoclassical Tearing Modes (NTMs) requires an accurate and low latency detection of the mode position. For a burning H-mode ITER plasma, simulations are conducted for both ECE detected via the equatorial port plug and along the line-of-sight of the ECCD launchers. Simulated ECE is detected using synthetic radiometers, with settings chosen to meet the required accuracy. A video bandwidth of 2 kHz is used which allows for an intermediate frequency bandwidth ofBIF = 400 MHz for ECE detected via the equatorial port plug. For ECE detected via the ECCD line-of-sight, an intermediate fre-quency bandwidth of 1.5 GHz and 1 GHz for the 2/1 and 3/2 NTM respectively suffices for accurate location detection. For both ECE systems, the latency re-quirements for NTM suppression are fulfilled.
1 Introduction
For high β H-mode plasmas in ITER, suppression of the m/n= 2/1 andm/n = 3/2 Neo-classical Tearing Modes (NTMs) is required, to prevent confinement degradation and disrup-tions.[1][2] Electron Cyclotron Current Drive (ECCD) counters the NTM current deficiency, resulting in a suppression of the mode.[3] Due to suboptimal placement of the ECCD launch-ers on ITER, full suppression of NTMs is required before mode locking (i.e. stop of rotation) occurs.[4] An accuracy in the ECCD deposition position of 5 mm and 7 mm is required for full suppression of the 2/1 and 3/2 NTM, respectively.[4] Based on a combined model of mode rotation and growth, the maximum allowed latency between the seeding of the NTM and the start of mode suppression using ECCD, that still results in full suppression of the mode, is found to be a few seconds, typically.[4] The mode position should be detected with at least the deposition accuracy within the maximum allowed latency. In this paper, the capabilities of Electron Cyclotron Emission (ECE) radiometry for an NTM control loop, which needs to satisfy the accuracy and latency constraints, are assessed for a standard burning H-mode ITER scenario 2 plasma and ECE measured through either the equatorial port plug and via the line-of-sight of ECCD.[5][6][7]
The next section discusses how simulations of ECE for NTM suppression on ITER are set up and used as input for the algorithm by Berrinoet al.[8] This section also shows how a realistic temperature perturbation is modelled based on the perturbation of the helical flux. The capabilities of ECE radiometry via the equatorial port and the line-of-sight ECE system are assessed in section 3 and section 4 respectively. The final section presents the conclusions.
DOI: 10.1051/ C
Owned by the authors, published by EDP Sciences, 2012 epjconf 201232/ 030 04
2 Simulation set-up
The signals detected by an ECE radiometer measuring an ITER plasma are simulated using a combination of models from literature. The evolution of island width and phase is described by a combined model by Van den Brandet al, which combines island growth described by the Generalized Rutherford Equation and a model for island rotation as put forward by La Haye et al.[4][1][9] The island width and phase, as a function of time, and radial position serve as input for the NOn-Thermal ECE Code (NOTEC), which calculates noise-free thermal ECE detected by an antenna viewing the ITER plasma.[10]
The NTM perturbs the temperature profile which depends on all three coordinates (rc, θ, φ),
wherercis the plasma minor radius in cylindrical coordinates,φthe toroidal andθthe poloidal
angle. The cylindrical radiusrc =
q
S(ψ0,σ)
π is determined by the surfaceS enclosed by the
equilibrium helical fluxψ0, whereσindicates the position relative to the rational flux surface withσ=−1 forrc< rc,s andσ= +1 forrc> rc,s, withrc,s the minor radius in cylindrical
coordinates of the NTM rational surface. The helical flux perturbation by a magnetic island is approximated by Yanget al by[11]
e
ψ=ψe(rc,s)
r2
c
r2
c,s
1−rc
a
2
1−rc,s
a
2cos (mθs+nφ+ξ0) , (1)
with ξ0 the phase of the NTM andθs the straight field line angle. Temperature is assumed
constant on the magnetic flux surfaces described by the perturbed helical flux ψ =ψ0+ψe and σ. Due to fast radial transport inside the island, the temperature is constant. Outside the island the radial transport is assumed to be unaffected, thus maintaining the equilibrium temperature gradients. Thus the NTM only effects the temperature outside the island by perturbing the flux surface shape and a temperature drop due to the fast radial transport in the island. The temperature T(rc, θ, φ) at position (rc, θ, φ) is therefore related to the
equilibrium temperature profileT0(rc) by
ψ(rc> rc,s, θ, φ)> ψsep andσ= +1 T(rc, θ, φ) =T0 q
S(ψ(rc,θ,φ),σ)
π
ψ(rc, θ, φ)< ψsep Tisl=T0 q
S(ψsep,+1)
π
ψ(rc< rc,s, θ, φ)> ψsep andσ=−1 T(rc, θ, φ) =T0 q
S(ψ(rc,θ,φ),σ)
π
−∆T
∆T =T0 q
S(ψsep,−1)
π
−T0
q
S(ψsep,+1)
π
, (2)
with ψsep the helical flux at the island separatrices and S(ψ, σ) the enclosed area in the
poloidal cross section by the flux surface defined byψ andσ. To the thermal ECE calculated using the perturbed temperature profile, thermal noise is added, determined by the video bandwidthBv and the intermediate frequency bandwidthBIF of the simulated multichannel
radiometer used for detection.[12]
The simulated ECE signals serve as input for the detection algorithm by Berrinoet al.[8] This algorithm detects the island position in terms of a detected frequency fdet, which can
be compared with the actual island frequency fisl, found from noise-free simulations. With
3 Equatorial ECE
In this section, the detection of the location of the island using ECE radiometers in the equatorial plane is considered. The second harmonic X-mode is used, because it provides higher spatial accuracy than the first harmonic O-mode for equal noise levels. In ITER the equatorial ECE antenna is located at major radius R= 8.5 m and height Z = 0.76 m.[6] A value of 6 cm FWHM is used for both beam widths which provides an upper estimate to the expected beam width.
A video bandwidth Bv = 2 kHz is used, which suffices for the detection of 3/2 and 2/1
rotating islands, based on the equilibrium toroidal plasma rotation frequency ω0 by La Haye et al (420 Hz for 2/1 and 578 Hz for 3/2).[13] An accuracy∆r of 7 mm for 2/1 and 5 mm for 3/2 magnetic islands in ECCD deposition position should be achieved to ensure full NTM suppression is possible.[4] This can be attained with BIF = 400 MHz for both the 2/1 and
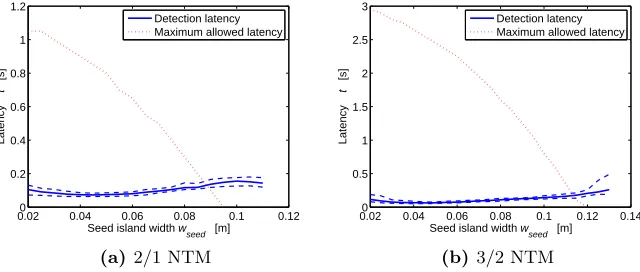
3/2 NTM, regardless of the exact positioning of the island relative to the channel spacing. Using an ECE channel layout with centre frequency ranging from 240.2 up to 249.4 GHz and up to 259.4 GHz for the 2/1 and 3/2 mode respectively, the detection latency is deter-mined. The detection latency is defined as the time difference between island seeding and the time at which the detected island location is within the required accuracy of 200 MHz or 150 MHz for the 2/1 and 3/2 NTM respectively and remains accurate for the remainder of the simulation run. The detection latency is determined for seed island widths varied from 2 cm up to 11 cm for 2/1 NTMs and up to 13 cm for 3/2 NTMs. Each simulation is re-peated 15 times with different random noise realizations. The mean, minimum and maximum detection latencies as a function of seed island width are shown in figure 1
0.020 0.04 0.06 0.08 0.1 0.12 0.2
0.4 0.6 0.8 1 1.2
Seed island width w
seed [m]
Latency
t [s]
Detection latency Maximum allowed latency
(a) 2/1 NTM
0.020 0.04 0.06 0.08 0.1 0.12 0.14 0.5
1 1.5 2 2.5 3
Seed island width w
seed [m]
Latency
t [s]
Detection latency Maximum allowed latency
(b) 3/2 NTM
Fig. 1: Detection latency as function of the seed island width for island location using equatorial ECE. The figures show the mean detection latency (solid) and the shortest and longest detection latency (dashed) determined from 15 runs with different noise realizations in blue. For comparison, the maximum allowed latency for a control loop for full suppression of ITER NTMs using ECCD is depicted as a red dashed line.[4]
Figure 1 shows that as the seed island width increases, the detection latency increases due to the reduced performance of the algorithm for larger island widths. Large islands result in regions of constant temperature leading to a decrease of temperature fluctuations in the ECE channels covering the island region to a value below the noise level. This, in turn, drastically decreases the anti-correlation between the two channels at opposite sides ofrc,s.
and thereby increasing the likelihood that the oscillation remains above the noise level. Detec-tion is fastest for seed island widths of 5 cm and all seed islands are detected within 500 ms.
4 Line-of-sight ECE
If equatorial ECE is used to determine the island position, both the relation between island ECE frequency and flux surface and the relation between the launcher angle and the flux surfaces should be accurately known. Using line-of-sight ECE, these relations are the same, i.e. for equal frequencies the ECE waves propagate along exactly the same path as the ECCD waves.[14] However, the orders of magnitude difference between ECE and ECCD power poses a technical challenge addressed for a system on ITER by Bongers et al.[7] Use of feedback based on an inline detection of the island ECE frequency to steer the EC mirror has been demonstrated on the TEXTOR tokamak by Hennen et al.[15] This section investigates the capabilities of a line-of-sight ECE system for ITER.
The LSMs of the UPLs are the preferred choice for a line-of-sight ECE system. The LSMs have a fixed toroidal angleβ = 18◦and a variable poloidal angleαand are positioned at major radiusR= 6.9 m and heightZ= 4.18 m.[16] The antenna pattern of the focussed beam viewed from the LSMs is simulated using a toroidal and poloidal beam width of wt= 3.25 cm and
wp = 1.5 cm and a toroidal convergence of 1◦. The same beam settings are used by Bertelli
et al to approximate the Gaussian beam profile near the 170 GHz EC resonance.[17] The detection capabilities of a line-of-sight ECE system on a UPL are addressed in this section.
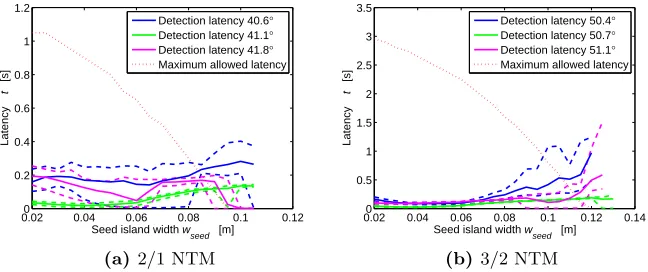
The optimal angle for ECCD deposited at the island O-point isα0= 41.2◦andα0= 50.7◦ for the 2/1 and 3/2 NTM respectively. A radial offset of 7 mm and 5 mm, for the 2/1 and 3/2 NTM respectively, is allowed, while maintaining full suppression capabilities.[4] Based on single ray simulations, it is found that an error in the launcher angle|∆α|<0.4◦results in sufficient positioning accuracy for the 2/1 NTM. For the 3/2 NTM, an accuracy of |∆α| < 0.15◦ is required. Accurate detection is reached with bandwidths of 1.5 GHz and 1 GHz for the 2/1 and 3/2 NTM respectively. As a result of a region of 1 GHz around 170 GHz in which no radiation is detected, the centre frequencies of the channel layout for the 3/2 NTM detection consists of a range from 161 to 169 GHz and from 171 to 179 GHz.
The mean, minimum and maximum detection latency, determined from 15 runs with dif-ferent noise realizations, are shown in figure 2 for four fixed launcher angles α. The island growth is modelled for different seed island widths.
Figure 2 shows that detection of all islands is successful for three angles for both the 2/1 and 3/2 NTM. At larger island widths, anti-correlation of the ECE channel is reduced by a flattened temperature profile in vicinity of the island, thereby increasing the detection latencies especially for the angles 50.4◦ and 51.1◦ for the 3/2 NTM. For the optimal angles
α0 = 41.2◦ and α0 = 50.7◦, for the 2/1 and 3/2 NTM respectively, this is not observed, because near the island the channels are spaced farther apart as a result of suppressed ECE in the frequency range from 169.5 GHz to 170.5 GHz. For the larger angleα= 45.1◦ for the 2/1 NTM, all islands are detected regardless of seed island width. For a larger angle difference
∆α, the beams are less tangential to the NTM rational surfaces. This results in a larger difference in radial position for the same frequency difference, compared to a tangential beam at smaller∆α, and, consequently, a larger frequency range that is located outside the island. The detection latency remains below 500 ms for the 2/1 NTM and 1 s for the 3/2 NTM.
5 Summary and conclusions
0.020 0.04 0.06 0.08 0.1 0.12 0.2
0.4 0.6 0.8 1 1.2
Seed island width w
seed [m]
Latency
t [s]
Detection latency 40.6° Detection latency 41.1° Detection latency 41.8° Maximum allowed latency
(a) 2/1 NTM
0.020 0.04 0.06 0.08 0.1 0.12 0.14 0.5
1 1.5 2 2.5 3 3.5
Seed island width w
seed [m]
Latency
t [s]
Detection latency 50.4° Detection latency 50.7° Detection latency 51.1° Maximum allowed latency
(b) 3/2 NTM
Fig. 2: Detection latency as function of the seed island width for 2/1 and 3/2 island location using line-of-sight ECE. The detection latency determined for three angles is shown, with the mean detection latency (solid line) and the upper and lower limits (dotted), determined from 15 runs with different noise realizations. For comparison, the maximum allowed latency for a control loop for full suppression of ITER NTMs using ECCD is depicted as a red dashed line.[4]
50 MHz apart, are combined in ECE channels and thermal noise is added based on the intermediate frequency and video bandwidths. A set of ECE spectra with varying island width and phase are combined with models for the evolution of the island width and rotation to arrive at time dependent ECE signals. The actual island location, indicated by the frequency of minimum temperature fluctuation in the noise-free spectra, should be accurately detected for NTM control. The algorithm by Berrinoet al is used for island detection.[8]
For both equatorial ECE and a line-of-sight ECE system, the required ECE channel layout to attain a detection accuracy of 5 mm and 7 mm for the 2/1 and 3/2 NTM is investigated, which is equal to the required deposition accuracy for full suppression.[4] A video bandwidth of 2 kHz is used which suffices for the detection of the 2/1 and 3/2 NTM based on a model for mode rotation by La Hayeet al.[9] The detection latency is determined for seeded islands, growing in accordance with the polarization model for the saturation of the bootstrap island growth at small island widths.
Using equatorial ECE, a sufficient detection accuracy for 3 cm islands is attained with a 400 MHz intermediate frequency bandwidth for both the 2/1 and 3/2 NTM. The channel spacing is taken equal to the intermediate frequency bandwidth. For small islands the tem-perature oscillation is near the noise level, while for larger islands ECE channels are located partially in the island, thereby decreasing the detected temperature oscillations. As a result, detection latency is lowest for 5 cm islands. Islands of 2 cm are not detectable with the chosen spacing as well. Use of a video bandwidth of 4 kHz no longer leads to detection of 3 cm islands. Island detection within 500 ms is possible for all seed island widths studied.
References
1. R. J. La Haye. Neoclassical tearing modes and their control. Physics of Plasmas, 13(5):055501, 2006.
2. O Sauter, M A Henderson, G Ramponi, H Zohm, and C Zucca. On the requirements to control neoclassical tearing modes in burning plasmas. Plasma Physics and Controlled Fusion, 52(2):025002, 2010.
3. R. Prater. Heating and current drive by electron cyclotron waves. Physics of Plasmas, 11(5):2349–2376, 2004.
4. H. van den Brand, M.R. de Baar, N.J. Lopes Cardozo, and E. Westerhof. Integrated modelling of island growth, stabilization and mode locking: consequences for NTM control on ITER. Accepted for publication in:Plasma Physics and Controlled Fusion.
5. A.R. Polevoi, S.Y. Medvedev, V.S. Mukhovatov, A.S. Kukushkin, Y. Murakami, M. Shi-mada, and A.A. Ivanov. ITER Confinement and Stability Modelling. Journal of Plasma and Fusion Research SERIES, 5:82–87, 2002.
6. M.E. Austin, P.E. Phillips, W.L. Rowan, J. beno, H-P. Liu, A. Ouroua, R.F. Ellis, R.W. Harvey, A.E. Hubbard, G. Taylor and D.W. Johnson. ITER ECE: Plans and Challenges. InEC-15 Joint workshop on ECE and ECRH, page P2.170, 2008.
7. W. A. Bongers, A. P. H. Goede, E. Westerhof, J. W. Oosterbeek, N. J. Doelman, F. C. Schuller, M. R. De Baar, W. Kasparek, W. Wubie, D. Wagner, J. Stober, and TEXTOR Team. Magnetic Island Localization for NTM Control by ECE viewed along the same Optical Path of the ECCD beam. Fusion Science and Technology, 55(2):188–203, FEB 2009.
8. J. Berrino, E. Lazzaro, S. Cirant, G. D’Antona, F. Gandini, E. Minardi, and G. Granucci. Electron cyclotron emission temperature fluctuations associated with magnetic islands and real-time identification and control system. Nuclear Fusion, 45(11):1350, 2005. 9. R.J. La Haye, R. Prater, R.J. Buttery, N. Hayashi, A. Isayama, M.E. Maraschek, L. Urso,
and H. Zohm. Cross-machine benchmarking for ITER of neoclassical tearing mode stabi-lization by electron cyclotron current drive. Nuclear Fusion, 46(4):451, 2006.
10. R.M.J. Sillen, M.A.F. Allaart, W.J. Goedheer and A. Kattenberg. NOTEC: A code to simulate Electron Cyclotron Emission spectra of plasmas which include non-thermal populations. Rijnhuizen Report 86-165, FOM-Instituut voor Plasmafysica, Nieuwegein, The Netherlands, 1987.
11. Jinhong Yang, Qingquan Yu, Sizheng Zhu, and G. Zhuang. Electron temperature dif-ference between the o-point and x-point of a magnetic island. Physics of Plasmas, 16(9):092308, 2009.
12. H J Hartfuss, T Geist, and M Hirsch. Heterodyne methods in millimetre wave plasma diagnostics with applications to ece, interferometry and reflectometry. Plasma Physics and Controlled Fusion, 39(11):1693, 1997.
13. R.J. La Haye, J.R. Ferron, D.A. Humphreys, T.C. Luce, C.C. Petty, R. Prater, E.J. Strait, and A.S. Welander. Requirements for alignment of electron cyclotron current drive for neoclassical tearing mode stabilization in iter. Nuclear Fusion, 48(5):054004, 2008. 14. E. Westerhof, E. Farshi, J.A. Hoekzema, W. Bongers, O.G. Kruijt, J.W. Oosterbeek and
J. Scholten. A generic method for controlled ECRH/ECCD localisation. InEC-13 Joint workshop on ECE and ECRH, page 357, Nizhny Novgorod, Russia, 2004.
15. B A Hennen, E Westerhof, P W J M Nuij, J W Oosterbeek, M R de Baar, W A Bongers, A Brger, D J Thoen, M Steinbuch, and the TEXTOR Team. Real-time control of tearing modes using a line-of-sight electron cyclotron emission diagnostic. Plasma Physics and Controlled Fusion, 52(10):104006, 2010.
16. G. Ramponi, D. Farina, M. A. Henderson, E. Poli, G. Saibene, and H. Zohm. ITER ECRH-ECCD system capabilities for extended physics applications. Fusion Science and Technology, 52(2):193–201, AUG 2007.