2
South Federal University, Institute of Radio Systems and Control, RU-347928, Taganrog, Rostov region, Russia
3Department Telecommunications and Information Processing, Ghent University, B-9000, Ghent, Belgium
Abstract. This article describes the relevance of developing methods and systems for detection photo-video violations of the Rules of the road. The proposed method includes several steps: 1) detecting of the three classes of objects on a video sequence (pedestrian crossing, a motor vehicle and a human on the pedestrian crossing; 2) tracking the trajectories of the vehicle and the human on the pedestrian crossing; 3) comparing the paths of the pedestrian and the vehicle and determining whether there has been a violation of the Rules of the road for a certain period of time. For real-time object detection, we used neural network YOLO V3.
1 Introduction
Today, the means of automatic recording of violations of the rules of the road are actively developed and implemented. They operate in almost all regions of the country. In 2018, almost 106 million judgments in cases of administrative offenses were issued in relation to vehicle owners on the basis of materials recorded by automatic photo and video recording complexes of traffic violations. That amounted to 82.7% of the total number of all decisions issued for the year. At the beginning of 2019, in the constituent entities of the Russian Federation, there are 10.8 thousand stationary and 3.9 thousand mobile complexes for automatically recording violations of traffic rules. Over the past year, the number of stationary complexes in the country increased by 20%, mobile - by 1%. The development of automatic photo and video systems for recording violations of traffic rules helps to prevent offenses in the field of road safety, significantly affects the discipline of drivers and makes a significant contribution to reducing the number of road traffic accidents, as well as the number of people killed and injured.Currently, more than 11.2 thousand foto and video detection systems reveal violations associated with speeding. But there are many other violations of the rules of the road, which cannot be recorded by the photo and video recording system of violations. Therefore, in this regard, the urgent task is the development of automated detection of traffic violation . This article proposes a method for automated detection of traffic violation , based on the detection and tracking of the
trajectories of objects using a convolutional neural network.
1.1 Analysis of traffic accident statistics
Looking at the statistics of road accidents in the Russian Federation over the past year, we can conclude that their number is huge, and many people die or get injured [2], as shown in Figure 1.
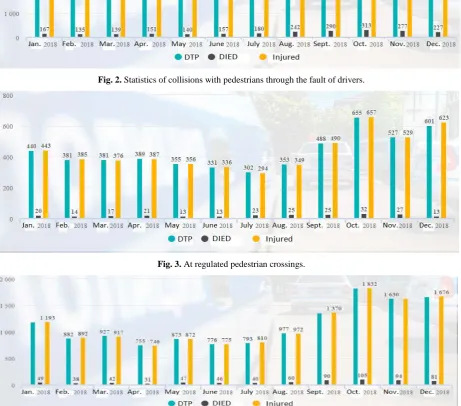
However, most traffic accidents occur because car drivers do not follow the rules of the road, as shown in Figure 2.
Of this total number of violations, a lot of violations are committed at the regulated pedestrian crossings (at which traffic lights are installed) is presented in Figure 3.
Three times more violations due to the fault of car drivers are committed at unregulated pedestrian crossings (at which no traffic lights are installed) compared to regulated as shown in Figure 4.
Fig. 1. Statistics of collisions with pedestrians.
Fig. 2. Statistics of collisions with pedestrians through the fault of drivers.
Fig. 3. At regulated pedestrian crossings.
RCNN, SSD, Yolo, etc.
When it comes to deep learning-based object detection, there are three primary object detectors you’ll encounter:
• R-CNN and their variants, including the original R-CNN, Fast R- CNN, and Faster R-CNN
• Single Shot Detector (SSDs)
• YOLO
R-CNN. We can say the first model to solve this problem. Works like a regular image classifier. Different regions of the image are fed to the network input and predictions are made for them. Very slow since it runs a single image several thousand times [3].
Fast R-CNN. An improved and faster version of R-CNN, works on a similar principle, but first the entire image is fed to CNN input, then regions are generated from the received internal representation. But still pretty slow for real-time tasks.
popular architecture at the moment, which is used to recognize multiple objects in an image.
The main feature of this architecture compared to others is that most systems apply CNN several times to different regions of the image; in YOLO, CNN is applied once to the entire image at once. The network divides the image into a kind of grid and predicts bounding boxes and the likelihood that there is a desired object for each section.
The advantages of this approach is that the network looks at the entire image at once. YOLO is also 1000 times faster than R-CNN and about 100x faster than Fast R-CNN.
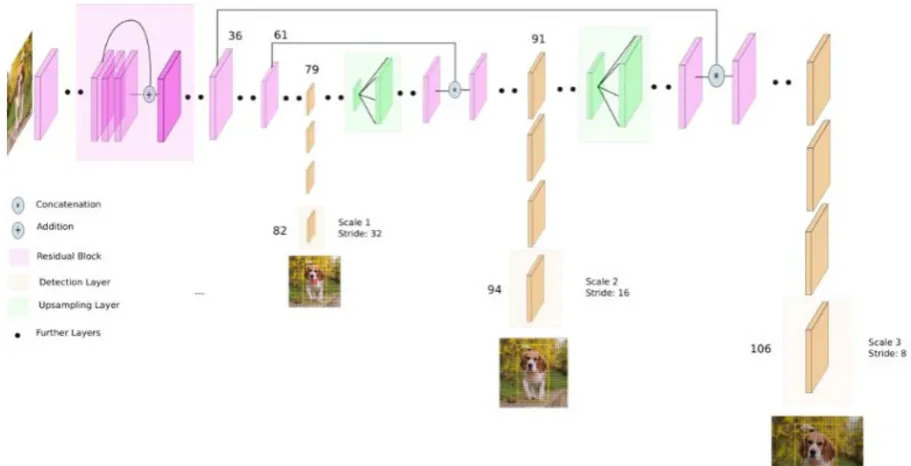
YOLOv3 is an improved version of the YOLO architecture. It consists of 106 convolutional layers and better detects small objects compared to its predecessor YOLOv2. The main feature of YOLOv3 is that there are three layers at the output, each of which is designed to detect objects of different sizes [7]. The figure 5 shows its schematic structure.
a) b)
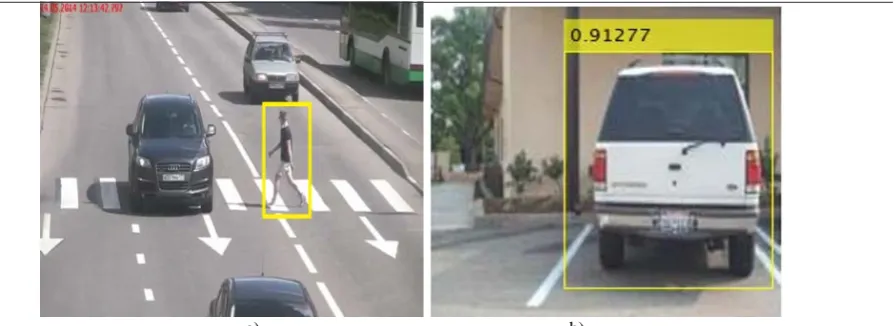
Fig. 6. Detection of objects of interest. a) car b) pedestrian
In this article, we will focus on detecting objects using the YOLO v3 neural network due to its excellent accuracy, an average of about 85%. And also this method stands out as the only one with the highest frame rate per second in live video. The results of detecting objects using this method are presented in Figure 6
How does YOLO v3 work? Bounding Box Prediction. System predicts bounding boxes using dimension clusters as anchor boxes. The network predicts 4 coordinates for each bounding box,
t
x ,y
t
,t
ω ,t
h . If the cell is offset from the top leftcorner of the image by (
c
x ,c
y ) and thebounding box prior has width and height
p
ω ,h
p
, then the predictions correspond to:x x
x
t
c
b
=
σ
(
)
+
(1)y y
y
t
c
b
=
σ
(
)
+
(2)ω
ω ω
p
e
tb
=
(3)h
t h h
p
e
b
=
(4) During training we use sum of squared error loss. If the ground truth for some coordinate prediction is∩ ∗
t
our gradient is the ground truth value (computed from the ground truth box) minus ourprediction: ∗
∩ ∗
−
t
t
. This ground truth valuecan be easily computed by inverting the equations above. YOLOv3 predicts an objectness score for each bounding box using logistic regression. This should be 1 if the bounding box prior overlaps a ground truth object by more than any other bounding box prior. If the bounding box prior is not the best but does overlap a ground truth object by more than some threshold we ignore the prediction, following.
Loss function. The objective function is a multi-part function as:
( )
(
)
(
)
∑
∑
∑
−
∑∑∑
= ∈ ∈ <= = = <
−
∗
+
−
∗
+
−
∗
+
−
∗
+
∗
=
c c c ijk c class o ijk k truth obj h w y x r r ijk r coord truth k h w y x r r ijk r k prior t W i H j noobj A k Thresh MaxIOU tb
truth
b
IOU
b
truth
b
prior
o
ijk
loss
b
1 2 2 2 ) , , , ( ) , , , ( 2 12800 0 0 0))
)
(
(
)
(
(
1
1
1
2l
l
l
l
l
(5)The above function defines the loss function for an iteration t. If a bounding box doesn’t have any object then its confidence of objectness need to be reduced and it is represented as first loss term. As the bounding boxes coordinates prediction need to align with our prior information, a loss term reducing the difference between prior and the predicted is added for few iterations (t < 12800). If a bounding box k is responsible for a truth box, then the predictions need to be aligned with the truth values which is represented as the third loss term. The
l
values are the pre-defined weightages for each of the loss terms.3 Pedestrian crossing detection.
Since the pedestrian crossing is static, unlike cars and people moving along the road. To detect a pedestrian crossing (or zebra), we use a segmentation method based on user marks [8].
Fig. 7. Stages of segmentation
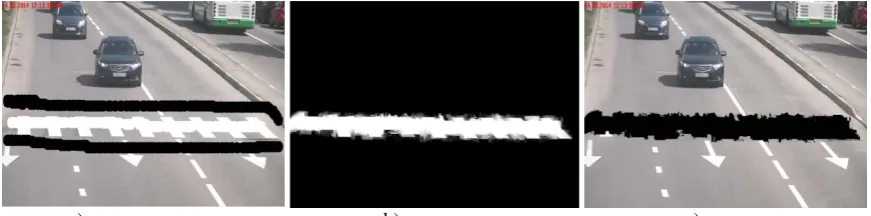
To do this, first select the object frame is marked with white background, the background is marked in black color the figure 8a, in the figure 8b an alpha the channel of the image received by means of a
segmentation method on the received tags at the first stage is presented. In the figure 8c show the selected object on the original frame of the video sequence.
a) b) c)
Fig. 8. Stages of segmentation of a zebra: a) marking of an object and background on the first shot, b) an alpha the channel of the image, c) the allocated object
After we have detected all the objects of interest to us in the video, we need to track the trajectories of their movement.
Several vehicle tracking methods have been illustrated and proposed by several researchers for different issues, it consists of:
1. Region-Based Tracking Methods 2. Contour Tracking Methods
3. 3D Model-Based Tracking Methods 4. Feature-Based Tracking Methods 5. Color and Pattern-Based Methods
In the future, we will find out which method is most suitable for our task.
4 Conditions for determining the
violation
In order to determine whether the driver should miss a pedestrian on the pedestrian crossing and if he should, to establish whether he did it or not, it is necessary to check a number of conditions. Whether there was an opportunity to brake at the driver when the pedestrian has approached to edge of a pedestrian crossing. In the textbooks [9, 10], safe speeds are considered according to the simplified scheme, depending on the distance УП, on which the pedestrian was from the traffic area of the vehicle for a given distance SУ, pedestrian speed VП and the level of limiting deceleration jТ. The pedestrian is conventionally taken as a point, and the dimensions of the vehicle are of length L and width B. The trajectories of the vehicle and pedestrian traffic intersect at an angle of 90 degrees. The diagram is presented below figure 10.
.
car by emergency braking to the point of arrival (pedestrian traffic line):
⋅ + − ⋅
= 2 / 2 1 1
1 T jT Sy T jT
V (6)
V3 speed at which the pedestrian has time to leave the lane of the car before approaching the latter:
(
Y B)
V S
V3 = y ⋅ Π / Π + . (7)
V4 speed at which the car manages to pass a pedestrian, applying emergency braking:
(
)
(
)
Π Π− ⋅
+ = ⋅
= V t T jT t t
V
n n y
2 / 2
2 3
4 (8)
The driver, having seen the pedestrian standing at the edge of the pedestrian crossing, is obliged to skip it and only then continue driving [10]. Also, by letting pedestrians from one side of the road, the driver should make sure that pedestrians do not go from the opposite side of the road and only then continue driving. Consider this schematically for a single-lane road. The car, moving on the right lane of traffic, approaching an unregulated pedestrian crossing, is obliged to pass the pedestrian standing at the edge of the pedestrian crossing figure 10.
Fig. 10. The layout of the pedestrian and the car on an unregulated pedestrian crossing
After the pedestrian passes from one lane marked by number 1 to another lane marked with number 2, the driver making sure that there are no pedestrians from
lane 2 on lane 1 can continue to move along lane 1 as shown in figure 11.
Fig. 11. The scheme of the location of the pedestrian and the car at the moment at the unregulated pedestrian crossing at the time
5 Conclusion
The article presents method of automated detection of traffic violation with a convolutional neural network. The proposed method includes several steps: 1) detecting of the three classes of objects on a video sequence (pedestrian crossing, a motor vehicle and a human on the pedestrian crossing; 2) tracking the trajectories of the vehicle and the human on the pedestrian crossing; 3) comparing the paths of the pedestrian and the vehicle and determining whether there has been a violation of the Rules of the road for a certain period of time. To detect objects in real-time (pedestrians and cars), the YOLO V3 neural network is used. To detect a pedestrian crossing, we use a segmentation method based on user marks. The
operation of the presented method is shown in the figures. In the future, it is necessary to verify the effectiveness of the presented method in real conditions.
Acknowledgment. This work was supported by Russian Ministry of Education and Science in accordance to the Government Decree № 218 from April 9, 2010 (project number № 074-11-2018-013 from May 31, 2018 (03.G25.31.0284)).
References
1. Ministry of internal affairs Russian
Federation.mvd.ru (2019)