International Journal of Research in
628
EEG based Emotion Classification using Nonlinear
Features
Leena Bhole1, Maya Ingle2,
School of Computer Science and Information Technology DAVV Indore1 School of Computer Science and Information Technology DAVV Indore,2
Abstract- EEG based emotion recognition is widely used in several areas such as neuroscience, physiology, psychology, cognitive behavior etc. In this paper, we aim to provide innovative system architecture for recognizing human emotions using EEG signals. Using nonlinear features DFA and Hurst of EEG signals, we attempt to analyze the performance of different classifiers for emotion recognition. Four performance parameters accuracy, sensitivity, specificity, and precision are utilized to measure the effect of three classification techniques SVM, k-NN, and bagged trees. As a result SVM classifier shows the effective outcome for classifying emotion using nonlinear features DFA and Hurst.
Index Terms- Detrended Fluctuation Analysis (DFA), Hurst exponent, sensitivity, specificity, precision.
1. INTRODUCTION
Electroencephalogram (EEG) signal analysis has gained enormous significance in the field of Human Computer Interaction (HCI) and Affective Computing (AC) domain. EEG signals are highly complex as well as random in nature and are explored in time and frequency domain. In recent years, many researchers witnessed growing use of linear approaches such as Fast Fourier Transform (FFT), wavelet transform, autoregressive modeling etc. in aforesaid domains. An approach using Linear Dynamics System (LDS) aims to extract EEG features based on FFT and to discriminate emotions using Support Vector Machine (SVM) attaining 81.03% accuracy [1, 3]. However, the neuronal systems exhibit assorted nonlinear behaviors. EEG signal is formed by large number of neurons and their interactions are generally nonlinear. These nonlinear interactions produce fluctuations which are unable to articulate by linear decomposition. In this context, nonlinear feature entropy helps SVM to detect emotions achieving 79.58% and 82.22% success rate for arousal and valence respectively [2]. Further, nonlinear features Correlation Dimension (CD) and Fraction Dimension (FD) are used to categorize emotions according to dimensional model in time domain with 85% precision rate using Dempster-Shafer theory [4]. However, aforesaid nonlinear features are very sensitive to noise and require stationary conditions; while EEG signals are highly non-stationary. Hence, there is need to explore EEG signals using robust non-stationary and long range correlation properties for emotion recognition. The potential advancements in EEG signal analysis using growing technology empower exploration of EEG signals in various domains. In this work, we propose system architecture Nonlinear Feature based Emotion Recognition (NFER) using self similarity and correlation properties of EEG signals for recognizing emotions in time domain. In Section 2, systematic description of aforementioned architecture
along with its theoretical aspects is described. Here, we present an algorithm ExtractDFA for extracting scaling exponent of Detrended Fluctuation Analysis (DFA) of EEG signal. Section 3 deals with an experimental study including specification of experimental setup and execution. The performance parameters such as accuracy, sensitivity, specificity, and precision contribute to analyze the efficiency of classifiers are elaborated. The performance of classification techniques is compared using aforesaid performance parameters using experimental results in Section 4. The comparison reveals the effectiveness of classification techniques for emotion recognition. Finally, we conclude with conclusion in Section 5.
2. NONLINEAR FEATURES BASED EMOTION RECOGNITION SYSTEM ARCHITECUTRE
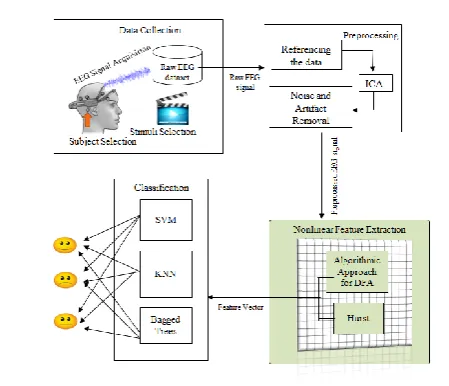
We propose Nonlinear Feature based Emotion Recognition (NFER) system architecture design for recognizing emotional brain activity using EEG.
NFER architecture is based on nonlinear features DFA and Hurst exponent of EEG signals. There exist four components namely; data collection, preprocessing, nonlinear feature extraction, and classification in
NFER architecture as shown in Fig. 1 and are described in brief as follows:
2.1. Data Collection
E-ISSN: 2321-9637
Available online at www.ijrat.org
International Journal of Research in
629 context, International Affective Picture System (IAPS)
database and International Affective Digitized Sound database (IADS) standardize the experimental framework for research in emotions in the form of stimuli [6, 7].The actual EEG signals are acquired in EEG signal/ data acquisition against specific region of the brain using rigorous EEG signal acquisition device to form the raw EEG dataset.
Fig. 1: Nonlinear Features based Emotion Recognition System Architecture
2.2. Preprocessing
The raw EEG signals are contaminated with noise as well as artifacts and require preprocessing to reconstruct them into the normalized form. There exist two techniques such as common reference and average reference for deciding the reference channels. Several preprocessing techniques such as Butterworth filter, Notch filter, Adaptive filters, and FIR filters preprocess EEG signal and remove noise and artifacts. Also, Independent Component Analysis (ICA) method effectively contributes in extracting noise free components of EEG signals and convert raw EEG signal into preprocessed signal.
2.3. Nonlinear Feature Extraction
Nonlinear feature extraction pretends a central role in pulling out significant features from preprocessed/ noise free EEG signals for further analysis. Here, we intend to extract two nonlinear features namely; DFA and Hurst in time domain against preprocessed EEG signal for emotion recognition. In this work, we emphasize on our proposed algorithmic approach in nonlinear feature extraction as shown with highlighted portion in NFER architecture.
2.3.1.Detrended Fluctuation Analysis (DFA)
DFA represents a customized version of root mean square analysis of a random walk and is applied to non-stationary time series data. It reveals the long
range power-law correlations in non-stationary EEG signals and used as scaling exponent to compute correlation properties of EEG signals. The scaling exponent provides a quantitative measure of long range temporal correlation of the EEG signal and shows the nature of fluctuations in it [9, 10]. We present ExtractDFA algorithm to compute scaling exponent of nonlinear feature DFA using preprocessed EEG signal for emotion recognition. The algorithm is based on nonlinear feature detrended fluctuation analysis used for analyzing the pattern of fluctuation in EEG signal in time domain. We present informal description followed by formal description of
ExtractDFA algorithm as follows:
Informal Description of ExtractDFA Algorithm:
In ExtractDFA algorithm, x(n) represents the input EEG signal; n =1, 2, …, N where N is the length of x(n); y(k) denotes integrated EEG signal of x(n) for time interval k; s1 stands for non overlapping slot of y(k) divided in equal length l; samp_rate specifies the sampling rate of EEG signal capturing device. The least_fit() function computes the local trend yl(k) for integrated signal y(k) using least square fitting method. The series D(k) depicts detrended time series obtained by subtracting local trend yl(k) from integrated time series y(k). The variables M, C indicate number of emotions and number of channels respectively. The two dimensional matrix S[j,i] stores scaling exponent of detrended time series for ith channel and jth emotion. The function sum() returns the cumulative sum of x(n) whereas int() extracts integral part as slots obtained using division of n and l. The two mathematical functions sqr() and sqrt() determine square and square root of passed arguments respectively.
Formal Description of ExtractDFA Algorithm:
//* Algorithm: ExtractDFA *//
//* Input: EEG signal x(n), length of EEG signal N, samp_rate, length of slot l, M emotions, and C as number of channels*//
//* Output: matrix S of size M*C representing scaling exponent of detrended time series *//
begin {Main}
Step I: //* Convert input EEG signal x(n) with length N into integrated time series *//
sum1:=0 for i:=1 to N begin
sum1:=sum1+x(i) end
z:=sum1/N //* Compute mean of x(n) *// n:=samp_rate
N:=N/samp_rate sum1:=0 for k := 1 to N begin
International Journal of Research in
Step III: //* Compute scaling exponent DFA of detrended time series *//
Thus, feature vector FVD for DFA is defined using
ExtractDFA algorithm on preprocessed EEG signals as:
Emotions being transient to momentary variations in brain signals may be evaluated using degree of self-similarity and correlation properties of the EEG signal using nonlinear Hurst feature. Hurst exponent relates to presence or absence of long-range
dependence and its degree in the EEG signal. It incorporates local trends in EEG signals which measure the smoothness of a fractal EEG signal using the asymptotic behavior of the rescaled range and is defined as
⁄
where T is the duration of EEG signal, R represents the difference between maximum and minimum deviation of EEG signal whereas S is standard
Classification component is responsible for identifying the emotion class where new EEG signal resides. Here, independent nonlinear features DFA and Hurst of EEG signals are the key inputs for predicting the equivalent emotion class for EEG signal. A trained classifier forms the association between predefined emotion classes and corresponding EEG features and categorizes new EEG instances in an unseen testing dataset. The classification component of NFER
architecture consists of three classifiers namely; Support Vector Machine (SVM), k-Nearest Neighbor (k-NN) and bagged tree for discriminating emotions in frontal, parietal, temporal and combined regions of brain using EEG signals.
Support Vector Machine is an efficient supervised machine learning algorithm for solving classification problems that are not linearly separable. The basic idea in SVM is estimating a hyperplane to categorize EEG features from the predefined emotional classes in the most optimal way. The hyperplane is linear and there are several solutions to discriminate EEG data. SVM uses kernel function which projects data into high dimensional space to find the optimum solution [13]. Kernel function is defined using polynomial function as
( ) … (3) where, FVN and FVp represent extracted feature vectors, p is kernel function parameter. SVM works on two approaches One-vs-One (OvO) and One-vs-All (OvA) to deal with the multiclass classification problems.
k-NN classifier depends on the emotional class labels of closest training patterns in the feature space where the nearest neighbors of a given feature vector are defined in terms of the standard Euclidean distance. k-NN works on the assumption that all instances of feature vectors correspond to points in the
E-ISSN: 2321-9637
Available online at www.ijrat.org
International Journal of Research in
631 assigned to the emotion class which is the most
common among its k nearest neighbors. The best
choice of k depends upon the nature of the data to be classified [12].
Bagging is an ensemble method for classifying the data based on bootstrap aggregation. In bagged of classification against the input feature vectors for emotion recognition.
3. EXPERIMENTAL STUDY
In this section, we discuss the hardware and software requirements necessary for enactment of
NFER architecture. Here, some realization issues along with four performance parameters used for analyzing performance of various EEG classification techniques are discussed in detail.
Experimental Setup and Execution
The raw EEG data required for NFER
architecture is captured using EMOTIV EPOC 14 channel device. The device uses sequential sampling method with sampling rate 128 samples per second and 16 bit analog to digital converter. The electrodes positioning in EMOTIV is configured according to International 10-20 system [8]. The system supporting
NFER architecture is realized on a laptop (Intel(R) core (TM) i5-4210U @1.75 GHz) and on MATLAB 2016A software package with Window XP.
The raw EEG signals are acquired for Happy,
Sad, and Fear emotions from 16 healthy subjects (8 male, 8 female) between the age group of 19-20 years. The emotional movie clips in subject’s regional language are utilized as stimuli for emotion evocation. Each movie clip is followed by a blank screen for 5 seconds for preparing subject to toggle between emotions. The EEG signals are acquired in .edf format for the duration of 300 seconds and are stored in raw EEG dataset. In preprocessing, raw EEG signals are filtered out using band pass filters in order to retain the frequencies between 0-50Hz. Components are separated using ICA for removing the artifacts occurred due to eye blinks and eye movement. P3 and P4 electrodes are set as reference electrodes based on the average reference technique. Numerical format (.mat) for filtered EEG signal is generated in preprocessing component using EEGLAB.
In nonlinear feature extraction, two scaling exponents DFA and Hurst are extracted for examining the correlation properties and self similarity of EEG signal respectively for emotion recognition.
ExtractDFA algorithm is implemented for estimating the scaling exponent of DFA using preprocessed EEG signal. Feature vectors FVD and FVH are constructed for DFA and Hurst respectively for all 14 channels, 16 subjects and three emotions each of size [14*16*3] using Eq. (1) and Eq. (2). The average values of DFA and Hurst feature vectors of all 16 subjects for 14 channels are depicted in Table 1. Thus, the training dataset is formed based on estimated values of DFA and Hurst features of all 16 subjects and 3 emotions. Emotions are discriminated against four brain regions namely; frontal, temporal, parietal, and combined region. For an extensive evaluation of DFA and Hurst features, three classifiers SVM, k-NN and bagged trees are utilized. Among several approaches to apply a multiclass classification process, One-vs-One (OvO) SVM method is adopted, hence three SVM classifiers are built for recognizing three emotions. SVM kernel function parameter is set to 5 in Eq. (3) for both FVD and FVH. In case of k-NN, k is set to 3, i.e 3-NN classifier is build for recognizing three emotions. Multiple decision trees are formed based on the 48 samples (16 for each emotion) in each feature vector using bagged tree classifiers among which the ptimum decision tree is selected. The confusion matrix generated by all three classifiers in each region is shown in Table 2. In all cases70% data is used as training set and 30% data is used as testing set.
Table 1 Estimated Value of DFA and Hurst for Emotions
Channels Happy Fear Sad
Table 2 Confusion Matrix of Classifiers in Each Region for Each Emotion
Hurst Exponent
Region Emotion SVM k-NN Bagged Trees
Fear Happy Sad Fear Happy Sad Fear Happy Sad
International Journal of Research in
632
Happy 0 13 3 10 6 0 0 11 5
Sad 0 6 10 0 4 12 0 6 10
Parietal
Fear 14 1 1 12 1 3 16 0 0
Happy 0 11 5 0 8 8 0 12 4
Sad 0 7 9 0 3 13 0 7 9
Temporal
Fear 15 0 1 15 1 0 15 0 1
Happy 0 12 4 0 10 6 0 9 7
Sad 0 4 12 0 4 12 0 5 11
Combined Region
Fear 16 0 0 15 0 1 16 0 0
Happy 0 14 2 0 13 3 0 13 3
Sad 0 3 13 0 2 14 0 3 13
DFA
Frontal
Fear 10 1 5 11 1 4 8 1 7
Happy 2 13 1 5 7 4 0 13 3
Sad 3 1 12 2 0 14 6 1 9
Parietal
Fear 12 0 4 12 0 4 10 1 5
Happy 4 8 4 4 8 4 5 7 4
Sad 4 0 12 6 1 9 5 2 9
Temporal
Fear 6 3 7 9 3 4 6 3 7
Happy 4 8 4 6 5 5 3 7 6
Sad 3 3 10 7 5 4 7 6 3
Combined Region
Fear 13 0 3 13 0 4 13 0 3
Happy 0 15 1 1 4 11 0 13 3
Sad 5 0 11 3 0 13 6 0 10
Performance Parameters
The performance of EEG classification techniques considerably depends on the accuracy of the classifier. However, apart from accuracy some performance measures help to quantify the performance of classifiers. We use four performance measures namely; accuracy, sensitivity, specificity, and precision which are recognized as effective measure to test the efficiency of classifiers for specific applications. These parameters provide effective measure to analyze the amount of discontinuity/ incoherence that exists in different classification techniques of EEG signal. Accuracy (ACC) represents the fraction of number of all accurate predictions to the total number of the samples in the dataset and is defined as
where True Positive (TP), True Negative (TN), False Positive (FP), and False Negative (FN) specifies accurate positive prediction, accurate negative prediction, inaccurate positive prediction and inaccurate negative prediction respectively and are computed using confusion matrix of classifiers. Sensitivity (SEN) exemplifies the ability of classifier
for accurately classifying proportion of true positive samples and is stated as
Specificity (SPC) determines the ratio of number of accurate negative predictions to the total number of negatives whereas precision (PRE) yields the proportion of identified positive samples which are true positive [13] and are defined as
E-ISSN: 2321-9637
Available online at www.ijrat.org
International Journal of Research in
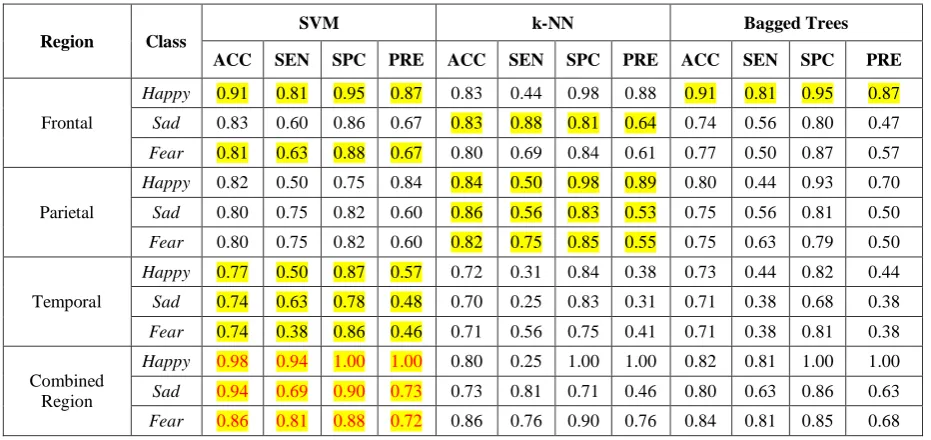
633 Table 4 Performance Analysis of Hurst for Emotion Classification
Region Class SVM k-NN Bagged Trees
ACC SEN SPC PRE ACC SEN SPC PRE ACC SEN SPC PRE
Frontal
Happy 0.84 0.81 0.85 0.68 0.77 0.38 0.81 0.60 0.81 0.69 0.86 0.65
Sad 0.85 0.63 0.93 0.77 0.91 0.75 1.00 1.00 0.81 0.63 0.88 0.67
Fear 1.00 1.00 1.00 1.00 1.00 1.00 1.00 1.00 1.00 1.00 1.00 1.00
Parietal
Happy 0.79 0.69 0.82 0.58 0.80 0.50 0.91 0.67 0.81 0.75 0.84 0.63
Sad 0.80 0.56 0.89 0.64 0.77 0.81 0.76 0.54 0.81 0.56 0.91 0.69
Fear 0.96 0.88 1.00 1.00 0.92 0.75 1.00 1.00 1.00 1.00 0.91 1.00
Temporal
Happy 0.86 0.75 0.90 0.75 0.81 0.63 0.88 0.67 0.80 0.56 0.89 0.64
Sad 0.84 0.75 0.71 0.71 0.83 0.75 0.86 0.67 0.79 0.69 0.82 0.58
Fear 0.98 0.94 1.00 1.00 0.98 1.00 1.00 1.00 0.98 0.94 1.00 1.00
Combined Region
Happy 0.91 0.88 0.92 0.82 0.98 0.81 0.95 0.87 0.82 0.81 0.92 0.81
Sad 0.91 0.81 0.95 0.87 0.89 0.88 0.89 0.79 0.81 0.81 0.92 0.81
Fear 1.00 1.00 1.00 1.00 0.98 0.94 1.00 1.00 1.00 1.00 1.00 1.00
4. EXPERIMENTAL RESULTS
The EEG signal classification based on NFER
architecture is carried out against four different regions of the brain using SVM, k-NN, and bagged tree classifiers. The performance of these classifiers considerably depends on EEG signal contents as well as features extracted. Four performance measures namely; ACC, SEN, SPC, and PRE are applied for evaluating the effectiveness of classifiers depending on kind of emotion evoked. Numerous results are analyzed into four cases according to four regions of brain as frontal, parietal, temporal and combined regions for both features as deliberated in Table 3 and Table 4 for DFA and Hurst respectively. The
observations drawn from these regions are discussed as follows:
Case I: Frontal Region
The electrode pairs F3, F4 and F7, F8 are responsible for tracking frontal region brain activity. In this region, SVM and bagged tree classifiers demonstrate the highest ACC, SEN, SPC, and PRE values as 0.91, 0.81, 0.95, and 0.87 respectively for
Happy emotion. The maximum values are gained as 0.83, 0.88, 0.86, 0.67 and 0.81, 0.63, 0.88, 0.67 respectively for Sad and Fear emotions using SVM. Thus, it is evident that SVM performs the best for classifying emotions reflected in frontal region whereas k-NN shows the worst performance for DFA. In case of Hurst exponent, all three classifiers show Table 3 Performance Analysis of DFA for Emotion Classification
Region Class
SVM k-NN Bagged Trees
ACC SEN SPC PRE ACC SEN SPC PRE ACC SEN SPC PRE
Frontal
Happy 0.91 0.81 0.95 0.87 0.83 0.44 0.98 0.88 0.91 0.81 0.95 0.87
Sad 0.83 0.60 0.86 0.67 0.83 0.88 0.81 0.64 0.74 0.56 0.80 0.47
Fear 0.81 0.63 0.88 0.67 0.80 0.69 0.84 0.61 0.77 0.50 0.87 0.57
Parietal
Happy 0.82 0.50 0.75 0.84 0.84 0.50 0.98 0.89 0.80 0.44 0.93 0.70
Sad 0.80 0.75 0.82 0.60 0.86 0.56 0.83 0.53 0.75 0.56 0.81 0.50
Fear 0.80 0.75 0.82 0.60 0.82 0.75 0.85 0.55 0.75 0.63 0.79 0.50
Temporal
Happy 0.77 0.50 0.87 0.57 0.72 0.31 0.84 0.38 0.73 0.44 0.82 0.44
Sad 0.74 0.63 0.78 0.48 0.70 0.25 0.83 0.31 0.71 0.38 0.68 0.38
Fear 0.74 0.38 0.86 0.46 0.71 0.56 0.75 0.41 0.71 0.38 0.81 0.38
Combined Region
Happy 0.98 0.94 1.00 1.00 0.80 0.25 1.00 1.00 0.82 0.81 1.00 1.00
Sad 0.94 0.69 0.90 0.73 0.73 0.81 0.71 0.46 0.80 0.63 0.86 0.63
International Journal of Research in
634 the best values as 1.0 for all measures in Fear
emotion. In case of Sad emotion, k-NN performs better with 0.91, 0.75 for ACC and SEN values respectively whereas 1.0 for SPC and PRE. Moreover, bagged tree outperforms with 0.81, 0.69, 0.86 and 0.65 values for ACC, SEN, SPC and PRE respectively for
Happy emotion. All three classifiers contribute in classifying frontal region emotional activity using Hurst.
Case II: Parietal Region
Under this scenario, electrode pair P7 and P8 exhibits the parietal region ongoing brain activity. Here, for DFA feature, k-NN performs the best with the highest value as 0.84, 0.50, 0.98 and 0.89 for ACC, SEN, SPC and PRE respectively for Happy
emotion whereas 0.86, 0.53, 0.83 and 0.53 respectively for Sad emotion. The same observation is true for Fear emotion with the maximum values as 0.82, 0.75, 0.85 and 0.55 respectively. For Hurst exponent, bagged tree shows the best classification with the highest ACC, SEN, SPC and PRE values as for recognizing emotional activity in parietal region using DFA.
Case III: Temporal Region
The EEG electrode pair T7 and T8 is responsible for tracking temporal region emotional activity. In temporal region, SVM proves better 0.86, 0.75, 0.90, 0.75 for Happy emotion respectively using SVM in case of Hurst exponent. Thus, it is noticed that, SVM performs the best for classifying temporal region emotional activity for both DFA and Hurst.
Case IV: Combined Region
In this case, all aforementioned electrode pairs are combined to examine the overall emotional brain activity. SVM classifier reports the maximum ACC, SEN, SPC, and PRE values as 0.98, 0.94, 1.0, and 1.0 for Happy, 0.94, 0.69, 0.90, and 0.73 for Sad, and 0.86, 0.81, 0.88 and 0.72 for Fear emotion respectively using DFA. In case of Hurst exponent SVM performs the best with 0.91, 0.88, 0.92, and 0.82 respectively for ACC, SEN, SPC, and PRE values for
Happy emotion, 0.91, 0.81, 0.95, and 0.87 respectively for Sad emotion. All four measures show the best value as 1.0 for Fear emotion. The presented results have shown the ability of NFER to better discriminate
the emotional brain activity spread in entire region of the brain.
5. CONCLUSION
We have presented innovative system architecture namely NFER using nonlinear feature DFA and Hurst for EEG based emotion recognition. In particular, an algorithmic approach for DFA feature extraction has been proposed. Moreover, the performance of computed features has been evaluated against SVM, k-NN and bagged tree classifiers in four different regions of the brain using performance parameters. SVM classifier reports the best results for emotional classification in all regions of brain for both DFA and Hurst features. Further, we have observed that emotional activity of brain is spread all over the entire region of the brain. The presented architecture will provide a new way using nonlinear features for solving the EEG based multiclass emotion recognition problems.
REFERENCES
[1] Duan R. N., Wang X. W. and Lu B. L., “EEG-based Emotion Recognition in Listening Music by using Support Vector Machine and Linear Dynamic System”, International Conference on Neural Information Processing, pp. 468-475. Springer, Berlin, Heidelberg, 2012.
[2] Tong J., Yufeng k., Bin G., Feng H., Baikun W., Dong M., “EEG based Emotion Recognition using Nonlinear Feature”, IEEE International Conference on Awareness Science and Technology, pp. 55-59, 2017, DOI: 10.1109/ICAwST.2017.8256518.
[3] Lehnertz K., Andrzejak R. G., Arnhold J., Widman G., Burr W., David P. and Elger C. E.,“Possible Clinical And Research Applications of Nonlinear EEG Analysis In Humans”, Journal ofChaos in brain, pp. 134-155, 2000.
[4] Soroush M. Z., Maghooli K., Setarehdan S. K. and Nasrabadi A. M., “A Novel Method of EEG based Emotion Recognition using Nonlinear Features Variability and Dempster–Shafer Theory”, Biomedical Engineering: Applications, Basis and Communications, vol. 30 no. 04, pp.1850026, 2018.
[5] Lee J. M., Kim D. J., Kim I. Y., Park K. S. and Kim S. I., “Detrended Fluctuation Analysis of EEG in Sleep Apnea using MIT/ BIH Polysomnography Data”, Computers in Biology and Medicine, vol. 32, no. 01, pp.37-47, 2002. [6] Bradley M., Lang P., “The International Affective
E-ISSN: 2321-9637
Available online at www.ijrat.org
International Journal of Research in
635 Sounds and Instruction Manual: Technical Report
A-8”, University of Florida, 2007.
[7] Lang P. J., Bradley M.M., and Cuthbert B. N., “International Affective Picture System (IAPS) : Technical manual and affective ratings”, NIMH Center for the Study of Emotion and Attention, Gainesville, FL, 1997.
[8] Jasper, H. H., “The Ten Twenty Electrode System of the International Federation”. Electroencephalography and Clinical Neurophsiology, vol. 10: pp. 371-375, 1958.
[9] Lee J., Yang B., Choi J., Choi I., and Kim S., "Detrended Fluctuation Analysis of Resting EEG in Depressed Outpatients and Healthy Controls," Clinical Neurophysiology vol. 118. no. 11 pp. 2489-2496, 2007.
[10]Márton L. F., Brassai S. T., Bakó L. and Losonczi, L., “Detrended Fluctuation Analysis of EEG Signals. Procedia Technology, vol. 12, pp.125-132, 2014.
[11] Costa T, Galati D, Rognoni E., “The Hurst Exponent of Cardiac Response to Positive and Negative Emotional Film Stimuli using Wavelet”.
Auton Neuroscience, vol. 151 pp. 183–185, 2009. [12] Hall P., Park B.U., Samworth R. J. "Choice of
Neighbor Order in Nearest-Neighbor Classification", Annals of Statistics. Vol. 36 no. 5, pp. 2135–2152, 2008. doi:10.1214/07-AOS537. [13] Soroush M., Maghooli K., Setarehdan S.,