Microstructure Based Failure Criterion For Ductile Materials
SaryuFensin1,∗,GeorgeGray III1,NeilBourne2, andRobertHixson1
1Materials Science and Technology Division, Los Alamos National Laboratory, Los Alamos, USA 87544 2University of Manchester, Rutherford Appleton Laboratory, Didcot, Oxfordshire, OX11 0DE, United Kingdom
Abstract.For ductile metals, the process of dynamic fracture occurs through nucleation, growth and coales-cence of voids. The stress required to nucleate these voids is inferred from the velocimetry data (using the acoustic approach) and termed as the spall strength. This is a key parameter that is used to evaluate a mate-rial’s susceptibility to damage and failure. However, it is also well recognized that the dynamic parameters used to generate the shock state such as pulse duration, tensile strain-rate and peak stress coupled with mate-rial microstructure itself affect the material response in a complex manner. Yet, it is impossible to capture all
this information by assessing only the spall strength measured from simple one-dimensional Photon Doppler Velocimetry measurements. Although, there exist widely used corrections proposed by Kanel et. al. that al-low for the inclusion of some of these complexities into the measured spall strength but still does not take the microstructure into account. In this work, we propose another scheme for normalization of spall strength with a damage area to capture the complexities included in the damage and failure process especially pertaining to microstructure. We will also demonstrate the application of this scheme by applying to examples of materials such as Copper, Copper-24 wt%Ag, Copper-15 wt% Nb and additively manufactured 316L SS.
1 Introduction
Multiple notions of strength may be applied to a given ma-terial depending on the loading conditions. A few related to uniaxial loading include yield and ultimate strengths. Under dynamic loading conditions, one type of strength related to material failure is frequently termed “spall or dynamic tensile strength". The tensile dynamic strength is one of the key properties that is used to assess the materi-als resistance to damage nucleation under high strain rates [1]. The simplest way to generate dynamic loading con-ditions in a material involves high velocity impact with a flyer. This gives rise to a compression or shock wave, of a given amplitude, in the material and the flyer. These shock waves then get reflected from the free surfaces in both the flyer and the material. The generated release waves travel through the flyer and material until they intersect at a pre-determined location. The material is then driven into ten-sion in the specific region of intersection leading to the creation of damage in the form of voids in ductile mate-rials, which grow and coalesce finally leading to failure under sufficiently large tension. Parameters such as the peak stress, pulse duration, pulse shape, tensile strain-rate associated with the shock wave can all be controlled to some extent by altering either the flyer thickness and ma-terial or using high explosives or lasers to generate shock in the material [2, 3]. These loading parameters have a pro-found effect on the type and amount of damage generated in the material. In general, these loading parameters have complex interactions with the microstructure of a material
∗e-mail: [email protected]
especially if they have elastic-plastic behavior. For exam-ple, for a given microstructure altering the pulse duration of the shock wave will not only alter the total deformation in the material under compression but this will also alter the dynamic strength of the material [4, 5]. This change is tied to the fact that deformation in the form of dislo-cations is an important stress dissipation mechanism[6]. These types of affects cannot be simply accounted for by measuring only the spall strength of the material. The to-tal deformation in the material not only affects the nucle-ation stress for voids but will also alter the growth and co-alescence of these voids. Spall strength will only provide information regarding the stress required to open enough “free surfaces” within the sample such that the stress wave gets trapped between the spall scab and the free surface causing a change in the velocity time history being mea-sured on the surface but no information regarding the total damage in the material [1]. Hence, to capture the effect of microstructure on the total damage in the material, for the purpose of developing microstructurally-aware predic-tive models for spallation, it is indispensable to include quantification of both the damage mechanism as well as the kinetics and volume within the sample over which ap-plied energy is dissipated via evolved damage in addition to spall strength.
Experiments to probe the dynamic strength of materi-als generally measure spall strength from the free surface velocity history (uf s(t)) via photonics doppler
these measurements associated with the transmission of information from the bulk to the free surface due to the elastic-plastic nature of most ductile materials. Multiple ways of accounting for errors in these measurements have been discussed by Kanel et. al.[1] in the form of correc-tions that are made to the measured spall strength. In gen-eral, spall strength is calculated by the simple relationship [7]:
σsp=1
2ρoco∆uf s, (1) whereρo is the ambient density, Co is the bulk sound
velocity and∆uf s is the difference in the free surface
ve-locity from the peak state to the pull-back minima. This assumes linear compression of the material along with a constant sound speed. However, these assumptions fail in the limit of large spall strength values and other cor-rections need to made. The most applied corcor-rections are the ones by Romanchenko et. al [8] and Kanel et. al [9] that attempt to take into account not the elastic-plastic na-ture of ductile materials but account for the interaction be-tween the elastic and plastic compression waves. How-ever, all these corrections are based on the transmission of acoustic waves within the sample and do not take any mi-crostructural information into account. This information is important because previous work has shown that voids nucleate preferentially at pre-existing flaws like disloca-tions, grain boundaries, and inclusions in a given material [2, 3, 10–15]. But in addition to nucleation it has been shown the microstructure affects void growth and coales-cence, which together comprise the total damage in the material [4, 16, 17]. Hence, just using the spall strength to make conclusions regarding the resistance of a material to damage misses the complete picture.
In this work, we propose to couple spall strength with the area or volume fraction of damage to indirectly include microstructural effects in this important failure criterion. The rest of the paper is organized as follows. The next section discusses the details and the rationale behind the proposed failure criterion and experimental details associ-ated with the examples used to demonstrate the robustness of this criterion. Section 3 applies the criterion to a few problems within the material science community and we conclude in Section 4.
2 Methodology
This section outlines the proposed microstructure based failure criterion along with the experimental details asso-ciated with the examples discussed in the results section.
2.1 New Failure Criterion
The “spallation response” of a material can be quantified by both: 1) the measurement of the energy necessary to cause incipient or full spall scab formation as quantified via rear-surface PDV or VISAR wave profile “pull-back” signals, and 2) post-mortem analysis of the damage evolu-tion in the sample following spall loading.
The importance of coupling the in-situ wave-profile signal with the damage evolution is to both assess the op-erative damage processes (such as ductile void formation, shear localization, brittle cracking, intergranular fracture) as well as the volume of the sample over which damage manifests. The development of microstructurally-aware predictive models for spallation is predicated on quantifi-cation of both the damage mechanism as well as the kinet-ics and volume within the sample over which this energy is dissipated.
Analogous to quantification of the “ductility” and damage evolution in a quasi-static tensile test is the im-portance of not only measuring the tensile strength (akin to measuring the spall strength) but also quantifying the “ductility” of the material. For the latter two measure-ments are done; the percent elongation - the ratio of the increase in length of the gage section of the sample to its original length, versus the second; the reduction in area defined as the percentage reduction of area of the decrease in the cross-sectional area of the tensile specimen. A high reduction of area indicates the ability of the metal to de-form extensively without fracture or failure. Accordingly, the reduction of area is the most structure sensitive param-eter that is measured in a tensile test. It is also the the most important aspect used to assess material strength and qual-ity. A decrease in reduction in area from a specified level will act as a warning sign that the quality of the material is substandard. One material might display a large elon-gation yet fail in a brittle manner versus another material may exhibit limited tensile ductility yet locally neck to a point, i.e., a reduction in area of nearly 100% [18].
Transferring these two concepts to that of post-mortem spallation analysis can be fruitful. One can postulate two materials that exhibit similar or nearly identical spall pull-back signals but very different damage behavior. One of the materials displays a narrow region of evolved dam-age leading to a fully separated spall scab versus the other material displays a broad region of nucleated and evolved damage only resulting in incipient damage evolved. Mod-eling of these two different materials would require rad-ically different physics in the kinetics of spall nucleation and growth. Our proposed failure criterion seeks to ad-vance this gap in knowledge with additional insights into damage evolution.
The proposed failure criterion takes into account the effect of volume or area over which damage is nucleated to assess its susceptibility to damage:
σmicrosp =
σsp
AFracDam, (2)
whereσsp is the spall strength measured traditionally
from the PDV data andAFracDamis the damage area
frac-tion assessed from the metallography on the 2D cross-section of the recovered sample. Ideally, the damage area fraction would actually be a damage volume fraction but in this work we focus on normalizing by the area fraction since that can be assessed from a 2D cross-section of the sample whereas a volume fraction estimate requires serial sectioning of the sample. This will be included in the next
version of the criterion but we do not expect it to change the trends in the resistance to damage.
2.2 Experiments
For all the examples discussed in Section 3, all targets were prepared with press-fit momentum trapping rings to mitigate perturbations from edge release waves. A typi-cal square wave profile was achieved using a varying flyer materials at varying pressures. The details of which can be found in references describing the details of each study [5, 16, 17]. Impact velocities were measured to an accu-racy of 1% using a sequential pressure transducer tech-nique and sample tilt was fixed to 1 mrad by means of an adjustable specimen mounting fixture. Following im-pact, all samples were soft recovered by decelerating them into low-density foam. The free surface velocity history (uf s(t)) profiles were measured using multiple PDV probes
and data was analyzed using the procedures described by Jensen et al [19]
Subsequent characterization of the damage in the spalled samples included optical and Electron Back Scat-ter Diffraction (EBSD) microscopy. In preparation for the optical and EBSD analyses, each recovered speci-men was diametrically sectioned. They were subsequently mounted in an epoxy resin and prepared following stan-dard metallographic techniques as listed in the references [5, 16, 17].ImageJ analysis was performed on optical mi-crographs to quantify the total damage. As part of this analysis, images were obtained of the sample 2D cross sec-tion at 10x magnificasec-tion. Each image was then converted to greyscale and then a threshold applied so that the voids were selected but other dark features such as grain bound-aries were not. The selected voids were then subjected to a particle size analysis to provide data such as number of particles and area percentage.
3 Results
3.1 Example 1: Grain Size Effects in Copper
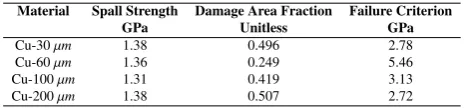
Work by Escobedo et. al investigated four different grain size ranging from 30-200µmin copper to study the effect of grain size on the spall strength and total nucleated dam-age within the samples [17]. The results from this study showed that the measured spall strength was independent of grain size. In fact, the PDV profiles were found to be identical for each study except for the slope of the pull-back signals. If spall strength is simply the stress required to nucleate a void within a sample and the distribution of the weak links in form of grain boundaries in the different samples was unchanged then these results would be valid. However, postmortem analysis of these materials showed that the total damage in the recovered sample varied as a function of grain size, which is inconsistent with the con-clusions solely derived from the PDV profiles. This work highlights the importance of sample recovery in experi-ments focusing on understanding the role of microstruc-ture on damage and failure. The new failure criterion ap-plied to the data reported in the paper to test the robustness
of this new criterion and gain insights into the effect of mi-crostructure on damage and failure as shown in Table 1.
Table 1.Spall strength, damage fraction and the normalized failure criterion for Copper.
Material Spall Strength Damage Area Fraction Failure Criterion
GPa Unitless GPa
Cu-30µm 1.38 0.496 2.78
Cu-60µm 1.36 0.249 5.46
Cu-100µm 1.31 0.419 3.13
Cu-200µm 1.38 0.507 2.72
The new failure criterion indeed shows that the largest grain size material was the weakest, followed by the 30 µm, 100 µmand finally the 60 µm material. This con-clusion was also reached in the initial study but through a lengthy discussion, which involved separate discussion of the spall strength and the measured damage. The new failure criterion not only simplifies this analysis but can be used as a failure criterion, which could reproduce the experimentally observed results. Using the original spall strength as the only failure criterion would have not cap-tured the varying amounts of damage observed in the sam-ples. Until we have microstructure based models that can evolve the nucleated damage, based on microstructural features, this new criterion can be used indirectly capture the total strength of the material under dynamic loading conditions.
3.2 Example 2: Cu, Cu-24wt%Ag and Cu-10wt%Nb
The question of strength in materials becomes even more complex for multi-component alloys.
Table 2.Spall strength, damage area fraction and the normalized failure criterion for Cu, CuAg and CuNb.
Material Spall Strength Damage Area Fraction Failure Criterion
GPa Unitless GPa
Cu 1.328 0.967 1.37
CuAg 1.421 1.826 0.77
CuNb 1.806 1.045 1.73
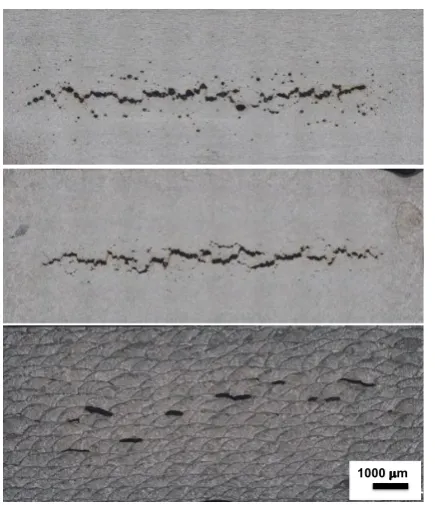
In this section, we discuss the effect of adding Ag and Nb to copper on its susceptibility to damage [5]. The de-tails of the experiments are listed in Ref. [5] In the case of Cu alloyed with Ag and Nb simply considering the spall strength measured from the PDV profiles would suggest that Cu nucleated the most amount of damage followed by CuAg and CuNb as listed in Table 2. However, the to-tal amount of damage present in the samples (as shown in Fig. 1) is not consistent with this conclusion.
1000 µm
Fig. 1. Optical micrographs of Copper (Top), Cu-Ag (middle) and Cu-Nb (bottom). The larger black regions represent voids.
3.3 Example 3: Wrought, additively manufactured, additively manufactured and heat treated 316L Stainless steel
Processing can be used to alter the microstructure of mate-rials and additive manufacturing (AM) is one such process. Experiments were performed to investigate the dynamic strength of additively manufactures 316L SS in compari-son with its wrought counterpart the details of which are discussed in Ref. [16]. Additional heat treatments were
Table 3.Spall strength, damage area fraction and the normalized failure criterion for 316L SS.
Material Spall Strength Damage Area Fraction Failure Criterion
GPa Unitless GPa
Wrought 2.57 1.86 1.38
AM-RX 2.87 1.569 1.83
AM 3.43 0.983 3.49
performed on the additive material to induce recrystalliza-tion in order to erase the processing history of the rial. The spall strength measurements suggested the mate-rial with the strongest resistance to damage to be the 316L AM followed by AM heat treated material (AM-RX) and then the 316L SS wrought, respectively as shown in Ta-ble 3 This observation is consistent with the total amount of damage shown in Fig. 2. However, without the post-mortem analysis, the pull-back data would lead to spuri-ous conclusions. In this specific case, the new failure crite-rion actually matches the conclusions drawn from the spall strength trends. However, without the recovery analysis it would have been impossible to observe the differences in the morphology of the nucleated voids in the AM material. This is a case where even though the resistance to damage information in the material is not altered by our analysis but it stresses the importance of recovery when trying to infer the effect of microstructure on damage and failure.
In addition to the examples listed in this paper, there exist many other cases where similar observations have been made regarding the damage evolution in recovered samples and an incomplete representation of damage by the PDV data [20]. Specifically, the anisotropic dam-age evolution when a material is shock loaded along the
1000 µm
Fig. 2. Optical micrographs showing post-spall damage in 316L SS (top) wrought, (middle) AM heat treated and (bottom) AM. The larger black regions represent voids.
in-plane versus through-thickness directions is never well represented by the PDV data. This is clearly demonstrated in the case of Zr and Ta that were loaded along the in-plane and thru-thickness directions. Even though the PDV data was found to be nominally similar for loading along these two directions, the damage evolution was completely dif-ferent [20]. This new criterion would be able to account for these differences in anisotropic evolution of damage. Similar observations exist for 1080 eutectoid steel and HY-100 steel [20].
4 Conclusions
1000 µm
Fig. 1. Optical micrographs of Copper (Top), Cu-Ag (middle) and Cu-Nb (bottom). The larger black regions represent voids.
3.3 Example 3: Wrought, additively manufactured, additively manufactured and heat treated 316L Stainless steel
Processing can be used to alter the microstructure of mate-rials and additive manufacturing (AM) is one such process. Experiments were performed to investigate the dynamic strength of additively manufactures 316L SS in compari-son with its wrought counterpart the details of which are discussed in Ref. [16]. Additional heat treatments were
Table 3.Spall strength, damage area fraction and the normalized failure criterion for 316L SS.
Material Spall Strength Damage Area Fraction Failure Criterion
GPa Unitless GPa
Wrought 2.57 1.86 1.38
AM-RX 2.87 1.569 1.83
AM 3.43 0.983 3.49
performed on the additive material to induce recrystalliza-tion in order to erase the processing history of the rial. The spall strength measurements suggested the mate-rial with the strongest resistance to damage to be the 316L AM followed by AM heat treated material (AM-RX) and then the 316L SS wrought, respectively as shown in Ta-ble 3 This observation is consistent with the total amount of damage shown in Fig. 2. However, without the post-mortem analysis, the pull-back data would lead to spuri-ous conclusions. In this specific case, the new failure crite-rion actually matches the conclusions drawn from the spall strength trends. However, without the recovery analysis it would have been impossible to observe the differences in the morphology of the nucleated voids in the AM material. This is a case where even though the resistance to damage information in the material is not altered by our analysis but it stresses the importance of recovery when trying to infer the effect of microstructure on damage and failure.
In addition to the examples listed in this paper, there exist many other cases where similar observations have been made regarding the damage evolution in recovered samples and an incomplete representation of damage by the PDV data [20]. Specifically, the anisotropic dam-age evolution when a material is shock loaded along the
1000 µm
Fig. 2. Optical micrographs showing post-spall damage in 316L SS (top) wrought, (middle) AM heat treated and (bottom) AM. The larger black regions represent voids.
in-plane versus through-thickness directions is never well represented by the PDV data. This is clearly demonstrated in the case of Zr and Ta that were loaded along the in-plane and thru-thickness directions. Even though the PDV data was found to be nominally similar for loading along these two directions, the damage evolution was completely dif-ferent [20]. This new criterion would be able to account for these differences in anisotropic evolution of damage. Similar observations exist for 1080 eutectoid steel and HY-100 steel [20].
4 Conclusions
We have developed a new microstructure based criterion for failure that couples the spall strength with the total area of damage within a material. The importance of cou-pling the wave-profile signal with the damage evolution is to both assess the operative damage processes (such as ductile void formation, shear localization, brittle cracking, intergranular fracture) as well as the volume of the sam-ple over which damage manifests. The development of microstructurally-aware predictive models for spallation is predicated on quantification of both the damage mecha-nism as well as the kinetics and volume within the sample over which this energy is dissipated. This new criterion is applied to a few problems reported in the literature to show that this criterion does indeed capture the resistance of material to total damage which includes void growth and coalescence and not just nucleation of voids. In the absence of microstructurally aware spall models, this cri-terion can be used as an indirect method of including mi-crostructure into the damage models. This work is a step in
the right direction and future work will involve addition of 3D volume effects obtained from X-ray Tomography type analysis into this new criterion.
References
1. G. I. Kanel, Spall Fracture: Methodological aspects, mechanisms and governing factors, Int. J. Frac. 163, 173-191 (2010)
2. D. Curran, L. Seaman, D. Shockley, Dynamic failure of solids, Phys. Reports,147, 253 -388 (1987)
3. L. Seaman, D. R. Curran, D. A. Shockley, Computa-tional models for ductile and brittle fracture, J. Appl. Phys.47, 4814-26 (1976)
4. G. T. (Rusty) Gray III, High-strain-rate deformation: Mechanical behavior and deformation substructures in-duced, Ann. Rev. Mater. Res.42, 285-303 (2012) 5. S. J. Fensin, E. K. walker, E. K. Cerreta, C. P. Trujillo,
D. T. Martinez, and G. T. Gray III, Dynamic failure in two-phase materials, J. App. Phys.18, 235305 (2015) 6. S. J. Fensin, E. K. Cerreta, G. T. Gray III and S. M.
Valone, Why are some Interfaces in Materials Stronger than others, Sci. Rep.4, 5641 (2014)
7. S. A. Novikov, I. I. Divnov. and A. G. Ivanov, The study of fracture of steel, aluminum, and copper under explo-sive loading, Phys. Met. Metallogr.21, 122 (1966) 8. G.V. Stepanov, Spall fracture of metals by
elastic-plastic loading waves, Problemy Prochnosti 8, 66?70 (1976) (in Russian)
9. G. I. Kanel, S. V. Razorenov, K. Baumung, J. Singer, Dynamic yield and tensile strength of aluminum single crystals at temperatures up to the melting point, J Appl Phy90, 136-143 (2001)
10. T. Antoun, L. Seaman, D. R. Curran,G. I. Kanel ,S. V. Razorenov, A. V. Utkin, Spall fracture, Springer, New York (2003)
11. M. A. Meyers, C. T. Aimone, Dynamic fracture (spalling) of metals, Prog. Mater. Sci28, 1-96 (1983) 12. L. Seaman, D. Curran, D. Shockley, Dynamic failure
in solids, Phys. Today30, 46-55 (1977)
13. R. W. Minich, J. Cazamias, M. Kumar, A. Schwartz, Effect of microstructural length scales on spall behavior of copper, Metall. Mater. Trans. A35, 2663-73 (2004) 14. R. W. Minich, M. Kumar, A. Schwatz, J. Cazamias,
Scaling, microstructure and dynamic fracture, AIP Conf. Proc.845, 642-45 (2006)
15. G. I. Kanel, S. V. Rasorenov, V. E. Fortov, Shock Wave and High-Strain-Rate Phenomena in Materials (Marcel Dekker, Cambridge, 1992)
16. G. T. Gray III, V. Livescu, P. A. Rigg, C. P. Trujillo, C. M. Cady, S. R. Chen, J. S. Carpenter, T. J. Lienert, S. J. Fensin, Structure/Property (constitutive and spallation response) of additively manufactured 316L steel, Acta Mat.138,140-149 (2017)
17. J. P. Escobedo-Diaz, D. Dennis-Koller, E. K. Cerreta, B. M. Patterson, C. A. Bronkhorst, B. L. Hansen, D. Tonks, R. A. Lebensohn, Effects of grain size and bound-ary structure on the dynamic tensile response of copper, J. Appl. Phys.110, 033513 (2011)
18. W. D. Callister Jr, D. G. Rethwisch, Materials Sci-ence and Engineering, John Wiley and Sons, Hoboken, NJ (2008)
19. B. J. Jensen, D. B. Holtkamp, P. A. Rigg, and D. H. Dolan, J. Appl. Phys.101, 013523 (2007)