Scholarship@Western
Scholarship@Western
Electronic Thesis and Dissertation Repository
8-10-2017 12:00 AM
Hydrodynamics in the Gas-Driven Inverse Liquid-Solid Fluidized
Hydrodynamics in the Gas-Driven Inverse Liquid-Solid Fluidized
Bed
Bed
Jiaqi HuangThe University of Western Ontario
Supervisor Jesse Zhu
The University of Western Ontario
Graduate Program in Chemical and Biochemical Engineering
A thesis submitted in partial fulfillment of the requirements for the degree in Master of Engineering Science
© Jiaqi Huang 2017
Follow this and additional works at: https://ir.lib.uwo.ca/etd
Part of the Catalysis and Reaction Engineering Commons, and the Other Chemical Engineering Commons
Recommended Citation Recommended Citation
Huang, Jiaqi, "Hydrodynamics in the Gas-Driven Inverse Liquid-Solid Fluidized Bed" (2017). Electronic Thesis and Dissertation Repository. 4755.
https://ir.lib.uwo.ca/etd/4755
This Dissertation/Thesis is brought to you for free and open access by Scholarship@Western. It has been accepted for inclusion in Electronic Thesis and Dissertation Repository by an authorized administrator of
i
A novel reactor named Gas-Driven Inverse Liquid-Solid Fluidized Bed (GDFB for short)
was developed in this research. A vertical baffle divides the column into a riser and a
downer. Inverse fluidization is driven by the gas and occurs in the downer, where
hydrodynamics and their influencing factors were studied. In the solid-baffle system, four
fluidization regimes were observed, including the packed bed, semi-fluidized bed,
fully-fluidized bed, and circulating bed. Bed expansion ratio was higher for particles with a
higher density and a smaller solids loading. Moreover, the average particle velocity was
proportional to superficial gas velocity and higher for denser particles. In the
meshed-baffle system, the shifted bed was found between the fully-fluidized bed and the
circulating bed, and some hydrodynamics differed from that in the solid-baffle system.
Considering the similarity and diversity, a solid baffle or a meshed baffle should be
selected depending on the needs of chemical processes.
Keywords
Inverse Liquid-Solid Fluidized Bed (ILSFB), inverse fluidization, fluidization regime,
gas velocity, solids loading, bed expansion, particle properties, particle circulation,
ii
Title: Hydrodynamics in the Gas-Driven Inverse Liquid-Solid Fluidized Bed
Author: Jiaqi Huang, Jesse Zhu
The experimental apparatus of the Gas-Driven Inverse Liquid-Solid Fluidized
Bed (GDILSFB) was constructed by Jiaqi Huang under the guidance of Dr. Jesse
Zhu. Jiaqi Huang performed all the experiments and wrote the drafts of this
manuscript. Data analysis and modifications of this work were undertaken with
the advice from Dr. Jesse Zhu. The final version of this paper is ready for
submission.
Title: Gas-Driven Inverse Liquid-Solid Fluidized Bed with Circulation
Author: Jiaqi Huang, Jesse Zhu, Tian Nan
The experimental apparatus of the Gas-Driven Inverse Liquid-Solid Fluidized
Bed (GDILSFB) was constructed and modified by Jiaqi Huang under the
guidance of Dr. Jesse Zhu and assisted by Tian Nan. Jiaqi Huang performed all
the experiments and wrote the drafts of this manuscript. Data analysis and
modifications of this work were undertaken with the advice from Dr. Jesse Zhu
iii
I would like to take this chance to express the appreciation and gratitude to all those who
have been supporting me in the academic and daily life.
My sincerest gratitude is expressed to Professor Jesse Zhu for being my supervisor, and
especially for giving me the opportunity to start my Master’s study. Thanks to his
instructions and motivation, I was able to complete my research project and learn
practical problem-solving skills in the meanwhile. His achievement and personality will
continuously encourage me to pursue further self-improvement for the rest of my life.
I would like to express my deepest appreciation to Tian Nan for his guidance and help
throughout the entire study. He is always an excellent colleague and a reliable friend.
My gratefulness is also directed to all my friends in the research group for their help in
the academic and daily life. Special thanks go to Xiaoyang Wei for his guidance and
advice in data analysis.
Much appreciation is extended to George Zhang for his technical support in the
laboratory.
Finally, I would like to thank my family, especially my parents, for their unconditional
support, encouragement, and love. Without them, I could not have accomplished my
iv
Abstract ... i
Co-Authorship Statement... ii
Acknowledgments... iii
Table of Contents ... iv
List of Tables ... vii
List of Figures ... viii
List of Appendices ... xi
Chapter 1 ... 1
1 General Introduction ... 1
1.1 Introduction ... 1
1.2 Objectives ... 3
1.3 Thesis Structures ... 3
References ... 4
Chapter 2 ... 6
2 Hydrodynamics in the Gas-Driven Inverse Liquid-Solid Fluidized Bed ... 6
2.1 Introduction ... 6
2.2 Experimental Apparatus and Procedures ... 8
2.3 The Main System ... 12
2.3.1 The Inverse Fluidization Regimes ... 12
2.3.2 Initial and Uniform Fluidization Velocities ... 13
2.3.3 Bed Expansion ... 16
2.4 The Alternative System ... 27
2.4.1 The Inverse Fluidization Regimes ... 27
v
Nomenclature ... 34
References ... 36
Chapter 3 ... 38
3 Gas-Driven Inverse Liquid-Solid Fluidized Bed with Circulation ... 38
3.1 Introduction ... 38
3.2 Materials and Methods ... 40
3.2.1 Experimental Apparatus and Procedures ... 40
3.2.2 Optical Fiber Probe (OFP) ... 44
3.3 The Main System ... 45
3.3.1 The Fluidization Regimes ... 45
3.3.2 Transition Velocity ... 47
3.3.3 Average Particle Velocity ... 48
3.4 The Alternative System ... 53
3.4.1 The Fluidization Regimes ... 53
3.4.2 Transition Velocity ... 54
3.4.3 Average Particle Velocity ... 55
3.5 Conclusions ... 57
Nomenclature ... 58
References ... 60
Chapter 4 ... 63
4 Conclusions and Recommendations ... 63
4.1 Conclusions ... 63
vi
Appendix A. Examples of error analysis ... 65
Appendix B1. Initial fluidization velocity, uniform fluidization velocity, and transition velocity ... 67
Appendix B2. Average particle velocity ... 68
Appendix C. Rotameter calibration... 70
vii
Table 2.1 List of particles and their properties ... 10
Table 2.2 Summary of linear relationship between the logarithms of bed expansion ratio
(log10(𝐻/𝐻0)) (y) and excess superficial gas velocity (𝑈𝐺 − 𝑈𝑖𝑓) (x) ... 25
Table 3.1 List of particles and their properties ... 42
Table 3.2 Linear equations for predicting the average particle velocity (y) based on the
viii
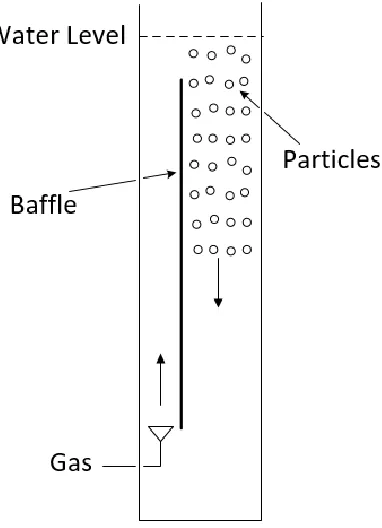
Figure 1.1 Sketch of the GDFB ... 2
Figure 2.1 Simplified schematic diagram of the GDFB ... 7
Figure 2.2 Schematic diagram of the GDFB and the cross-sectional view of column ... 9
Figure 2.3 Photo of the particles used in the experiments ... 10
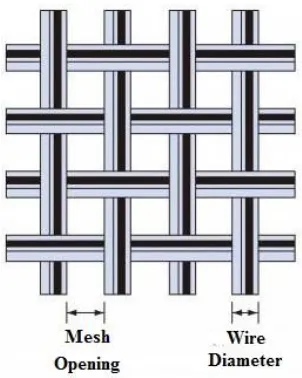
Figure 2.4 Enlarged mesh ... 11
Figure 2.5 The inverse fluidization regimes in the main system ... 13
Figure 2.6 Initial fluidization velocity (𝑈𝑖𝑓) versus solids loading for three types of particles in the main system. ... 14
Figure 2.7 Uniform fluidization velocity (𝑈𝑢𝑓) versus solids loading for three types of particles in the main system. ... 16
Figure 2.8 Bed expansion ratio (𝐻/𝐻0) against the excess superficial gas velocity (𝑈𝐺 − 𝑈𝑖𝑓) at different solids loadings for particles with a density of (a) 904 kg/m3, (b) 930 kg/m3, and (c) 950 kg/m3 in the main system. ... 19
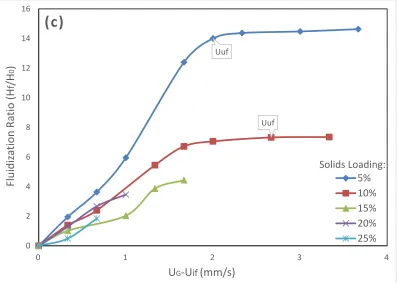
Figure 2.9 Fluidization ratio (𝐻𝑓/𝐻0) against the excess superficial gas velocity (𝑈𝐺− 𝑈𝑖𝑓) at different solids loadings for particles with a density of (a) 904 kg/m3, (b) 930 kg/m3, and (c) 950 kg/m3 in the main system. ... 21
Figure 2.10 Fraction of packed bed (𝐻𝑝/𝐻) against the excess superficial gas velocity (𝑈𝐺 − 𝑈𝑖𝑓) at different solids loadings for particles with a density of (a) 904 kg/m3, (b) 930 kg/m3, and (c) 950 kg/m3 in the main system. ... 23
ix
(a) 904 kg/m3 and (b) 930 kg/m3 in the main system. ... 26
Figure 2.13 The inverse fluidization regimes in the alternative system ... 28
Figure 2.14 Initial fluidization velocity (𝑈𝑖𝑓) versus solids loading for particles with a density of 930 kg/m3 in the main system with solid baffle and in the alternative system with a meshed baffle.... 29
Figure 2.15 Uniform fluidization velocity (𝑈𝑢𝑓) versus solids loading for particles with a density of 930 kg/m3 in the main system with solid baffle and in the alternative system with a meshed baffle.... 30
Figure 2.16 Bed expansion ratio (𝐻/𝐻0) against the excess superficial gas velocity (𝑈𝐺 − 𝑈𝑖𝑓) at different solids loadings for particles with a density of 930 kg/m3 in the alternative system. ... 31
Figure 2.17 Fluidization ratio (𝐻𝑓/𝐻0) against the excess superficial gas velocity (𝑈𝐺− 𝑈𝑖𝑓) at different solids loadings for particles with 930 kg/m3 in the alternative system. . 32 Figure 2.18 Fraction of packed bed (𝐻𝑝/𝐻) against excess superficial gas velocity (𝑈𝐺 − 𝑈𝑖𝑓) at different solids loadings for particles with 930 kg/m3 in the alternative system. . 32 Figure 3.1 Sketch of the GDFB ... 39
Figure 3.2 Schematic drawing of the GDFB and the cross section of column ... 41
Figure 3.3 Photo of particles used in this study ... 42
Figure 3.4 Enlarged mesh ... 43
Figure 3.5 OFP diagram for particle velocity measurement (Sang, 2013) ... 44
x
Figure 3.8 Transition velocity (𝑈𝑡𝑟) against solids loading for three types of particles in the main system. ... 48
Figure 3.9 Average particle velocity (𝑈𝑃) versus the superficial gas velocity (𝑈𝐺) at different solids loadings for particles with a density of (a) 904 kg/m3, (b) 930 kg/m3, and
(c) 950 kg/m3 in the main system. ... 51
Figure 3.10 Average particle velocity (𝑈𝑃) versus superficial gas velocity (𝑈𝐺) for three types of particles at (a) 5% solids loading and (b) 10% solids loading in the main system.
... 52
Figure 3.11 The fluidization regimes of the GDFB in the alternative system ... 53
Figure 3.12 Transition velocity (𝑈𝑡𝑟) versus solids loading for particles with 930 kg/m3 in the main system with a solid baffle and in the alternative system with a meshed baffle. . 54
Figure 3.13 Average particle velocity (𝑈𝑃) versus superficial gas velocity (𝑈𝐺) at
different solids loadings for particles with 930 kg/m3 in the alternative system. ... 55
Figure 3.14 Average particle velocity (𝑈𝑃) versus superficial gas velocity (𝑈𝐺) at 15% solids loading for particles with 930 kg/m3 in the alternative system and the main system.
... 56
Figure. A Initial fluidization velocity (𝑈𝑖𝑓) versus solids loading with error bars for particles with a density of 930 kg/m3 in the main system and in the alternative system. . 65
Figure. B Bed expansion ratio (𝐻/𝐻0) with error bars for particles with 904 kg/m3 at 5% solids loading in the main system. ... 66
xi
List of Appendices
Appendix A. Examples of error analysis ... 65
Appendix B1. Initial fluidization velocity, uniform fluidization velocity, and
transition velocity ... 67
Appendix B2. Average particle velocity ... 68
Chapter 1
1
General Introduction
1.1
Introduction
The traditional fluidization applies to solid particles having a higher density than the
fluid. When a gas or liquid flows opposite to the direction of the gravity and counters the
net downward force of the particles, fluidization of particles is realized. In contrast, to
fluidize light particles with a density lower than the liquid, the liquid stream must be
flowing downward to overcome the net buoyancy force. Such a system is known as the
inverse fluidization (Fan, Muroyama, & Chern, 1982). Inverse fluidized beds have
attracted more and more attention in the past decades due to their advantages over the
upward fluidized beds. For example, inverse fluidization contributes to the maintenance
of high mass transfer rate and appropriate biofilm thickness (Nikolov & Karamanev,
1987), the efficient process control (Renganathan & Krishnaiah, 2004), and
re-fluidization after breakdown (Renganathan & Krishnaiah, 2003). Thus, inverse fluidized
beds have been employed in various biological processes, including ferrous iron
oxidation, wastewater treatment (Nikolov & Karamanev, 1987), and phenol
biodegradation (Sabarunisha Begum & Radha, 2014).
Moreover, compared to conventional fluidization, circulating fluidized beds are able to
reduce the back-mixing of phases and increase the interfacial contact efficiency (Zhu et
al., 2000). Hence, liquid-solid circulating fluidized beds (LSCFB) have been introduced
to several industries, such as the continuous recovery of whey proteins (Lan et al., 2000),
the enzymatic phenol polymerization (Trivedi, Bassi, & Zhu, 2006), and the extractive
fermentation of lactic acid (Patel et al., 2008). Also, biological nutrients in the municipal
wastewater could be removed by an LSCFB in the pilot scale (Chowdhury et al., 2009).
In this study, combining the benefits of inverse fluidized beds and circulating
fluidization, the novel Gas-Driven Inverse Liquid-Solid Fluidized Bed (GDILSFB or
GDFB for short) was developed. The significant difference between the GDFB and the
stream instead of a continuous liquid flow. Figure 1.1 shows a sketch of the GDFB. The
column consists of a riser and a downer separated by a baffle. The gas fed into the riser
drives the inverse fluidization of light particles in the downer. When the gas flowrate is
sufficient, particles can circulate around the baffle continuously. As a result, proper
operating conditions, both conventional inverse fluidization and circulating fluidization
can be achieved in the GDFB. A detailed description will be given in the later chapters.
The goal of introducing this new reactor is to offer another option in biological processes
which require high mass transfer rate and low energy consumption. Especially in
wastewater treatment, the GDFB might be beneficial for the control of biofilm thickness
and handling of large capacities.
1.2
Objectives
To understand the novel gas-driven inverse liquid-solid fluidized bed (GDFB) and
explore its potential applications, the objectives of this research include:
1. Design and construct the GDFB and test the operating conditions for achieving
fluidization.
2. Investigate some basic hydrodynamic characteristics of the GDFB, such as the
fluidization regimes, bed expansion, and particle velocity.
3. Study the effects of particle properties, solids loading, superficial gas velocity,
and baffle structure on the hydrodynamics.
1.3
Thesis Structures
This thesis contains four chapters and follows the integrated article format.
Chapter 1 provides a general introduction about the background and objectives of the
current research as well as the thesis structure.
Chapter 2 reports the hydrodynamics in the GDFB, including the fluidization regimes,
initial fluidization velocity, uniform fluidization velocity, and bed expansion. The
influence of particle properties, solids loading, superficial gas velocity, and baffle
structure are described as well.
Chapter 3 focuses on the circulation of particles in the GDFB. The transition velocity and
average particle velocity are discussed along with the effects of superficial gas velocity,
solids loading, particle properties, and baffle structure.
References
Chowdhury, N., Zhu, J., Nakhla, G., Patel, A., & Islam, M. (2009). A Novel Liquid-Solid
Circulating Fluidized-Bed Bioreactor for Biological Nutrient Removal from
Municipal Wastewater. Chemical Engineering and Technology, 32(3), 364–372.
http://doi.org/10.1002/ceat.200800564
Fan, L., Muroyama, K., & Chern, S.-H. (1982). Hydrodynamic Characteristics of Inverse
Fluidization in Liquid-Solid and Gas-Liquid-Solid Systems. The Chemical
Engineering Journal, 24, 143–150.
Lan, Q., Zhu, J. (Jesse), Bassi, A. S., Margaritis, A., Zheng, Y., & Rowe, G. E. (2000).
Continuous Protein Recovery Using a Liquid-Solid Circulating Fluidized Bed Ion
Exchange System: Modelling and Experimental Studies. The Canadian Journal of
Chemical Engineering, 78, 858–866.
Nikolov, L., & Karamanev, D. (1987). Experimental Study of the Inverse Fluidized Bed
Biofilm Reactor. The Canadian Journal of Chemical Engineering, 65(April 1987),
214–217.
Patel, M., Bassi, A. S., Zhu, J. J.-X., & Gomaa, H. (2008). Investigation of a
Dual-Particle Liquid-Solid Circulating Fluidized Bed Bioreactor for Extractive
Fermentation of Lactic Acid. Biotechnology Progress, 24, 821–831.
http://doi.org/10.1021/bp.6
Renganathan, T., & Krishnaiah, K. (2003). Prediction of Minimum Fluidization Velocity
in Two and Three Phase Inverse Fluidized Beds. The Canadian Journal of Chemical
Engineering, 81(August), 853–860.
Renganathan, T., & Krishnaiah, K. (2004). Liquid phase mixing in 2-phase liquid-solid
inverse fluidized bed. Chemical Engineering Journal, 98(August 2003), 213–218.
http://doi.org/10.1016/j.cej.2003.08.001
Sabarunisha Begum, S., & Radha, K. V. (2014). Hydrodynamic behavior of inverse
fluorescens. Korean Journal of Chemical Engineering, 31(3), 436–445.
http://doi.org/10.1007/s11814-013-0260-z
Trivedi, U., Bassi, A., & Zhu, J.-X. (Jesse). (2006). Continuous enzymatic
polymerization of phenol in a liquid-solid circulating fluidized bed. Powder
Technology, 169, 61–70. http://doi.org/10.1016/j.powtec.2006.08.001
Zhu, J.-X. (Jesse), Zheng, Y., Karamanev, D. G., & Bassi, A. S. (2000). (Gas-)
Liquid-Solid Circulating Fluidized Beds and their Potential Applications to Bioreactor
Chapter 2
2
Hydrodynamics in the Gas-Driven Inverse Liquid-Solid
Fluidized Bed
2.1
Introduction
In the classic fluidization, solid particles with a density higher than the fluid are fluidized
by a liquid or gas stream flowing in the opposite direction to that of gravity. When the
particles have a lower density than the fluid (usually liquid), fluidization is achieved by
the liquid moving downward to counter the net buoyancy force of the particles. Such a
system is referred to the inverse fluidization (Fan et al., 1982). In the past decades, the
advantages of the inverse fluidized bed (IFB) have been proven by many studies.
Compared to the conventional upward fluidized bed, the inverse fluidization allows
effective control of the process (Renganathan & Krishnaiah, 2004), high mass transfer
rate (Nikolov & Karamanev, 1987), easy re-fluidization after sudden breakdown
(Renganathan & Krishnaiah, 2003), etc. Especially, in the biological treatment of
wastewater, the inverse fluidized bed is capable of controlling the biofilm thickness
within a narrow range (Nikolov & Karamanev, 1987). As a result, the inverse fluidization
is preferable in many biological processes such as the wastewater treatment, ferrous iron
oxidation (Nikolov & Karamanev, 1987), and phenol biodegradation (Sabarunisha
Begum & Radha, 2014).
In order to design, model and operate a pilot-scale fluidized bed, it is crucial to
understand the hydrodynamic characteristics in the lab-scale reactor. In the past, many
researchers have made efforts to study inverse fluidized beds. Fan et al. (1982)
determined the flow patterns of the three-phase inverse fluidized bed and a modified
model for predicting hydrodynamics. Later on, Karamanev and Nikolov investigated the
bed porosity, minimum fluidization velocity, and correlations to predict bed expansion in
an inverse fluidized bed (Karamanev & Nikolov, 1992). Ulaganathan and Krishnaiah
proposed the three regimes of a liquid-solid inverse fluidized system, which are the
packed bed, semi-fluidized bed, and fully-fluidized bed (Ulaganathan & Krishnaiah,
Carboxymethyl cellulose (CMC) concentrations on the minimum fluidization velocity
and bed expansion (Femin Bendict, Kumaresan, & Velan, 1998). In addition, Vijaya
Lakshmi et al. discussed the relationship between the friction factor and solids loading
and fluid viscosity (Vijaya Lakshmi et al., 2000).
Considering the merits of inverse fluidization, a new type of reactor has been developed
in this study, named as the Gas-Driven Inverse Liquid-Solid Fluidized Bed (GDILSFB or
GDFB for short). Unlike the commonly known liquid-solid fluidized beds, there is no
continuous liquid flow in the GDFB (Figure 2.1). A baffle divides the column into two
vertical sections, a riser and a downer. Gas is introduced into the riser and light particles
are fluidized in the downer. Since the gas escapes to the atmosphere and does not enter
the downer, the downer is believed to be a two-phase inverse fluidized bed. The goal of
introducing this novel reactor is to achieve uniform fluidization with a relatively low
energy consumption. To understand the GDFB and discover its potential applications,
some basic hydrodynamics, including the fluidization regimes and bed expansion, are
studied in this paper. Meanwhile, the effects of superficial gas velocity, solids loading,
particle properties, and baffle opening on the hydrodynamics are discussed as well.
2.2
Experimental Apparatus and Procedures
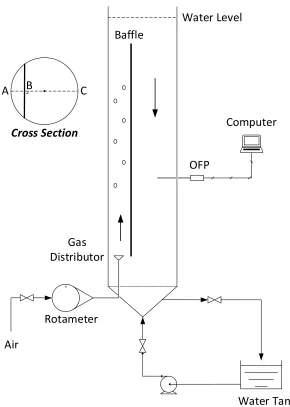
The schematic diagram of the GDFB and a cross-sectional view of the column is shown
in Figure 2.2. The column has an inner diameter (ID) of 12.5 cm and its top is open to the
atmosphere. A vertical baffle with a width of 10 cm and a length of 270 cm divides the
column into two sections with unequal areas. The section with a smaller cross-sectional
area is the riser and that with a larger area is defined as the downer. In the cross-sectional
view of the column, point B represents the point at which the baffle crosses the ID
perpendicularly, while point A and point C are end points of the ID. The ratio of line
segments AB to BC is 1:4, which means that the baffle locates at the one-fifth point of
the ID. Hence, the area of the downer is about six times the area of the riser. These two
unequal areas are designed to lower the energy cost required for fluidization. Since the
superficial gas velocity (𝑈𝐺) is the quotient of gas flowrate divided by the area of the riser, for a certain gas flowrate, the smaller the area, the higher is the superficial gas
velocity (𝑈𝐺). Minimum gas amount is desired to drive more liquid to enter the downer. However, the area of riser should not be so small that the liquid is insufficient for
entrainment by the wake of the bubbles. As a result, the above ratio of the riser and
downer was chosen in this preliminary design of the GDFB. The area ratio of the riser to
the downer can be varied depending on specific needs.
In this research, the gas and the liquid phases are air and tap water, respectively. At the
bottom of the column, a liquid inlet valve allows water to be pumped from a tank into the
column. Meanwhile, water can be discharged back to the tank through an outlet valve. A
microporous gas distributor introduces air into the riser from the air supply and the
flowrate is controlled by a calibrated rotameter. This gas distributor generates bubbles
with a size of about 5 mm. When the air inlet valve is open, bubbles from the gas
distributor rise upward in the riser, causing an upward liquid flow. Then, at the top of the
riser, the gas escapes into the atmosphere, while the liquid form a downward flow in the
downer due to the gravity. If the liquid velocity is sufficient, particles can be carried
downward to achieve inverse fluidization. Several holes on the column wall at different
FI
Rotameter
Air
Gas Distributor
Baffle
P-18
Water Tank OFP
Computer Water Level
A B C
Cross Section
Figure 2.2 Schematic diagram of the GDFB and the cross-sectional view of column
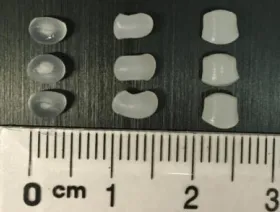
The main variables of this study include particle properties (density, size, and shape),
solids loading, and superficial gas velocity (𝑈𝐺). Three types of light particles were used
(Figure 2.3) and their properties are listed in Table 2.1. Particle size was measured by a
vernier caliper and average equivalent diameter was taken for 50 particles. The terminal
velocity of free rising particles is calculated from the equation:
𝑈𝑡 = √
4𝑔𝑑𝑃(𝜌𝐿− 𝜌𝑃) 3𝜌𝐿𝐶𝐷
𝐶𝐷 =
432
𝐴𝑟 (1 + 0.0470𝐴𝑟
2
3) + 0.517
1 + 154𝐴𝑟−13
(2.2)
For light particles used in this research with 𝐴𝑟 > 1.18 × 10⁶𝑑𝑃2, 𝐶𝐷 = 0.95
(Karamanev, 1996). Moreover, Solids loading is defined as the volumetric percentage
that particles occupied in the total working volume, including the riser and downer.
Hence, solids loading can represent the initial bed height before the onset of fluidization.
The values of solids loading were chosen to be 5%, 10%, 15%, 20%, and 25%. The air
rotameter controls the superficial gas velocity (𝑈𝐺) and thus the bed expansion.
Therefore, for each run, the superficial gas velocity (𝑈𝐺) was adjusted and measurements were taken. Experiments were repeated at five solids loadings for each type of particles.
Figure 2.3 Photo of the particles used in the experiments
Table 2.1 List of particles and their properties
Material
Density 𝝆𝑷
(kg/m3)
Size 𝒅𝑷
(mm)
Sphericity
𝛟 Ar
Ut (cm/s)
Polypropylene (PP) 904 3.5 0.99 40522 6.81
Polyethylene (PE) 930 3.5 0.84 29496 5.81
Polypropylene (PP) 950 4.6 0.87 46900 5.61
Parameters to be determined are the initial fluidization velocity (𝑈𝑖𝑓), uniform
velocity (𝑈𝑖𝑓) is defined as the superficial gas velocity (𝑈𝐺) at which particles in the lowest layer of the packed bed start to move downward, indicating the onset of
fluidization. The uniform fluidization velocity (𝑈𝑢𝑓) is the superficial gas velocity (𝑈𝐺) at which the packed bed no longer exists at the top of the downer.
Ambient temperature was applied for all the experiments. After water and particles were
loaded into the column, the air inlet valve was opened and complete fluidization was
maintained for about an hour to wet all the particles. Then, the gas was cut off and the
upper level of the liquid-solid mixture (water level) was adjusted to 10 cm above the
baffle. This action ensured that the working volume of each experiment was identical. At
the beginning of each experiment, particles were completely fluidized and then the air
flowrate was reduced gradually. The initial fluidization velocity (𝑈𝑖𝑓) and uniform fluidization velocity (𝑈𝑢𝑓) could be obtained when the corresponding states were
reached. Furthermore, by visual observation and a scale attached to the column, the initial
bed height (𝐻0), total bed height (𝐻), and packed bed height (𝐻𝑝) were measured (Figure 2.5). Then, the bed expansion ratio (𝐻/𝐻0), fluidization ratio (𝐻𝑓/𝐻0), and fraction of packed bed (𝐻𝑝/𝐻) could be calculated from the recorded bed heights. For this newly invented GDFB, since the change of the total bed height has not been proven to
demonstrate the same pattern as the fluidized bed height, both the bed expansion ratio
(𝐻/𝐻0) and fluidization ratio (𝐻𝑓/𝐻0) would be studied.
In addition, to compare the impact of baffle structure on the hydrodynamics, another set
of experiments was conducted in the GDFB using a baffle with mesh. The original
system has a solid baffle with zero mesh opening, but a meshed baffle with 64% open
area was installed in the alternative system. The opening of the meshed baffle was
measured to be 0.4 mm and the wire diameter is 0.1 mm (Figure 2.4). In this case, only
particles with a density of 930 kg/m3 were studied and the solids loading ranged from 5%
to 25%.
2.3
The Main System
2.3.1
The Inverse Fluidization Regimes
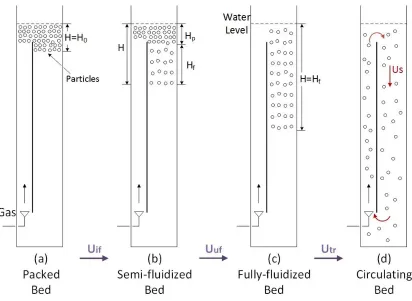
In the GDFB, four types of flow pattern can be observed as the increase of superficial gas
velocity (𝑈𝐺) (Figure 2.5). When the gas flowrate is low, particles suspend at the top of the downer without any movement since the density of particles is lower than that of
water. This is called the packed bed. When the superficial gas velocity (𝑈𝐺) reaches the initial fluidization velocity (𝑈𝑖𝑓), particles in the lowest layer start to detach from the
packed bed. As the gas velocity increases slightly, some particles remain in the packed
bed while the other particles form a fluidized bed. This state refers to the semi-fluidized
bed. By further increasing the gas velocity above the uniform fluidization velocity (𝑈𝑢𝑓),
the packed bed disappears and the fully-fluidized bed is obtained. Furthermore, when the
transition velocity (𝑈𝑡𝑟) is fulfilled, the fluidized bed will transform from the
conventional regime to the circulating regime. In this case, particles occupy the entire
downer and form a continuous flow around the baffle. This article focuses on the
Figure 2.5 The inverse fluidization regimes in the main system
2.3.2
Initial and Uniform Fluidization Velocities
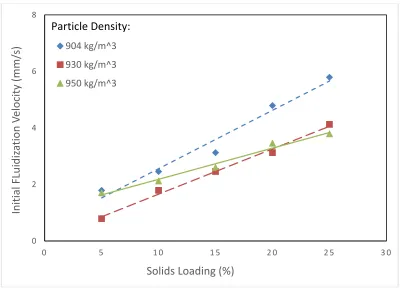
The initial fluidization velocity (𝑈𝑖𝑓) indicates the onset of fluidization in the GDFB and
is useful for finding the lowest gas flowrate to maintain the fluidization. The initial
fluidization velocity (𝑈𝑖𝑓) is plotted against the solids loading for the three types of particles (Figure 2.6). For all the particles, the initial fluidization velocity (𝑈𝑖𝑓) increases with the increase of solids loading (initial bed height). Due to the structure of the GDFB,
the driving force of fluidization is the downward flow of liquid from the riser. When
particles are packed at the top of the downer, they hindered the liquid flow and the actual
flowrate is reduced due to frictional loss. Thus, a higher solids loading results in a thicker
fixed bed and more energy is lost when the liquid flow passes through the packed bed.
Figure 2.6 Initial fluidization velocity (𝑈𝑖𝑓) versus solids loading for three types of particles in the main system.
Comparing the particles with a density of 904 kg/m3 to particles with a density of 930
kg/m3, the higher the particle density, the higher is the initial fluidization velocity (𝑈𝑖𝑓) as these two types of particles have the same size. This trend is similar to that in the upward
fluidization and some former work done in the liquid-solid inverse fluidized bed (Femin
Bendict et al., 1998; Vijaya Lakshmi et al., 2000). Since a lower particle density results in
a larger buoyancy force, a larger downward force (liquid flow) is required to achieve the
onset of fluidization (Femin Bendict et al., 1998). In addition, it is seen that particles with
a density of 904 kg/m3 and a diameter of 3.5 mm have a higher initial fluidization
velocity (𝑈𝑖𝑓) than particles with a density of 950 kg/m3 and a diameter of 4 mm. Since a
larger diameter results in a larger Archimedes number (Ar) and thus a larger buoyancy
force (Vijaya Lakshmi et al., 2000), the initial fluidization velocity (𝑈𝑖𝑓) should be proportional to the particle size. However, the initial fluidization velocity (𝑈𝑖𝑓) is in
0 2 4 6 8
0 5 1 0 1 5 2 0 2 5 3 0
Initial FLuidiz
ation V
elocity
(m
m/
s)
Solids Loading (%)
904 kg/m^3
930 kg/m^3
950 kg/m^3
inverse proportion to the particle density as discussed above. Hence, only the effect of
particle density on the hydrodynamics will be considered based on the comparison of
particles with a density of 904 kg/m3 and particles with 930 kg/m3. More experiments are
needed to investigate the impacts of particle size and shape.
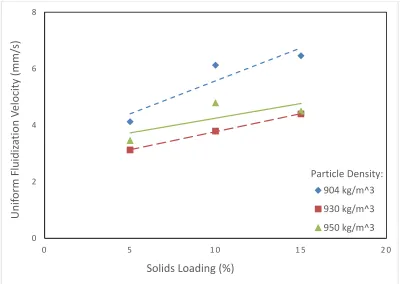
The uniform fluidization velocity (𝑈𝑢𝑓) refers to the state that all the particles are fluidized and the particle distribution in the bed is considered uniform. The plot of the
uniform fluidization velocity (𝑈𝑢𝑓) versus the solids loading for three types of particles is shown in Figure 2.7. It is observed that the uniform fluidization velocity (𝑈𝑢𝑓) is
proportional to the solids loading and inversely proportional to the particle density.
Again, the particles with a density of 950 kg/m3 should not be compared equally because
its size is larger than the other two types. Since these trends of the uniform fluidization
velocity (𝑈𝑢𝑓) are similar to that of the initial fluidization velocity (𝑈𝑖𝑓), their causes can be explained with the same theories. Larger solids loading results in a higher uniform
fluidization velocity (𝑈𝑢𝑓) because of the energy loss through the packed bed. On the
other hand, particles with a higher density are subjected to a smaller buoyancy and thus
requires a lower uniform fluidization velocity (𝑈𝑢𝑓) to realize fluidization. A similar
result was reported by Ulaganathan and Krishnaiah that the minimum fluidization
velocity (𝑈𝑚𝑓) increases with decreasing particle density (Ulaganathan & Krishnaiah, 1996). Since they defined the minimum fluidization velocity (𝑈𝑚𝑓) as the velocity
required to achieve complete fluidization, the previous finding can be a verification of the
current study.
The initial fluidization velocity (𝑈𝑖𝑓) and the uniform fluidization velocity (𝑈𝑢𝑓) are two critical velocities during the developing progress of fluidization. According to the above
discussion, achieving fluidization is easier for particles with a higher density and a
Figure 2.7 Uniform fluidization velocity (𝑈𝑢𝑓) versus solids loading for three types of particles in the main system.
2.3.3
Bed Expansion
As the gas flowrate increases, the packed bed transforms to a semi-fluidized bed and
finally develops the fully-fluidized bed. To incorporate the varying initial fluidization
velocity (𝑈𝑖𝑓), the excess superficial gas velocity (𝑈𝐺− 𝑈𝑖𝑓) is introduced for the
comparison of bed expansion. It is the difference between the superficial gas velocity
(𝑈𝐺) and the initial fluidization velocity (𝑈𝑖𝑓). The bed expansion studies include the bed expansion ratio (𝐻/𝐻0), fluidization ratio (𝐻𝑓/𝐻0), and fraction of packed bed (𝐻𝑝/𝐻).
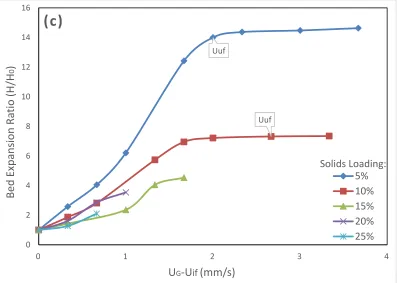
The bed expansion ratio (𝐻/𝐻0) is obtained by dividing the total bed height (𝐻) by the initial bed height (𝐻0). It is plotted against the excess superficial gas velocity (𝑈𝐺− 𝑈𝑖𝑓)
for three types of particles at different solids loadings (Figure 2.8). Since the initial
fluidization velocity (𝑈𝑖𝑓) is constant for a certain solids loading, the x-axis represents the
change of the superficial gas velocity (𝑈𝐺). Similarly, the fluidization ratio (𝐻𝑓/𝐻0) is 0
2 4 6 8
0 5 1 0 1 5 2 0
Unif
orm Fluidiz
ation V
elocity
(m
m/
s)
Solids Loading (%)
904 kg/m^3
930 kg/m^3
950 kg/m^3
plotted against the excess superficial gas velocity (𝑈𝐺− 𝑈𝑖𝑓) in the Figure 2.9. For each type of particles at any solids loading, the bed expansion ratio (𝐻/𝐻0) and the
fluidization ratio (𝐻𝑓/𝐻0) increase with the increase of the superficial gas velocity (𝑈𝐺). The same trend of the bed expansion ratio (𝐻/𝐻0) and the fluidization ratio (𝐻𝑓/𝐻0) verified that the bed expansion was always positive. Therefore, the bed expansion ratio
(𝐻/𝐻0) is able to represent the fluidized bed height in the GDFB.
Furthermore, as the superficial gas velocity (𝑈𝐺) increases, the rate of increase is slow at the beginning and after the uniform fluidization velocity (𝑈𝑢𝑓), while a relatively rapid increase is observed at the middle stage. However, this phenomenon is only obvious for
solids loading less than 15%. Since the expanded bed height is limited by the total height
of the column and a tiny increment of the gas velocity leads to a large increase of the bed
height, the bed can only expand to a small ratio before particles start to circulate. Thus,
the data points for higher solids loadings are not adequate to display the same pattern. At
the beginning of the fluidization, the increment is slow because the driving force is
reduced by friction between the liquid and the packed bed. As more particles are
fluidized, the frictional loss is smaller and the actual flowrate is higher, which accelerates
the bed expansion. The slow growth after reaching the uniform fluidization velocity
(𝑈𝑢𝑓) may be explained by the limited height of the downer. Near the bottom of the
downer, the liquid flow has to enter the riser and part of the downward driving force is
lost again. Therefore, the expansion of the fluidized bed is constrained.
In addition, the increase of the bed expansion ratio (𝐻/𝐻0) and fluidization ratio (𝐻𝑓/𝐻0)
at a lower solids loading is faster than that at a higher solids loading. Whereas,
Ulaganathan and Krishnaiah reported that the dimensionless bed height (𝐻/𝐻0) does not
depend on the initial bed height in the two-phase inverse fluidized bed (Ulaganathan &
Krishnaiah, 1996). As mentioned before, higher solids loading leads to a thicker packed
bed and the actual liquid flowrate is lower. Therefore, the speed of the bed expansion
Uuf Uuf Uuf 0 2 4 6 8 10 12 14 16
0 1 2 3 4 5 6
Be d Ex pansion Ra tio (H /H 0 )
UG-Uif(mm/s)
(a)
5% 10% 15% 20% 25% Solids Loading: Uuf Uuf 0 2 4 6 8 10 12 14 160 1 2 3 4
Be d Ex pansion Ra tio (H /H 0 )
UG-Uif(mm/s)
Figure 2.8 Bed expansion ratio (𝐻/𝐻0) against the excess superficial gas velocity (𝑈𝐺− 𝑈𝑖𝑓) at different solids loadings for particles with a density of (a) 904 kg/m3, (b) 930
kg/m3, and (c) 950 kg/m3 in the main system.
Uuf
Uuf
0 2 4 6 8 10 12 14 16
0 1 2 3 4
Be
d Ex
pansion
Ra
tio
(H
/H
0
)
UG-Uif(mm/s)
(c)
Uuf Uuf Uuf 0 2 4 6 8 10 12 14 16
0 1 2 3 4 5 6
Fluidiz ation Ra tio ( H f /H 0 )
UG-Uif(mm/s)
(a)
5% 10% 15% 20% 25% Solids Loading: Uuf Uuf 0 2 4 6 8 10 12 14 160 1 2 3 4
Fluidiz ation Ra tio ( H f /H 0 )
UG-Uif(mm/s)
Figure 2.9 Fluidization ratio (𝐻𝑓/𝐻0) against the excess superficial gas velocity (𝑈𝐺− 𝑈𝑖𝑓) at different solids loadings for particles with a density of (a) 904 kg/m3, (b) 930
kg/m3, and (c) 950 kg/m3 in the main system.
Moreover, since the bed expansion ratio (𝐻/𝐻0) cannot demonstrate the variance of the
packed bed, the fraction of packed bed (𝐻𝑝/𝐻) is discussed as well. The plots of the fraction of packed bed (𝐻𝑝/𝐻) versus the difference between the excess superficial gas velocity (𝑈𝐺− 𝑈𝑖𝑓) for three types of particles at different solids loadings are shown in Figure 2.10. For each type of particles at the same solids loading, the fraction of packed
bed (𝐻𝑝/𝐻) decreases with the increase of the superficial gas velocity (𝑈𝐺). The
superficial gas velocity (𝑈𝐺) at which the fraction of packed bed (𝐻𝑝/𝐻) approaches zero is approximately the uniform fluidization velocity (𝑈𝑢𝑓). Nevertheless, a clear
relationship between the fraction of packed bed (𝐻𝑝/𝐻) and the solids loading cannot be obtained from these plots. It is concluded that the packed bed height (𝐻𝑝) decreases
constantly as the superficial gas velocity (𝑈𝐺) increases. More and more particles are gradually fluidized and suspended in the downer.
Uuf Uuf 0 2 4 6 8 10 12 14 16
0 1 2 3 4
Fluidiz ation Ra tio ( H f /H 0 )
UG-Uif(mm/s)
0 0.2 0.4 0.6 0.8 1
0 0 . 5 1 1 . 5 2 2 . 5 3 3 . 5
Fr act ion of P ack ed Be d (H p /H)
UG-Uif(mm/s)
(a)
5% 10% 15% 20% 25% Solids Loading: 0 0.2 0.4 0.6 0.8 10 0 . 4 0 . 8 1 . 2 1 . 6 2
Fr act ion of P ack ed Be d (H p /H)
UG-Uif(mm/s)
Figure 2.10 Fraction of packed bed (𝐻𝑝/𝐻) against the excess superficial gas velocity (𝑈𝐺 − 𝑈𝑖𝑓) at different solids loadings for particles with a density of (a) 904 kg/m3, (b)
930 kg/m3, and (c) 950 kg/m3 in the main system.
In order to compare the effect of particle properties, the bed expansion ratio (𝐻/𝐻0) versus the excess superficial gas velocity (𝑈𝐺 − 𝑈𝑖𝑓) is plotted on the same figure at 5%, 10%, and 15% solids loading (Figure 2.11). Considering the particles with the same
diameter, the bed expansion ratio (𝐻/𝐻0) of particles with a density of 930 kg/m3 is larger than particles with a density of 904 kg/m3 at the same solids loading. Hence,
heavier particles would have larger bed expansion ratio (𝐻/𝐻0). This result proves that
particles with a higher density is easier to fluidize and more sensitive to changes in the
superficial gas velocity (𝑈𝐺). 0
0.2 0.4 0.6 0.8 1
0 0 . 5 1 1 . 5 2 2 . 5
Fr
act
ion
of P
ack
ed
Be
d (H
p
/H)
UG-Uif(mm/s)
(c)
Figure 2.11 Bed expansion ratio (𝐻/𝐻0) against the excess superficial gas velocity (𝑈𝐺 − 𝑈𝑖𝑓) for three types of particles at (a) 5% solids loading and (b) 10% solids
loading in the main system.
0 2 4 6 8 10 12 14 16
0 1 2 3 4 5 6
Bed Expansio n Ra tio (H/H 0 )
UG-Uif(mm/s)
(a)
904 kg/m^3 930 kg/m^3 950 kg/m^3 Particle Density: 0 1 2 3 4 5 6 7 80 0 . 5 1 1 . 5 2 2 . 5 3 3 . 5 4
Bed Expansio n Ra tio (H/H 0 )
UG-Uif(mm/s)
(b)
904 kg/m^3
930 kg/m^3
The above findings on the bed expansion confirm the development of inverse fluidization
regimes. At a low gas flowrate, the sum of the drag force and the gravitational force
acting on the particles cannot exceed the net buoyancy force. Thus, the bed expansion
ratio (𝐻/𝐻0), the fluidization ratio (𝐻𝑓/𝐻0), and the fraction of packed bed (𝐻𝑝/𝐻) remain unchanged. When the initial fluidization velocity (𝑈𝑖𝑓) is reached, the fluidized bed height increases and the packed bed height decreases progressively until fluidization
is achieved throughout the entire bed. In this case, the fluidized bed is considered
uniform.
In addition, a linear relationship was found between the logarithms of the bed expansion
ratio (𝐻/𝐻0) and the excess superficial gas velocity (𝑈𝐺 − 𝑈𝑖𝑓) before the uniform fluidization. As shown in the Figure 2.12, the coefficient of determination (𝑅2) for each line is greater than 0.95, indicating that the trend lines fit the data series well. Table 2.2
shows that the slope of the trend line decreases with increasing solids loading. However,
since the bed expansion was influenced by particle properties and solids loading, it is
difficult to find a single equation to express the linear relationship. Modelling would be
necessary to acquire the exact expression, but the logarithms provide a useful hint for
future work.
Table 2.2 Summary of linear relationship between the logarithms of bed expansion ratio
(log10(𝐻/𝐻0)) (y) and excess superficial gas velocity (𝑈𝐺− 𝑈𝑖𝑓) (x)
Particle Density (kg/m3)
Solids Loading Linear Equation R2
904
5% 𝑦 = 0.50𝑥 0.97
10% 𝑦 = 0.31𝑥 0.98
15% 𝑦 = 0.24𝑥 0.96
930
5% 𝑦 = 0.66𝑥 0.98
10% 𝑦 = 0.50𝑥 0.99
Figure 2.12 Logarithms of bed expansion ratio (𝐻/𝐻0) against the excess superficial gas velocity (𝑈𝐺 − 𝑈𝑖𝑓) at 5%, 10%, and 15% solids loadings for particles with a density of
(a) 904 kg/m3 and (b) 930 kg/m3 in the main system.
y = 0.50x R² = 0.97
y = 0.31x R² = 0.98
y = 0.24x R² = 0.96
0 0.2 0.4 0.6 0.8 1 1.2 1.4
0 0 . 5 1 1 . 5 2 2 . 5 3 3 . 5
log 10 (H /H 0 )
UG-Uif(mm/s)
(a)
5% 10% 15% Solids Loading:
y = 0.66x
R² = 0.98 y = 0.50x
R² = 0.99
y = 0.43x R² = 0.99
0 0.2 0.4 0.6 0.8 1 1.2
0 1 2
log 10 (H /H 0 )
UG-Uif(mm/s)
(b)
2.4
The Alternative System
2.4.1
The Inverse Fluidization Regimes
In the GDFB installed with a meshed-baffle, five types of flow pattern can be observed as
the increase of superficial gas velocity (𝑈𝐺) (Figure 2.13). When the gas flowrate is low, particles suspend at the top of the downer without any movement since the density of
particles is lower than that of water. This is called the packed bed. When the superficial
gas velocity (𝑈𝐺) reaches the initial fluidization velocity (𝑈𝑖𝑓), particles in the lowest
layer start to detach from the packed bed. As the slight increase of gas velocity, some
particles remain in the packed bed while the other particles form a fluidized bed. This
state refers to the semi-fluidized bed. Then, the packed bed disappears and the
fully-fluidized bed is obtained when the gas velocity is above the uniform fluidization velocity
(𝑈𝑢𝑓). By further increasing the gas velocity, the fluidized bed moves downward as a
whole and the upper boundary of the bed does not coincide with the water level. This
pattern is named as the shifted bed, which is never observed in a solid-baffle system.
Finally, when the transition velocity (𝑈𝑡𝑟) is fulfilled, the fluidized bed will transform from the conventional regime to the circulating regime. In this case, particles occupy the
entire downer and form a continuous flow around the baffle. This paper focuses on the
Figure 2.13 The inverse fluidization regimes in the alternative system
2.4.2
Initial and Uniform Fluidization Velocities
The initial fluidization velocity (𝑈𝑖𝑓) is plotted against the solids loading for the systems with a solid baffle and a meshed baffle, respectively (Figure 2.14). Both sets of
experiments used particles with a density of 930 kg/m3. When the baffle is with mesh, the
solids loading has almost no effect on the initial fluidization velocity (𝑈𝑖𝑓). In contrast, the initial fluidization velocity (𝑈𝑖𝑓) is proportional to the solids loading for a solid-baffle system. As only the riser has bubbles rising upward, the pressure in the riser is lower than
that in the downer. Due to this pressure gradient, some liquid passes through the mesh
from the downer to the riser, creating a continuous liquid flow through the baffle. If a
plenty of particles are packed at the top of the downer, this liquid flow can disturb the
stationary state and help to fluidize the particles. Thus, the solids loading does not play an
important role since the lower layers of the packed bed would be influenced by the liquid
Figure 2.14 Initial fluidization velocity (𝑈𝑖𝑓) versus solids loading for particles with a density of 930 kg/m3 in the main system with solid baffle and in the alternative system
with a meshed baffle.
The uniform fluidization velocity (𝑈𝑢𝑓) is plotted against the solids loading for the systems with a solid baffle and a meshed baffle, respectively (Figure 2.15). Unlike the
initial fluidization velocity (𝑈𝑖𝑓), the uniform fluidization velocity (𝑈𝑢𝑓) increases with the increase of solids loading for both the meshed-baffle system and the solid-baffle
system. Since the initial fluidization velocity (𝑈𝑖𝑓) refers to the state when the lowest layer of particles in the packed bed begin to move downward, the liquid flow crossing the
mesh may help disturb the stationary state and obtain the onset of fluidization. In
contrast, uniform fluidization is satisfied when particles at the top of the packed bed are
fluidized, which is mainly driven by the liquid stream from the top of the riser. Thus, the
uniform fluidization velocity (𝑈𝑢𝑓) in the meshed-baffle system demonstrates the same
increasing trend as that in the solid-baffle system. The slight larger magnitude in the
alternative system may be caused by the loss of some liquid flowrate through the mesh.
R² = 0.9931
R² = 0.0833
0 1 2 3 4 5
0 5 1 0 1 5 2 0 2 5 3 0
Initial Fluidiz
ation V
elocity
(m
m/
s)
Solids Loading (%)
Solid baffle
Figure 2.15 Uniform fluidization velocity (𝑈𝑢𝑓) versus solids loading for particles with a density of 930 kg/m3 in the main system with solid baffle and in the alternative system
with a meshed baffle.
2.4.3
Bed Expansion
In order to quantify the influences of mesh opening of the baffle, another set of
experiments adopting a meshed baffle instead of a solid baffle was also conducted using
the particles with a density of 930 kg/m3. The bed expansion ratio (𝐻/𝐻0), fluidization ratio (𝐻𝑓/𝐻0), and fraction of packed bed (𝐻𝑝/𝐻) are plotted against the excess
superficial gas velocity (𝑈𝐺− 𝑈𝑖𝑓) at five solids loadings (Figure 2.16, Figure 2.17, and Figure 2.18). It can be seen that the pattern of bed expansion with a meshed baffle is
quite different from that with a solid baffle. The bed expansion ratio (𝐻/𝐻0) and the
fluidization ratio (𝐻𝑓/𝐻0) do not follow a constant increase or decrease. As the superficial gas velocity (𝑈𝐺) increases, the two ratios increase before reaching the uniform fluidization velocity (𝑈𝑢𝑓), but they decrease slightly after the uniform
fluidization velocity (𝑈𝑢𝑓). Meanwhile, the fraction of packed bed (𝐻𝑝/𝐻) decreases with 0
1 2 3 4 5 6
0 5 1 0 1 5 2 0 2 5 3 0
Unif
orm Fluidiz
ation V
elocity
(m
m/
s)
Solids Loading (%)
Solid baffle
increasing superficial gas velocity (𝑈𝐺) until the packed bed no longer exists on the top of the downer.
Figure 2.16 Bed expansion ratio (𝐻/𝐻0) against the excess superficial gas velocity (𝑈𝐺 − 𝑈𝑖𝑓) at different solids loadings for particles with a density of 930 kg/m3 in the
alternative system.
Uuf
Uuf
Uuf
Uuf Uuf
0 2 4 6 8 10 12
0 1 2 3 4 5 6
Be
d Ex
pansion
Ra
tio
(H
/H
0
)
UG-Uif(mm/s)
Figure 2.17 Fluidization ratio (𝐻𝑓/𝐻0) against the excess superficial gas velocity (𝑈𝐺 − 𝑈𝑖𝑓) at different solids loadings for particles with 930 kg/m3 in the alternative system.
Figure 2.18 Fraction of packed bed (𝐻𝑝/𝐻) against excess superficial gas velocity (𝑈𝐺− 𝑈𝑖𝑓) at different solids loadings for particles with 930 kg/m3 in the alternative system.
Uuf Uuf Uuf Uuf Uuf 0 2 4 6 8 10 12
0 1 2 3 4 5 6
Fluidiz ation Ra tio ( H f /H 0 )
UG-Uif(mm/s)
5% 10% 15% 20% 25% Solids Loading: 0 0.2 0.4 0.6 0.8 1
0 0 . 5 1 1 . 5 2 2 . 5
Fr act ion of P ack ed Be d (H p /H)
UG-Uif(mm/s)
The fluidization regimes can be applied to explain the above results. After the onset of
fluidization is achieved, more and more particles are fluidized and the packed bed height
decreases, which causes the increase of the total bed height. As the superficial gas
velocity (𝑈𝐺) further increases, particles are completely fluidized and then the entire bed would move downward. When the particles transform from the fully-fluidized bed to the
shifted bed, the bed may be compressed, resulting in the decrease of the total bed height.
2.5
Conclusions
The fluidization regimes and bed expansion of the gas-driven inverse liquid-solid
fluidized bed (GDFB) were studied experimentally in this article. To obtain the stable
inverse fluidized bed in this reactor, a solid baffle is essential to control the orderly liquid
flow. In such a system, as the gas flowrate increases, the four fluidization regimes include
the packed bed, semi-fluidized bed, fully-fluidized bed, and circulating bed. The
superficial gas velocities (𝑈𝐺) required for the onset of fluidization and uniform
fluidization are higher for larger solids loading and lower particle density. Moreover, the
fluidized bed height and total bed height increase with the increasing gas flowrate, but the
packed bed height decreases. The rate of bed expansion was found to be faster for heavier
particles and for smaller solids loading, meaning that achieving fluidization is easier
under these conditions. In brief, the bed expansion patterns have verified the observed
fluidization regimes. This lab-scale GDFB requires low gas flowrates to operate, thus it is
suitable for scale-up and applying to biochemical processes requiring low turbulence or
Nomenclature
Ar Archimedes number defined by 𝑑𝑃3𝑔(𝜌𝐿− 𝜌𝑃)𝜌𝐿/𝜇𝐿2
𝐶𝐷 Drag coefficient
𝑑𝑃 Particle diameter (mm)
𝑔 Gravitational acceleration on earth (m/s2)
𝐻0 Initial bed height (cm)
𝐻 Total bed height (cm)
𝐻𝑝 Packed bed height (cm)
𝐻/𝐻0 Bed expansion ratio
𝐻𝑓/𝐻0 Fluidization ratio
𝐻𝑝/𝐻 Fraction of packed bed
ID Inner diameter of the column (cm)
𝑈𝐺 Superficial gas velocity (cm/s)
𝑈𝑖𝑓 Initial fluidization velocity (cm/s)
𝑈𝑡 Terminal velocity of particles (cm/s)
𝑈𝑡𝑟 Transition velocity (cm/s)
𝑈𝑢𝑓 Uniform fluidization velocity (cm/s)
Abbreviations
GDFB Gas-driven inverse liquid-solid fluidized bed
OFP Optical fiber probe
PE Polyethylene
PP Polypropylene
Greek letters
𝜇𝐿 Liquid viscosity being 1.002 × 10⁻³ Pa.s at 20℃ (Pa.s)
𝜌𝐿 Liquid density (kg/m3)
𝜌𝑃 Particle density (kg/m3)
𝜙 Particle sphericity
Subscripts
0 Initial packed bed
f Fluidized bed
G Gas
if Initial fluidization
L Liquid
P Particle
tr Transition
References
Fan, L., Muroyama, K., & Chern, S.-H. (1982). Hydrodynamic Characteristics of Inverse
Fluidization in Liquid-Solid and Gas-Liquid-Solid Systems. The Chemical
Engineering Journal, 24, 143–150.
Femin Bendict, R. J., Kumaresan, G., & Velan, M. (1998). Bed expansion and pressure
drop studies in a liquid-solid inverse fluidised bed reactor. Bioprocess Engineering,
19, 137–142.
Karamanev, D. G. (1996). Equations for calculation of the terminal velocity and drag
coefficient of solids spheres and gas bubbles. Chemical Engineering
Communications, 147, 75–84.
Karamanev, D. G., & Nikolov, L. N. (1992). Bed Expansion of Liquid-Solid Inverse
Fluidization. AIChE Journal, 38(12), 1916–1922.
Nikolov, L., & Karamanev, D. (1987). Experimental Study of the Inverse Fluidized Bed
Biofilm Reactor. The Canadian Journal of Chemical Engineering, 65(April 1987),
214–217.
Renganathan, T., & Krishnaiah, K. (2003). Prediction of Minimum Fluidization Velocity
in Two and Three Phase Inverse Fluidized Beds. The Canadian Journal of Chemical
Engineering, 81(August), 853–860.
Renganathan, T., & Krishnaiah, K. (2004). Liquid phase mixing in 2-phase liquid-solid
inverse fluidized bed. Chemical Engineering Journal, 98(August 2003), 213–218.
http://doi.org/10.1016/j.cej.2003.08.001
Sabarunisha Begum, S., & Radha, K. V. (2014). Hydrodynamic behavior of inverse
fluidized bed biofilm reactor for phenol biodegradation using Pseudomonas
fluorescens. Korean Journal of Chemical Engineering, 31(3), 436–445.
http://doi.org/10.1007/s11814-013-0260-z
Fluidized Bed.
Ulaganathan, N., & Krishnaiah, K. (1996). Hydrodynamic characteristics of two-phase
inverse fluidized bed. Bioprocess Engineering, 15, 159–164.
Vijaya Lakshmi, A. C., Balamurugan, M., Sivakumar, M., Newton Samuel, T., & Velan,
M. (2000). Minimum fluidization velocity and friction factor in a liquid-solid
Chapter 3
3
Gas-Driven Inverse Liquid-Solid Fluidized Bed with
Circulation
3.1
Introduction
Traditionally, when the density of solid particles is higher than that of the fluid,
fluidization is realized by a gas or liquid flowing opposite to the direction of gravity. In
contrast, particles with a lower density than the fluid (usually liquid) are fluidized by the
downward liquid stream countering the net buoyancy force of the particles. This kind of
system is named as the inverse fluidization (Fan et al., 1982). It has been proved that
inverse fluidized beds have many advantages over the upward fluidized beds. For
instance, inverse fluidization provides high mass transfer rate (Nikolov & Karamanev,
1987), easy re-fluidization after breakdown (Renganathan & Krishnaiah, 2003), and
efficient control of the process (Renganathan & Krishnaiah, 2004). Thus, it has been
applied to various biological processes, including phenol biodegradation (Sabarunisha
Begum & Radha, 2014) and ferrous iron oxidation (Nikolov & Karamanev, 1987).
Particularly, inverse fluidization allows the control of biofilm thickness within a narrow
range in biological wastewater treatment (Nikolov & Karamanev, 1987).
On the other hand, circulating fluidized beds have several advantages, comparing to
conventional fluidized beds. For example, back-mixing of phases is significantly reduced
and the interfacial contact efficiency is increased (Zhu et al., 2000). As a result, upward
liquid-solid circulating fluidized beds (LSCFB) have been applied to some industrial
fields. For instance, a pilot-scale LSCFB was applied to remove biological nutrient from
municipal wastewater (Chowdhury et al., 2009). The continuous recovery of proteins
from cheese whey was achieved by adopting the LSCFB in the ion exchange system (Lan
et al., 2000). Moreover, the LSCFB was introduced to realize the enzymatic
polymerization of phenol (Trivedi et al., 2006) and.to produce lactic acid by extractive
fermentation (Patel et al., 2008). In terms of hydrodynamic behaviors in the LSCFB, the
radial distributions of solids holdup and liquid velocity were found to be non-uniform
al., 1997). Then, Zheng et al. studied the uniformity of axial particle distribution, critical
transition velocity, and conditions for stable operation (Zheng et al., 1999). Zheng and
Zhu also defined the onset velocity for the circulating fluidization regime, which depends
on particles properties instead of operating conditions (Zheng & Zhu, 2001).
Recently, Huang and Zhu developed the Gas-Driven Inverse Liquid-Solid Fluidized Bed
(GDILSFB or GDFB) (Huang & Zhu, 2017). The column is composed of a downer and a
riser, vertically separated by a baffle (Figure 3.1). Inverse fluidization is driven by a gas
stream from the bottom of the riser instead of a continuous liquid flow. When the gas
flowrate is adequate, light particles are fluidized in the downer. By further increasing the
gas flowrate, particles can cross the bottom of the baffle and enter the riser. If particles
are able to maintain a continuous flow between the riser and the downer, the conventional
regime is considered to be transformed to the circulating regime. To benefit the future
applications of this reactor, some hydrodynamic behaviors of particles circulating in the
GDFB have been investigated. Specifically, this study focuses on the transition velocity
and average particle velocity and their relationship with the superficial gas velocity,
solids loading, particle properties, and baffle structure. The aim is to discover the
optimum operating conditions of this reactor with low energy costs.
3.2
Materials and Methods
3.2.1
Experimental Apparatus and Procedures
Figure 3.2 shows a sketch of the gas-driven inverse liquid-solid fluidized bed (GDFB)
and its cross-sectional view. The top of the column is open to the air and the inner
diameter (ID) of the column is 12.5 cm. The column is divided into a riser and a downer
by a baffle with a length of 270 cm and a width of 10 cm. The riser refers to the vertical
section having a smaller cross-sectional area and the downer is the one with a larger area.
As shown in the cross section of the column, end points of the ID are point A and point
C, while the baffle crosses the ID perpendicularly at point B. The length of line segment
BC is 4 times that of line segment AB. Thus, the area of the downer is about one-sixth of
the area of the downer. The purpose of designing these two different areas is to achieve
fluidization with a relatively low energy cost. For a given gas flowrate, a smaller area of
the riser results in a higher superficial gas velocity (𝑈𝐺) and more liquid can be entrained by a smaller gas amount. Nevertheless, the riser cannot be too small that the total liquid
amount constraint the liquid flow entering the downer. Therefore, in this preliminary
design, the areas of the downer and riser were selected to have a six times difference.
The liquid and gas in this research are tap water and air, respectively. Water is pumped
into the column from a tank through a liquid inlet valve at the bottom of the GDFB.
Meanwhile, an outlet valve allows water to be discharged back to the tank. Air is
introduced into the riser from air supply via the gas distributor and a calibrated rotameter
controls the flowrate. Bubbles coming out of the gas distributor move upward in the riser,
which results in a liquid stream flowing upward. The gas reaching the top of the riser is
released into the atmosphere, but the liquid flows downward in the downer because of the
gravity. Particles would be carried downward when the liquid flowrate satisfies the
condition for the onset of fluidization. Additionally, measuring devices, such as the
optical fiber probe, can be inserted into the column through a few holes on the wall at
FI
Rotameter
Air
Gas Distributor
Baffle
P-18
Water Tank OFP
Computer Water Level
A B C
Cross Section
Figure 3.2 Schematic drawing of the GDFB and the cross section of column
Three variables in this research are particle properties (size, shape, and density), solids
loading, and superficial gas velocity (𝑈𝐺). Figure 3.3 is a photo of light particles used in
the experiments and their properties are shown in the Table 3.1. Vernier caliper was used
to measure the particle size and average equivalent diameter of 50 particles was adopted.
For free rising particles, the terminal velocity is obtained using the following equations:
𝑈𝑡= √
4𝑔𝑑𝑃(𝜌𝐿− 𝜌𝑃) 3𝜌𝐿𝐶𝐷