O R I G I N A L R E S E A R C H
Novel Characterization Of Thermal Temporal
Summation Response By Analysis Of Continuous
Pain Vs Time Curves And Exploratory Modeling
This article was published in the following Dove Press journal: Journal of Pain Research
Jiang-Ti Kong 1
Epifanio Bagarinao2
Richard A Olshen3
Sean Mackey1
1Department Of Anesthesiology,
Perioperative And Pain Medicine, Stanford University School of Medicine,
Stanford, CA, USA;2Brain And Mind
Research Center, Nagoya University,
Nagoya, Japan;3Department of
Biomedical Data Science, School of Medicine, Stanford University, Stanford, CA, USA
Background:Temporal summation (TS) refers to the increased perception of pain with repetitive noxious stimuli. While thermal TS is generally considered a behavioral correlate of spinal windup, noxious heat pulses also trigger additional sensory processes which were modeled in this study. Methods: Nineteen healthy volunteers (9 females, mean age 29.2, SD 10.5) underwent two identical TS experiments, spaced a week apart. The TS paradigm consisted of 10 identical heat pulses with individualized temperatures at the thenar eminence (0.5Hz). We extracted 3 features from continuous TS response curves: Lag, time tofirst feel pain; Slope, the rate of pain increase between thefirst and most painful heat pulse; and Delta, the maximum drop in pain after peak pain is reached. We then examined the within-individual stability of these features, followed by the Pearson’s correlations among these features and between the features and negative affect. Results:All 3 features were stable over 1 week. Lag and Delta were negatively correlated (r=−0.5,p= 0.042). Slope did not correlate with Lag or Delta, but strongly correlated with a traditional TS measure, first pulse pain and peak pain difference (r = 0.91, p < 0.0001). Negative affects such as trait and state anxiety were negatively correlated with baseline (r=−0.49,p= 0.031) and peak stimulating temperature (r=−0.48,p= 0.039), respectively, suggesting an association between anxiety and greater pain sensitivity.
Conclusion: We were able to decouple spinal windup from other perceptual processes gener-ated by phasic thermal TS paradigms and demonstrate temporal stability of these curve features. These curve features may help better characterize the complex sensory response to noxious heat pulses and serve as biomarkers to profile patients with chronic pain.
Keywords:thermal, temporal summation, windup, anxiety, depression, test–retest stability
Plain Language Summary
Temporal summation refers to the increased perception of pain in response to a train of identical painful stimuli, such as heat pulses, at frequencies≥ 0.3Hz. Temporal summation has been traditionally considered a behavioral correlate to windup of spinal secondary neurons.
However, in addition to windup, noxious heat pulses also trigger other processes such as A-delta activation, habituation and/or descending inhibition. These additional processes may be responsible for the large between-individual variability in TS but have not been extensively studied.
In this exploratory study, we generated a continuous pain response curve and selected key features from the curve to model windup and possibly peripheral activation and habituation/inhibition. Our features were stable over time. Furthermore, the feature reflecting windup was highly correlated with traditional windup measures, independent from the other features and from heat pulse temperatures. We believe that our method of quantifying TS provides a more precise measure of windup by removing and characterizing influence from Correspondence: Jiang-Ti Kong
Department of Anesthesiology,
Perioperative and Pain Medicine, Stanford University School Of Medicine, 1070 Arastradero Road, Suite 200, Palo Alto, CA 94304, USA
Tel +1 650-723-1235 Fax +1 650-725-9642 Email [email protected]
Journal of Pain Research
Dove
press
open access to scientific and medical research
Open Access Full Text Article
Journal of Pain Research downloaded from https://www.dovepress.com/ by 118.70.13.36 on 24-Aug-2020
other sensory processes. Together, these curve features may be used as biomarkers of pain sensitivity.
Introduction
Temporal summation (TS) refers to the increased percep-tion of pain with repeated delivery of identical noxious stimuli.1,2It is often considered a behavioral correlate of windup, where the spinal secondary neuron increases its output in response to recurring C-fiber stimulation at fre-quencies above 0.3Hz.3,4 Many noxious stimuli generate TS, including thermal, electrical, and punctate pressure.5 The current study focuses on thermal TS, which typically involves the delivery of a set of identical, noxious heat pulses to the body via a thermode. Thermal TS can be delivered in a standardized fashion, is generally well tol-erated, and has been widely studied.4,6–12
Although thermal TS is often used to approximate central pain facilitation, problems with methodology have limited its application: one of the most significant is the lack of standar-dization in quantifying the magnitude of TS.13,14Most current methods acquire data by using the subject to provide a single pain rating at the end of each heat pulse, but there are many ways to compute TS using these ratings: taking the difference, the slope, or the area under the“curve,”between thefirst and various later pain ratings,6,7,11or simply using the pain rating of the 5thpulse.15
Two problems exist with the traditional, varied approaches to describing TS. First, taking a single pain rating by a verbal cue at the end of each pulse artificially subjects the timing of the pain report to the timing of the verbal cue, resulting in less than optimal sampling resolu-tion. Second, the various calculations of TS magnitude are inconsistent. For example, different relationships to factors such as anxiety7,15 and catastrophizing16versus heat pain threshold17 were observed, depending on which measure was selected. While anxiety and catastrophizing are cen-tral, heat pain threshold is generally considered a periph-eral property.18–20Therefore, TS calculated by the various current methods likely reflects various contributions from both peripheral and central sensory processes.
Noxious heat pulses generate a multitude of sensory processes in addition to spinal windup, and there has been little effort to elucidate and isolate these pro-cesses from the characterization of thermal windup. To address this gap, we conducted our study in the following 3 steps. First, we expanded TS data collec-tion from single pain ratings to a continuous curve by
asking our participants to rate their pain continuously. Second, based on existing pain theories21,22 which broadly categorize pain perception into peripheral noci-ceptor activation and central pain modulation that include both ascending (which TS is a part of) and descending processes,23,24 we isolated 3 features of our continuous TS curves to represent peripheral noci-ceptor activation (i),19,25–27 windup (ii), and general inhibitory processes such as habituation28,29 and con-ditioned pain modulation (iii),24,30 respective. Finally, recognizing our hypothesis, though based on current pain research, might be an over-simplified interpreta-tion of reality, we examined the validity of our model by evaluating (a) the temporal stability of the features; (b) the relationship among the features and between these features and participant characteristics including demographics and psychological profiles, as well as classical measures of TS such as the difference in the pain rating between the first and most painful heat pulse.
Methods
Overview
This report presents a secondary analysis of data from a previously published study.14 The original study was approved by the Stanford University institutional review board and was conducted in accordance with the Declaration of Helsinki. All participants provided written informed consent prior to participation in the study. The 2 objectives of the previous study were: (A) to improve the response to thermal TS paradigms by individually adjusting the baseline and peak temperatures of the heat pulses to achieve a moderate amount of TS (50 ± 20 VAS between the pain ratings of the first pulse and peak pain); (B) to assess the test–retest stability of thermal TS within the same day and over 1 week. Participants generated continuous TS response curves by providing a real-time rating of the second pain, although the magnitude of TS in that study was computed using a conventional method (maximal pain minus pain rating from thefirst pulse).11
In the current study, we used the same continuous TS curves, but extracted curve features representing complex processes triggered by noxious heat pulses, evaluated the within-individual temporal stability of these curve fea-tures, and explored the potential physiologic meaning of these features.
Journal of Pain Research downloaded from https://www.dovepress.com/ by 118.70.13.36 on 24-Aug-2020
Participants And Behavioral Questionnaires
Healthy adults, free of major psychiatric or medical condi-tions, between the ages of 18 and 50, and did not have ongoing acute or chronic pain, were recruited. Mean age was 29.2 (SD 10.5) and 47% were female. After providing informed consent, each participant filled out a battery of questionnaires including: demographics, Beck’s Depression Inventory (BDI),31 Fear of Pain Questionnaire (FPQ),32 anxiety sensitivity index (ASI),33 Spielberger's state-trait anxiety inventory (STAI)34 including y1s (state anxiety) and y2t (trait anxiety), and sensitivity hypersensitivity scale (SHS).35
Study Timeline
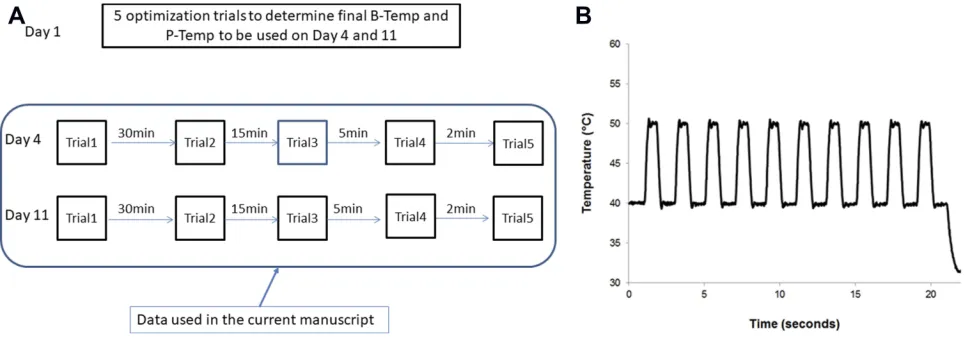
After completion of the questionnaires, each participant underwent individual optimization of baseline and peak temperatures of the heat pulses to achieve an estimated TS (calculated by subtracting pain from the first heat pulse from that of the peak pain) between 30 and 70 on a VAS scale of 0–100, on day 1.14Then, on day 4 and day 11, five identical TS trials using the optimized temperatures from day 1 were administered between 3 and 120min apart. The five trials from day 4 and five from day 11 were used for the analyses in this manu-script (Figure 1A).
Summary Of Thermal TS Paradigm
Except for the individualized temperatures, heat pulses from all TS trials have the following identical parameters: number of pulses = 10; peak-to-peak duration = 2s (fre-quency = 0.5Hz); duration of peak temperature = 0.5s; ramp up and down rate = 40°C/s. (Figure 1B) Heat pulses werefirst administered to the thenar eminence of the
non-dominant hand, then alternating hand at each subsequent trial. We used a constant contact thermode, contact heat-evoked potential stimulator (CHEPS) (diameter = 2.9cm) from the Pathway machine (Medoc, Ramat Ishay, Israel) was used for all TS trials.
Training For Continuous Pain Rating During TS Paradigms
Each participant was asked to rate their pain continuously using a continuous output VAS (COVAS) box, which is a standard accessory to the Pathway machine. The COVAS allows real-time rating of pain by the visual analog scale (0 to 100, where 0 means“no pain”and 100 means“worst pain imaginable”).
We explained to each participant that second pain was often felt 1–2s after the delivery of the heat pulse and, that rather than being a sharp sensation, it tended to be dull, throbbing, and burning. The participants were instructed to only rate this pain and to ignore the first pain—the sharp sensation occurring immedi-ately with each pulse, and the ramping up and down between the pulses. Finally, we instructed the partici-pants that second pain may gradually build up and increase or decrease, and that it may linger for a short while before disappearing. The participants were instructed to rate their experience of the second pain continuously, including the build-up, lingering, and end point throughout each TS trial.
After the participants were shown the CHEPS ther-mode and COVAS and educated about the nature of sec-ond pain, they then underwent at least 2 training trials to become comfortable both with experiencing the heat pulses and rating the second pain continuously.14,36
Figure 1Experimental Design. (A) Study timeline. (B) Phasic thermal temporal summation paradigm.
Journal of Pain Research downloaded from https://www.dovepress.com/ by 118.70.13.36 on 24-Aug-2020
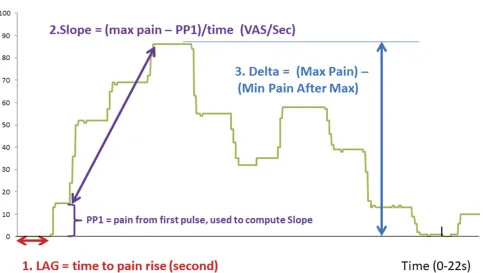
Rationale And Extraction Of Key Curve Features First, based on existing knowledge on the mechanisms of pain perception37,38and windup,3,4,39we hypothesized that noxious heat pulses trigger 3 general processes: (i) peripheral nociception, i.e., activation of A-delta and C fibers,18,25,27 (ii) windup taking place at the spinal dorsal horn,4,39 (iii) inhibitory processes such as peripheral habituation29 and/or conditioned pain modulation30,40in response to per-ipheral activation. Second, based on the above hypothesis, we selected curve features that may potentially reflect these 3 processes. For example, the time it takes tofirst perceive pain is likely related to peripheral sensitivity (i);18,27the slope of increase in pain perception between thefirst and most painful pulse most likely represents windup (ii);7,17and the decrease in pain perception after maximum pain likely is related to some kind of inhibitory process (iii).13,28,29Lastly, recogniz-ing (a) many features can be extracted from the TS curve and (b) more than one feature can relate to each of the proposed sensory processes, we selected three features which best describe the between-individual variability of the curve shapes, and are relatively easy to compute, as described below.
AsFigure 2shows, thefirst feature is Lag, representing the time it takes tofirst perceive pain from the heat pulses.
To minimize the influence of noise, we selected a thresh-old of 5 VAS (over 100) rather than zero. Because Lag represents the beginning of pain perception to noxious heat, we hypothesize that Lag would be a surrogate of peripheral nociception, i.e., c-fiber activation.
The second feature is Slope, defined as the maximum pain rating (Pmax) subtracted by the pain rating from the first heat pulse (PP1) divided by time. Previous investiga-tors have used slope (fitted to discrete pain ratings of each pulse) to define TS because it closely approximates the sensitization to identical series of stimuli.7,11,13,17,41 However, the choices of the starting and ending points for the slope vary. For the starting point of Slope, we picked a point of around 4s on the x-axis, which corre-sponds to the approximate time when the second pain from the first pulse is perceived.8,14 Evidence suggests that peripheral factors strongly influence the rating of the first pulse;4,42–44 therefore, we minimized the peripheral con-tribution to our calculation of Slope by subtracting the pain rating of the first pulse (PP1) from the maximum pain rating. We selected the maximum pain rating as the endpoint in our Slope calculation because it represents the maximum augmentation in pain perception in response to repetitive heat stimuli.6,45
Figure 2Selection of Key Features from an example TS response curve.
Journal of Pain Research downloaded from https://www.dovepress.com/ by 118.70.13.36 on 24-Aug-2020
Finally, the third feature is Delta, defined as the max-imum drop in pain rating after reaching peak pain. Previous authors have suggested the decrease of pain perception may relate to descending inhibitory processes triggered by noxious heat pulses.13,46
Once we determined the choice of the key curve fea-tures, we extracted these features from all 10 TS trials from day 4 and day 11, using MATLAB, version 8.2 (Mathworks, Natick, MA, USA). The mean and standard deviation of these features were then calculated.
Analysis Of Temporal Stability Within Individual We were specifically interested in the stability of the curve features over the course of 1 week. For each participant, we used a permutation test to assess the temporal stability of the extracted features without making distributional assumptions of the features. Our null hypothesis is that the mean value of the features on day 4 is equal to that on day 11. To do test this hypothesis, we randomly divide then 10 observations into two groups: 5 labeled day 4 and 5 labeled day 11, giving 252 possible ways of division (10 choose 5). For each division, we computed the mean values for each day and estimated the mean difference between day 4 and day 11 for each feature. We hypothesized that if there were no difference between days, then it should not matter which 5 of the 10 measure-ments we selected and designated as“day 4 values.”If the
“un-permuted”(that is to say, real) data lead to a difference in absolute value between days that is kthlargest among the 252, then an estimate of the“p-value”for the null hypothesis is given by k/252 (by“p-value”we mean“attained significance level,”that is, the chance of seeing a difference as large or larger than what was observed by random chance only, given there is no difference).
Assessment Of Curve Features Via Correlation Analysis
Variables Tested
We selected Lag, Slope, and Delta to approximate periph-eral nociception, spinal windup, and descending inhibition/ habituation, respectively. We explored the relationship among these curve features, and between them and indivi-dual characteristics such as demographics and psychologi-cal traits. Because we individualized the baseline and peak stimulating temperatures of the heat pulses to generate moderate TS in all individuals, we also included these individualized temperatures in the correlation analysis.
Computing Pearson Correlations And Their Significance Values With Permutation Statistics
First, we computed the correlations outlined above using
the mean features from all 10 observations for each parti-cipant. Second, because the distributions of the features, as well as the participant characteristics are not Gaussian, we used permutation statistics to compute the p-value of the correlations, in a fashion similar to the permutation method described earlier to assess the temporal stability of the curve features. The details of our methods are outlined below.
Step 1: Compute p-values by permuting the features among the 19 participants. Specifically, there are a total of (19!),3approximately 1.8 × 1051ways to shuffle (permute) the 3 features among the 19 representative curves. For each shuffle, a Pearson’s correlation coefficient, r, was computed. The correlation of the non-permuted features was also com-puted and ranked as the kth highest among the permuted correlations. The null hypothesis is that there is no correla-tion, i.e.,r= 0. The significance value of the null hypothesis is then k/1051However, given the large number of possible shuffles possible, we chose to estimate the p-value using Matlab to simulate 10,000 random possible shuffles and then ranked the non-permutated correlation as k’th highest among the 10,000 permuted correlations. This gave us an estimated p-value of k’/10,000.
Readers will note that it would have been enough tofix a randomly chosen feature and to permute the other 2. However (19!)2 is also an enormous number. We would then have had to subsample permutations. Our permuting all features has obvious appeal, anyway.
Step 2: Practical restraints on permutation statistics. Not all random permutations are realizable. For example, if a participant takes a long time to first feel pain (long Lag) and reports a slow pain rise (low Slope), then a high Delta would not be possible. We used the following for-mulas to screen the permutations generated in step 2 above and retained only those that are physically possible. We needed to reject ~30% of our permutations based on the rules below.
Maximum remaining time = 22 – (time of PP1) = 22–3.9 = 18.1s
Achievable max pain = PP1 + slope × 18.1
Reject permutation if: Delta > Achievable max pain; or (Lag≥22s and Slope > 0).
Sensitivity Analysis (Outliers)
We also repeated the above analyses after removing out-liers. As our primary interest was in windup, we identified subjects whose average Slope from all 10 TS trials exceeded twice the group mean.
Journal of Pain Research downloaded from https://www.dovepress.com/ by 118.70.13.36 on 24-Aug-2020
Results
Participant Characteristics And
Individualized Stimulating Temperatures
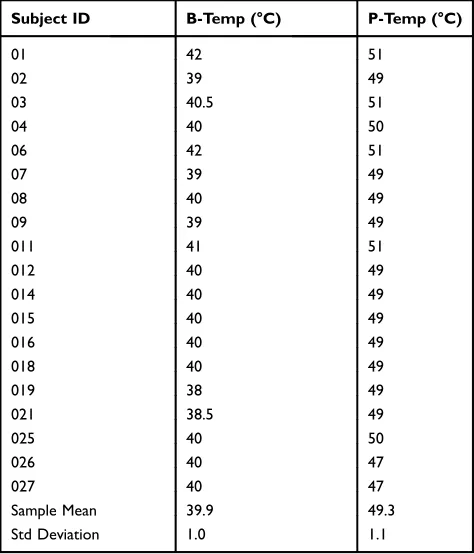
A total of 19 participants completed the experiment. Of these, 10 were male (average age 29.7, SD = 10.9) and 9 were female (average age 28.2, SD = 10.9). The demographics of the study cohort and the results of the behavioral questionnaires are sum-marized in Table S1 in part 1 of theSupplemental Material. The individualized baseline (b-temp) and peak (p-temp) stimulating temperatures are summarized inTable 1. Note that the goal of the optimization is to achieve an estimated TS (calculated as maximum pain reported subtracted by pain fromfirst heat pulse) between 30 and 70 points on a 0–100 VAS scale.14
Continuous TS Response Curves And
Variability In Curve Shape
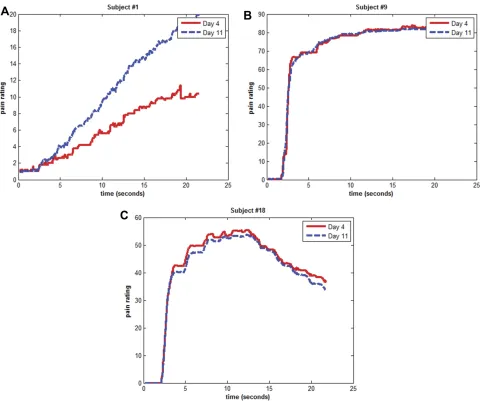
We were able to obtain continuous TS response curves for each of the 10 trials for all 19 participants. All 190 curves are available as individual plots and as daily means for each participant in Part 2 and Part 3 of the Supplemental Material, respectively. Figure 3 contains examples of the daily mean TS curves (computed by averaging 5 curves from each day) from 3 representative participants.Figure 3
demonstrates that there is a large variation in the shape of the mean TS curves, but the curve shapes largely pre-served between day 4 and day 11.
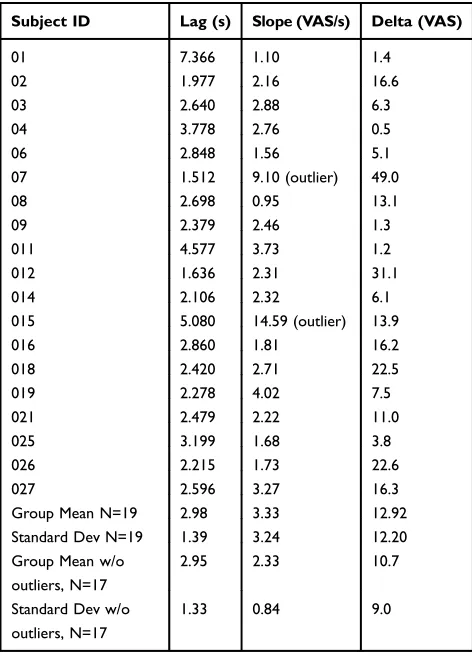
Summary Of Mean Curve Features
Table 2summarizes the mean curve features. Because we found these features were temporally stable (detailed in section 3below), we chose to represent the features as the mean value over all 10 TS trials from both day 4 and day 11. Figure 4 shows the distribution of the curve features before and after taking out two outliers who had >2 times the mean in Slope. We chose to focus on Slope because based on our hypothesis, it was the most relevant feature to windup.
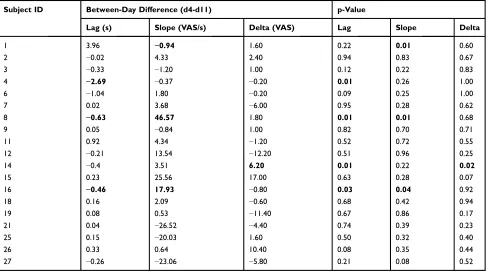
Temporal Stability Of Curve Features
Table 3contains the within-individual, between-day stabi-lity of Lag, Slope, and Delta. Bold highlights indicate a significant difference with p < 0.05, which suggests that for these few individuals, the highlighted features may not be identical between days. Overall, the features remain stable for the majority of the participants.
Correlation Analyses Of Curve Features
Correlation Between Slope And Classical TS Measures, And Among Curve Features
First, we found strong correlation between Slope and tradi-tional measures of TS, including the difference between PP1 (pain from first pulse) and Pmax (maximum pain), and between PP1 and pain from the last pulse (r = 0.91,
p< 0.0001; andr= 0.72,p=0.0007, respectively). Second, while Lag and Delta were negatively correlated (r=−0.50,
p= 0.042), there were no statistically significant correla-tions between Slope and these two features.
Correlation Between Curve Features And Individualized Stimulating Temperatures
As shown in Table 4, while Lag and Delta demonstrate various correlations with the peak and baseline stimulating temperatures, Slope showed no statistically significant cor-relation with either temperatures.
Correlation Between Curve Features (Including Temperatures) And Participant Characteristics We found no significant correlations between the curve fea-tures and any of the demographic or psychological measures, including age, sex, physical sensitivity (SHS), depression (BDI), fear (FPQ), or anxiety (ASI and STAI).
Table 1 Individualized Baseline (B-temp) And Peak (P-temp) Stimulating Temperatures
Subject ID B-Temp (°C) P-Temp (°C)
01 42 51
02 39 49
03 40.5 51
04 40 50
06 42 51
07 39 49
08 40 49
09 39 49
011 41 51
012 40 49
014 40 49
015 40 49
016 40 49
018 40 49
019 38 49
021 38.5 49
025 40 50
026 40 47
027 40 47
Sample Mean 39.9 49.3
Std Deviation 1.0 1.1
Journal of Pain Research downloaded from https://www.dovepress.com/ by 118.70.13.36 on 24-Aug-2020
However, as shown inTable 5, the baseline stimulating temperature (b-temp) was negatively correlated with trait anxiety (STAI-Y2T, r = −0.49, p = 0.031) and the peak stimulating temperature (p-temp) was negative correlated state anxiety (STAI-Y1S, r= −0.48,p= 0.039).
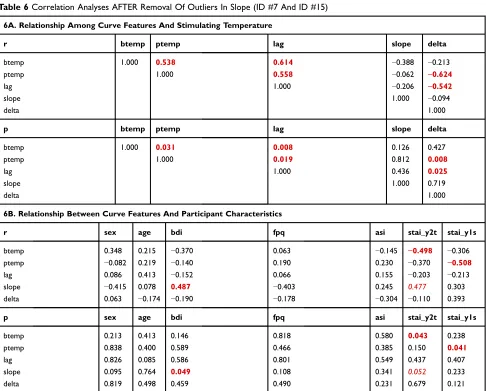
Sensitivity Analysis On Correlations After Removing
Outliers In Slope (Table 6)
As shown in Figure 4 and Table 2, ID #7 and #15 had Slope values more than twice that of the group mean. We therefore repeated the correlation analyses above with these subjects removed. Table 6A demonstrates that the relationships among the curve features and between them and the stimulating temperatures remained unchanged compared to Table 4. However,Table 6Bshows that new
relationship between Slope and BDI (r= 0.49,p= 0.049) appeared with removal of these outliers (compared to Table 5). Furthermore, there is an almost significant cor-relation between Slope and trait anxiety, STAI-y2t (r= 0.48, p= 0.052).
Discussion
In this exploratory study, we have demonstrated the feasi-bility of recording thermal TS responses using a contin-uous response vs time curve of pain ratings. We selected 3 curve features to approximate 3 physiological processes triggered by noxious heat pulses: peripheral nociception, windup, and habituation (and/or inhibition). After demon-strating within-individual temporal stability of these Figure 3Variability in Shape of TS Curves and Stability of Curve Shape Over Time. (A) Subject #1, with long Lag, low Slope, and minimal Delta. (B) Subject #9, with short Lag, moderate Slope, and minimal Delta. (C) Subject #18, also with short Lag, moderate Slope but a large Delta.
Notes:The red curve represents the average TS curve from day 4 and blue represents the average TS curve from day 11.
Journal of Pain Research downloaded from https://www.dovepress.com/ by 118.70.13.36 on 24-Aug-2020
features, our preliminary correlation analysis suggested that we have successfully separated windup from other sensory processes triggered by noxious heat pulses.
Advantages Of Recording Thermal TS
Response Using A Continuous Curve
Compared with traditional methods in which only discrete pain ratings are reported at the cue of the experimenter, using continuous rating of second pain offers more infor-mation and is simpler to perform. It allows us to obtain more precise estimates of parameters such as time to pain perception (Lag) and duration of after sensations. Our method also frees the experimenter from using and record-ing the subject’s pain level after each pulse. Finally, tradi-tional measures of thermal TS (such as absolute difference between the first and most painful pulse) can easily be derived from this continuous curve.
The major barriers to recording continuous TS response curves are: (1) a device must be available that allows continuous pain recording and is synchronized to the temperature curve; (2) it is more difficult to train the
participant to rate the second pain continuously than it is to provide a single rating at a time prompted by the experi-menter. Despite these barriers, our results demonstrated strong correlation between our windup measure (Slope) and other traditional measures of windup (e.g., change between pain from the first pulse and that of the most painful pulse), confirming success of our data collection method.
Ultimately, the ability to capture continuous pain rat-ings in response to thermal TS stimuli would allow the collection of data with higher temporal resolution than previously possible. Consequently, it allows advanced modeling to differentiate the various physiological pro-cesses triggered by noxious heat pulses as well as explore the correlation of these features with participant demo-graphic and psychological attributes.
Selection Of Curve Features: Separating
Windup From Other Sensory Processes
We hypothesized that Lag, Slope, and Delta may approx-imate peripheral nociception, spinal windup, and habitua-tion and/or descending inhibihabitua-tion, respectively. Although it is not possible to directly prove our hypothesis, our data support the association between the chose curve features and the proposed underline physiological processes.
First, 3 lines of evidence suggest that we have sepa-rated windup (Slope) from other sensory processes trig-gered by noxious heat pulses. First, our windup measure, Slope, correlated strongly with traditionally TS measures from the literature.7,13,41 Second, while Lag and Delta were negatively correlated, we did not find statistically significant correlation between these features and Slope. Third, while Lag and Delta correlated well with the stimu-lating temperatures which are related to peripheral sensitivity,13,14we did notfind statistically significant cor-relations between Slope and the stimulating temperatures. Therefore, the above evidence suggests that Slope is strongly related to windup, a central phenomenon and less related to peripheral sensitivity as represented by the individualized stimulating temperatures.
Second, Lag is defined as the time it takes tofirst perceive heat pain which has been shown to relate to peripheral nociceptor sensitivity.47Our data show Lag is correlated to both baseline and peak stimulating temperatures. During optimization,14we ensured that the baseline stimulating tem-perature (b-temp) generates a warm (maybe slightly painful) sensation, and is limited between 38°C and 42°C, which is in Table 2Curve Features From Each Participant (Average Of 10
trials)
Subject ID Lag (s) Slope (VAS/s) Delta (VAS)
01 7.366 1.10 1.4
02 1.977 2.16 16.6
03 2.640 2.88 6.3
04 3.778 2.76 0.5
06 2.848 1.56 5.1
07 1.512 9.10 (outlier) 49.0
08 2.698 0.95 13.1
09 2.379 2.46 1.3
011 4.577 3.73 1.2
012 1.636 2.31 31.1
014 2.106 2.32 6.1
015 5.080 14.59 (outlier) 13.9
016 2.860 1.81 16.2
018 2.420 2.71 22.5
019 2.278 4.02 7.5
021 2.479 2.22 11.0
025 3.199 1.68 3.8
026 2.215 1.73 22.6
027 2.596 3.27 16.3
Group Mean N=19 2.98 3.33 12.92
Standard Dev N=19 1.39 3.24 12.20
Group Mean w/o outliers, N=17
2.95 2.33 10.7
Standard Dev w/o outliers, N=17
1.33 0.84 9.0
Journal of Pain Research downloaded from https://www.dovepress.com/ by 118.70.13.36 on 24-Aug-2020
the range of cutaneous c-fiber threshold in primates.18,26,48In contrast, the peak stimulus temperature (p-temp) is delivered rapidly and is supra-threshold (47–51°C).14 This range of peak stimulating temperature overlaps with the typical range of A-delta thresholds in primates,19,48and in Cfibers from other studies.49,50 Furthermore, the mean Lag from this group of pain-free individuals is approximately 3s, i.e., 1s after the heat pulse. This reaction time is consistent with reaction time from peripheral c-fiber activation, whose con-duction speed is approximately 0.9m/s.25,27As such, both its correlation with stimulating temperatures and the similarity between Lag and reaction time associated with c-fiber activa-tion support the associaactiva-tion between Lag and c-fiber mediated peripheral nociception. Finally, despite our best efforts, some participants may still be reporting A–
delta-mediated first pain, especially during the first few pulses. Other researchers have reported this phenomenon.15,39,42
Delta is defined as the maximum decrease in pain rat-ings after the peak pain is reached. It may relate to periph-eral A-delta and/or C fiber activities, as shown by a correlation of−0.48 (p= 0.033) with the peak stimulating temperature.19,48–50Delta might represent several processes. For example, Bosma et al identified BOLD activities in the RVM and PAG regions of the brain in response to thermal TS paradigm.46These regions are implicated in endorphin-mediated descending pain inhibition.51 In addition, strong A-delta stimulation, particularly of the type II A-delta mechano-heat (AMH)fibers, leads to fatigue and adaption of peripheral A-delta response.27,52 Anderson et al13 hypothesized that such“peripheral saturation”may explain Figure 4Distribution of curve features before (n=19) and after removal of outliers (n=17) in Slope (Participant #7 and #15). (A) Distribution of Slope in full sample vs outliers removed. (B) Distribution of Lag in full sample vs outliers removed. (C) Distribution of Delta in full sample vs outliers removed.
Journal of Pain Research downloaded from https://www.dovepress.com/ by 118.70.13.36 on 24-Aug-2020
the lack of TS, or temporal decrease of second pain (TDSP), observed in more than half of the healthy individuals they tested. We have advanced Anderson’s hypothesis by (a) identifying a possible surrogate measure of A-delta sensi-tivity (peak stimulus temperature); (b) estimating degree of
“peripheral contribution” via Delta. In summary, Delta might represent a combination of central inhibition and peripheral adaptation in response to noxious heat pulses, though clearly more studies are needed to characterize the relationship between these processes and Delta.
Between-Day Stability Of Key Curve
Features
Our results indicate the general stability of all three chosen curve features. Slope, which closely represents windup, demonstrated identical values for both testing days in 16 of the 19 participants. This result is consistent with prior reports of the general stability of TS as measured by other methods.14,41 The results on Lag and Delta suggest that sensory processes represented by these features are also grossly stable.
Relationship Between Curve Features
And Participant Characteristics
In the full sample, while we did not find statistically significant correlations between curve features and par-ticipant characteristics, we found inverse correlations between the baseline and peak stimulating temperatures to trait and state anxiety, respectively. Considering we had individually adjusted the temperature settings of the heat pulses to generate moderate amount of TS in our participants, it is possible that these individualized temperature settings reduced the variability in our curve features. Furthermore, the relationship between TS parameters and anxiety found in our study is con-sistent with literature.7,15 In these other examples, the Table 3Temporal Stability Of Curve Features
Subject ID Between-Day Difference (d4-d11) p-Value
Lag (s) Slope (VAS/s) Delta (VAS) Lag Slope Delta
1 3.96 −0.94 1.60 0.22 0.01 0.60
2 −0.02 4.33 2.40 0.94 0.83 0.67
3 −0.33 −1.20 1.00 0.12 0.22 0.83
4 −2.69 −0.37 −0.20 0.01 0.26 1.00
6 −1.04 1.80 −0.20 0.09 0.25 1.00
7 0.02 3.68 −6.00 0.95 0.28 0.62
8 −0.63 46.57 1.80 0.01 0.01 0.68
9 0.05 −0.84 1.00 0.82 0.70 0.71
11 0.92 4.34 −1.20 0.52 0.72 0.55
12 −0.21 13.54 −12.20 0.51 0.96 0.25
14 −0.4 3.51 6.20 0.01 0.22 0.02
15 0.23 25.56 17.00 0.63 0.28 0.07
16 −0.46 17.93 −0.80 0.03 0.04 0.92
18 0.16 2.09 −0.60 0.68 0.42 0.94
19 0.08 0.53 −11.40 0.67 0.86 0.17
21 0.04 −26.52 −4.40 0.74 0.39 0.23
25 0.15 −20.03 1.60 0.50 0.32 0.40
26 0.33 0.64 10.40 0.08 0.35 0.44
27 −0.26 −23.06 −5.80 0.21 0.08 0.52
Note:Bold values indicate statistical significance p <0.05.
Table 4 Correlation Among Curve Features, And Between Curve Features And Stimulating Temperatures
r btemp ptemp lag slope delta
btemp 1.000 0.537 0.597 −0.191 −0.306
ptemp 1.000 0.493 −0.104 −0.484
lag 1.000 0.148 −0.502
slope 1.000 0.344
delta 1.000
p btemp ptemp lag slope delta
btemp 1.000 0.020 0.009 0.403 0.201
ptemp 1.000 0.033 0.637 0.033
lag 1.000 0.505 0.042
slope 1.000 0.115
delta 1.000
Note:Bold values indicate statistical significance p <0.05.
Journal of Pain Research downloaded from https://www.dovepress.com/ by 118.70.13.36 on 24-Aug-2020
authors did not individualize the thermal stimulation and found correlation between magnitude of TS (mea-sured as difference between first and most painful pulse) and anxiety.
After removing ID #7 and #15, Slope demonstrated positive correlation with depression and likely anxiety. While these make intuitive sense, given our limited sample size, we are careful not to draw definitive conclusions on Table 5Correlation Between TS Curve Features (Including Stimulating temperatures) And Participant Characteristics
r sex age bdi fpq asi stai_y2t stai_y1s
B_temp 0.265 0.154 −0.336 0.054 −0.082 −0.491 −0.288
P_temp −0.079 0.197 −0.116 0.164 0.246 −0.343 −0.478
lag −0.064 0.310 −0.193 0.140 0.037 −0.294 −0.260
slope −0.172 0.124 −0.103 0.134 −0.375 −0.061 −0.121
delta 0.207 0.041 −0.189 −0.088 −0.355 −0.008 0.244
p sex age bdi fpq asi stai_y2t stai_y1s
B_temp 0.289 0.524 0.156 0.830 0.738 0.031 0.229
P_temp 0.782 0.412 0.628 0.500 0.318 0.155 0.039
lag 0.820 0.196 0.441 0.569 0.883 0.226 0.281
slope 0.513 0.671 0.711 0.590 0.109 0.810 0.613
delta 0.419 0.870 0.438 0.723 0.132 0.973 0.314
Note:Bold values indicate statistical significance.
Table 6Correlation Analyses AFTER Removal Of Outliers In Slope (ID #7 And ID #15)
6A. Relationship Among Curve Features And Stimulating Temperature
r btemp ptemp lag slope delta
btemp 1.000 0.538 0.614 −0.388 −0.213
ptemp 1.000 0.558 −0.062 −0.624
lag 1.000 −0.206 −0.542
slope 1.000 −0.094
delta 1.000
p btemp ptemp lag slope delta
btemp 1.000 0.031 0.008 0.126 0.427
ptemp 1.000 0.019 0.812 0.008
lag 1.000 0.436 0.025
slope 1.000 0.719
delta 1.000
6B. Relationship Between Curve Features And Participant Characteristics
r sex age bdi fpq asi stai_y2t stai_y1s
btemp 0.348 0.215 −0.370 0.063 −0.145 −0.498 −0.306
ptemp −0.082 0.219 −0.140 0.190 0.230 −0.370 −0.508
lag 0.086 0.413 −0.152 0.066 0.155 −0.203 −0.213
slope −0.415 0.078 0.487 −0.403 0.245 0.477 0.303
delta 0.063 −0.174 −0.190 −0.178 −0.304 −0.110 0.393
p sex age bdi fpq asi stai_y2t stai_y1s
btemp 0.213 0.413 0.146 0.818 0.580 0.043 0.238
ptemp 0.838 0.400 0.589 0.466 0.385 0.150 0.041
lag 0.826 0.085 0.586 0.801 0.549 0.437 0.407
slope 0.095 0.764 0.049 0.108 0.341 0.052 0.233
delta 0.819 0.498 0.459 0.490 0.231 0.679 0.121
Note:Bold values indicate statistical significance p <0.05.
Journal of Pain Research downloaded from https://www.dovepress.com/ by 118.70.13.36 on 24-Aug-2020
our outlier analysis. A greater sample size is clearly needed in our next, validation study.
Limitations And Future Studies
The current study has several limitations.
First, as an exploratory study, we had made several assumptions interpreting the correlation analyses: (i) we only examined linear relationships between curve features and other parameters of interest; (ii) we did not account for multiple comparisons; (iii) in cases where we did notfind statistically significant correlations, it is conceivable to observe some correlations with much larger sample size. However, our practice of examining linear relationships in an exploratory study does not deviate significantly from the literature.7,15 Furthermore, looking atTables 4 and5, few of the p values are in the gray zone thus making our other points less relevant.
Second, like many other TS methods, our methodology requires extensive participant training to ensure that parti-cipants (a) understand the anchors for 0 and 100 on the VAS; (b) able to differentiate first and second pain; (c) able to rate second pain in a continuous fashion. Therefore, a prerequisite for successful capture of contin-uous thermal TS response is adequate and standardized participant training. While it may be time-consuming, it does allow capture of more information with higher tem-poral resolution.
Third, we built a simple model of only 3 curve features that may not completely capture the complex between-individual variability in TS response. Furthermore, while our selected curve feature (Slope) demonstrated strong correlations to existing measures of TS, we do not have enough evidence to confirm that Lag represents only per-ipheral nociceptor activation or Delta in fact measures habituation ± descending pain modulation. However, to the best of our knowledge, our attempt is thefirst to define features in a phasic thermal TS response curve AND to isolate what appears to be an excellent measure of windup from other processes triggered by noxious heat pulses. The competition and balance between these sensory processes may offer answers to the great between-individual varia-bility seen in thermal TS responses.7,13,53
In the future, we propose to extend our study and make it clinically relevant by: (1) validate our results in larger cohorts and contrasting curve features between those with vs without chronic pain; (2) stratify patients based curve profiles and evaluate relationship between curve profiles and risks of chronic pain as well as response to treatment;
(3) further characterize Lag and Delta where TS and other QST modalities will be simultaneously tested. Additionally, we may include other relevant patient char-acteristics beyond those analyzed here (e.g., catastrophiz-ing, history of childhood trauma, etc.) in studying these curve features.
Conclusions And Clinical Utilities
We have demonstrated feasibility of recording thermal TS responses using a continuous curve of pain ratings. Furthermore, we were successful in isolating a windup measure consistent with previous studies from other sen-sory processes, and in quantifying these processes using curve feature modeling. Compared to traditional methods of quantifying thermal TS where a single feature is derived based on discrete pain ratings, our method affords higher resolution and the opportunity of better characterizing the complex sensory processes triggered by heat pulse admin-istration. Future studies are clearly needed to further char-acterize thermal TS response and to understand the physiologic significance of Lag and Delta. Ultimately, these curve features may be used together as biomarkers to differentiate patients with chronic pain from health controls, and to stratify patients into diagnostic and prog-nostic groups to facilitate personalized delivery of pain relief strategies.
Acknowledgment
We acknowledge Raymond Balise, PhD, for his advice regarding alternative methods to analyze our data, Kevin Johnson, PhD, for discussion on different methods of administering heat pulses, and Sophia You, PhD, RN, for feedback to the composition this manuscript.
Funding
We acknowledge funding support by NIH K24 DA029262 (S.M.), NIH T32 GM89626 (J.K.), NIH K23 AT008477 (J. K.) NIH K23 DA031808 (K.J.), NIH KL2 TR001083 (R. O.), and Chris Redlich Endowment (S.M.)
Disclosure
The authors report no conflicts of interest with this manuscript.
References
1. Arendt-Nielsen L, Petersen-Felix S. Wind-up and neuroplasticity: is there a correlation to clinical pain? Eur J Anaesthesiol Suppl.
1995;10:1–7.
Journal of Pain Research downloaded from https://www.dovepress.com/ by 118.70.13.36 on 24-Aug-2020
2. Eide PK. Wind-up and the NMDA receptor complex from a clinical perspective.Eur J Pain.2000;4(1):5–15. doi:10.1053/eujp.1999.0154 3. Price DD. Characteristics of second pain andflexion reflexes indica-tive of prolonged central summation.Exp Neurol.1972;37(2):371– 387. doi:10.1016/0014-4886(72)90081-7
4. Price DD, Hu JW, Dubner R, Gracely RH. Peripheral suppression of first pain and central summation of second pain evoked by noxious heat pulses. Pain. 1977;3(1):57–68. doi:10.1016/0304-3959(77)90 035-5
5. Arendt-Nielsen L, Yarnitsky D. Experimental and clinical applica-tions of quantitative sensory testing applied to skin, muscles and viscera.J Pain.2009;10(6):556–572. doi:10.1016/j.jpain.2009.02.002 6. Edwards RR, Fillingim RB. Effects of age on temporal summation and habituation of thermal pain: clinical relevance in healthy older and younger adults. J Pain. 2001;2(6):307–317. doi:10.1054/ jpai.2001.25525
7. Granot M, Granovsky Y, Sprecher E, Nir RR, Yarnitsky D. Contact heat-evoked temporal summation: tonic versus repetitive-phasic sti-mulation. Pain. 2006;122(3):295–305. doi:10.1016/j.pain.2006.02. 003
8. Mauderli AP, Vierck CJ Jr., Cannon RL, Rodrigues A, Shen C. Relationships between skin temperature and temporal summation of heat and cold pain. J Neurophysiol. 2003;90(1):100–109. doi:10. 1152/jn.01066.2002
9. Vierck CJ Jr., Cannon RL, Fry G, Maixner W, Whitsel BL. Characteristics of temporal summation of second pain sensations elicited by brief contact of glabrous skin by a preheated thermode.
J Neurophysiol. 1997;78(2):992–1002. doi:10.1152/jn.1997.78.2. 992
10. Fillingim RB, King CD, Ribeiro-Dasilva MC, Rahim-Williams B, Riley JL 3rd. Sex, gender, and pain: a review of recent clinical and experimentalfindings. J Pain. 2009;10(5):447–485. doi:10.1016/j. jpain.2008.12.001
11. Greenspan JD, Slade GD, Bair E, et al. Pain sensitivity risk factors for chronic TMD: descriptive data and empirically identified domains from the OPPERA case control study.J Pain.2011;12(11 Suppl): T61–74. doi:10.1016/j.jpain.2011.08.006
12. Reynolds WS, Kowalik C, Cohn J, et al. Women undergoing third line overactive bladder treatment demonstrate elevated thermal tem-poral summation.J Urol. 2018;200(4):856–861. doi:10.1016/j.juro. 2018.05.007
13. Anderson RJ, Craggs JG, Bialosky JE, et al. Temporal summation of second pain: variability in responses to afixed protocol.Eur J Pain.
2013;17(1):67–74. doi:10.1002/ejp.2013.17.issue-1
14. Kong JT, Johnson KA, Balise RR, Mackey S. Test-retest reliability of thermal temporal summation using an individualized protocol. J Pain.2013;14(1):79–88. doi:10.1016/j.jpain.2012.10.010
15. Robinson ME, Bialosky JE, Bishop MD, Price DD, George SZ. Supra-threshold scaling, temporal summation, and after-sensation: relationships to each other and anxiety/fear.J Pain Res.2010;3:25– 32. doi:10.2147/JPR.S9462
16. George SZ, Wittmer VT, Fillingim RB, Robinson ME. Sex and pain-related psychological variables are associated with thermal pain sen-sitivity for patients with chronic low back pain.J Pain.2007;8(1):2– 10. doi:10.1016/j.jpain.2006.05.009
17. Bhalang K, Sigurdsson A, Slade GD, Maixner W. Associations among four modalities of experimental pain in women. J Pain.
2005;6(9):604–611. doi:10.1016/j.jpain.2005.04.006
18. Tillman DB, Treede RD, Meyer RA, Campbell JN. Response of C fibre nociceptors in the anaesthetized monkey to heat stimuli: corre-lation with pain threshold in humans.J Physiol.1995;485(Pt 3):767– 774. doi:10.1113/jphysiol.1995.sp020767
19. Treede RD, Meyer RA, Raja SN, Campbell JN. Evidence for two different heat transduction mechanisms in nociceptive primary affer-ents innervating monkey skin.J Physiol.1995;483(Pt 3):747–758. doi:10.1113/jphysiol.1995.sp020619
20. Van Hees J, Gybels J. C nociceptor activity in human nerve during painful and non painful skin stimulation. J Neurol Neurosurg Psychiatry. 1981;44(7):600–607. doi:10.1136/jnnp.44. 7.600
21. Melzack R. Gate control theory: on the evolution of pain concepts.Pain Forum.1996;5(2):128–138. doi:10.1016/S1082-3174(96)80050-X 22. Melzack R, Wall PD. Pain mechanisms: a new theory. Science.
1965;150(3699):971–979. doi:10.1126/science.150.3699.971 23. Phillips K, Clauw DJ. Central pain mechanisms in chronic pain
states–maybe it is all in their head.Best Pract Res Clin Rheumatol.
2011;25(2):141–154. doi:10.1016/j.berh.2011.02.005
24. Yarnitsky D, Granot M, Granovsky Y. Pain modulation profile and pain therapy: between pro- and anti-nociception.PAIN®.2014;155 (4):663–5.
25. Treede RD. Peripheral acute pain mechanisms. Ann Med.1995;27 (2):213–216. doi:10.3109/07853899509031961
26. Treede RD, Meyer RA, Campbell JN. Comparison of heat and mechanical receptivefields of cutaneous C-fiber nociceptors in mon-key.J Neurophysiol.1990;64(5):1502–1513. doi:10.1152/jn.1990.64. 5.1502
27. Treede RD, Meyer RA, Campbell JN. Myelinated mechanically insensitive afferents from monkey hairy skin: heat-response proper-ties.J Neurophysiol.1998;80(3):1082–1093. doi:10.1152/jn.1998.80. 3.1082
28. Agostinho CMS, Scherens A, Richter H, et al. Habituation and short-term repeatability of thermal testing in healthy human subjects and patients with chronic non-neuropathic pain. Eur J Pain. 2009;13 (8):779–785. doi:10.1016/j.ejpain.2008.10.002
29. Greffrath W, Baumgartner U, Treede RD. Peripheral and central components of habituation of heat pain perception and evoked poten-tials in humans.Pain.2007;132(3):301–311.
30. Le Bars D. The whole body receptive field of dorsal horn multi-receptive neurones.Brain Res Rev.2002;40(1–3):29–44. doi:10.1016/ S0165-0173(02)00186-8
31. Beck AT, Ward CH, Mendelson MM, Mock JJ, Erbaugh JJ. AN inventory for measuring depression. Arch Gen Psychiatry. 1961;4 (6):561–571. doi:10.1001/archpsyc.1961.01710120031004
32. McNeil DW, Rainwater AJ 3rd. Development of the fear of pain questionnaire–III. J Behav Med.1998;21(4):389–410. doi:10.1023/ A:1018782831217
33. Reiss S, Peterson RA, Gursky DM, McNally RJ. Anxiety sensitivity, anxiety frequency and the prediction of fearfulness.Behav Res Ther.
1986;24(1):1–8. doi:10.1016/0005-7967(86)90143-9
34. Spielberger CD.Manual for the State-Trait Anxiety Inventory STAI (Form Y). 1st ed. Palo Alto, CA: Mind Garden;1983.
35. Benham G The sensory sensitivity scale: sex and population differ-ences. Paper presented at: The Meeting of the Southwestern Psychological Association;2004; San Antonio, TX.
36. Mackey IG, Dixon EA, Johnson K, Kong JT. Dynamic quantitative sensory testing to characterize central pain processing.J Vis Exp.
2017;120.
37. Garland EL. Pain processing in the human nervous system: a selec-tive review of nocicepselec-tive and biobehavioral pathways.Prim Care.
2012;39(3):561–571. doi:10.1016/j.pop.2012.06.013
38. Loeser JD, Melzack R. Pain: an overview. Lancet. 1999;353 (9164):1607–1609. doi:10.1016/S0140-6736(99)01311-2
39. Price DD, Dubner R. Mechanisms of first and second pain in the peripheral and central nervous systems.J Invest Dermatol.1977;69 (1):167–171. doi:10.1111/1523-1747.ep12497942
40. Yarnitsky D, Arendt-Nielsen L, Bouhassira D, et al. Recommendations on terminology and practice of psychophysical DNIC testing. Eur J Pain. 2010;14(4):339. doi:10.1016/j.ejpain. 2010.02.004
41. Alappattu MJ, Bishop MD, Bialosky JE, George SZ, Robinson ME. Stability of behavioral estimates of activity-dependent modulation of pain.J Pain Res.2011;4:151–157. doi:10.2147/JPR.S18105
Journal of Pain Research downloaded from https://www.dovepress.com/ by 118.70.13.36 on 24-Aug-2020
42. Fillingim RB, Ness TJ, Glover TL, Campbell CM, Price DD, Staud R. Experimental pain models reveal no sex differences in pentazocine analgesia in humans. Anesthesiology. 2004;100(5):1263–1270. doi:10.1097/00000542-200405000-00031
43. Staud R, Bovee CE, Robinson ME, Price DD. Cutaneous C-fiber pain abnormalities offibromyalgia patients are specifically related to tem-poral summation. Pain. 2008;139(2):315–323. doi:10.1016/j.pain. 2008.04.024
44. Valencia C, Fillingim RB, George SZ. Suprathreshold heat pain response is associated with clinical pain intensity for patients with shoulder pain. J Pain. 2011;12(1):133–140. doi:10.1016/j.jpain. 2010.06.002
45. Edwards RR, Ness TJ, Weigent DA, Fillingim RB. Individual differ-ences in diffuse noxious inhibitory controls (DNIC): association with clinical variables. Pain. 2003;106(3):427–437. doi:10.1016/j.pain. 2003.09.005
46. Bosma RL, Ameli Mojarad E, Leung L, Pukall C, Staud R, Stroman PW. Neural correlates of temporal summation of second pain in the human brainstem and spinal cord. Hum Brain Mapp. 2015;36 (12):5038–5050. doi:10.1002/hbm.v36.12
47. Schepers RJ, Ringkamp M. Thermoreceptors and thermosensitive afferents.Neurosci Biobehav Rev.2010;34(2):177–184. doi:10.1016/ j.neubiorev.2009.10.003
48. Churyukanov M, Plaghki L, Legrain V, Mouraux A. Thermal detec-tion thresholds of Aδ- and C-fibre afferents activated by brief CO2 laser pulses applied onto the human hairy skin.PLoS One.2012;7(4): e35817–e35817. doi:10.1371/journal.pone.0035817
49. Beitel RE, Dubner R. Response of unmyelinated (C) polymodal nociceptors to thermal stimuli applied to monkey’s face. J Neurophysiol.1976;39(6):1160–1175. doi:10.1152/jn.1976.39.6.1160 50. Lynn B, Carpenter SE. Primary afferent units from the hairy skin of the rat hind limb.Brain Res.1982;238(1):29–43. doi:10.1016/0006-8993(82)90768-5
51. Fields H. State-dependent opioid control of pain.Nat Rev Neurosci.
2004;5(7):565–575. doi:10.1038/nrn1431
52. LaMotte RH, Campbell JN. Comparison of responses of warm and nociceptive C-fiber afferents in monkey with human judgments of thermal pain.J Neurophysiol.1978;41(2):509–528. doi:10.1152/jn.1978.41.2.509 53. Raphael KG, Janal MN, Anathan S, Cook DB, Staud R. Temporal summation of heat pain in temporomandibular disorder patients. J Orofac Pain.2009;23(1):54–64.
Journal of Pain Research
Dove
press
Publish your work in this journal
The Journal of Pain Research is an international, peer reviewed, open access, online journal that welcomes laboratory and clinicalfindings in thefields of pain research and the prevention and management of pain. Original research, reviews, symposium reports, hypothesis formation and commentaries are all considered for publication. The manuscript
management system is completely online and includes a very quick and fair peer-review system, which is all easy to use. Visit http:// www.dovepress.com/testimonials.php to read real quotes from pub-lished authors.
Submit your manuscript here:https://www.dovepress.com/journal-of-pain-research-journal
Journal of Pain Research downloaded from https://www.dovepress.com/ by 118.70.13.36 on 24-Aug-2020

![Effectiveness of the population based Check your health preventive programme conducted in primary care with 4 years follow up [the CORE trial]: study protocol for a randomised controlled trial](data:image/gif;base64,R0lGODlhAQABAIAAAP///wAAACH5BAEAAAAALAAAAAABAAEAAAICRAEAOw==)