1
Nanoparticle-Lipid Interaction:
Job Scattering Plots to Differentiate Vesicle Aggregation
from Supported Lipid Bilayer Formation
F. Mousseau1, E.K. Oikonomou1, V. Baldim1, S. Mornet2 and J.-F. Berret*1
1Matière et Systèmes Complexes, UMR 7057 CNRS Université Denis Diderot Paris-VII, Bâtiment
Condorcet, 10 rue Alice Domon et Léonie Duquet, 75205 Paris, France.
2Institut de Chimie de la Matière Condensée de Bordeaux, UPR CNRS 9048, Université Bordeaux 1, 87
Avenue du Docteur A. Schweitzer, Pessac cedex F-33608, France
Abstract:
The impact of nanomaterials on lung fluids or on the plasma membrane of living cells has prompted researchers to examine the interactions between nanoparticles and lipid vesicles. Recent studies have shown that nanoparticle-lipid interaction leads to a broad range of structures including supported lipid bilayers (SLB), particles adsorbed at the surface or internalized inside vesicles, and mixed aggregates. Today, there is a need to have simple protocols that can readily assess the nature of structures obtained from particles and vesicles. Here we apply the method of continuous variation for measuring Job scattering plots and provide analytical expressions for the scattering intensity in various scenarios. The result that emerges from the comparison between modeling and experimental measurements is that electrostatics plays a key role in the association, but it is not sufficient to induce the formation of supported lipid bilayers.
Keywords: Nanoparticles – Bio-nano interfaces – Electrostatic interactions – Supported Lipid Bilayers
Corresponding authors: [email protected]
I – Introduction
The emission of fine and ultrafine particulate matter in the environment is responsible for the
increase of mortality and morbidity from cardiorespiratory diseases worldwide [1-2]. In the
context of environmental pollution, engineered nanoparticles which sizes are less than 100 nm
have attracted much attention and been identified as potentially harmful. When inhaled, these
particles are able to reach the respiratory zone in the lungs and enter in contact with the alcinar
region composed of hundreds of millions of alveoli [3-4]. Several scenarios of nanoparticles
passing from the alveolar spaces towards the blood circulation have been examined recently and
in some case studies the crossing of the air-blood barrier has been demonstrated [4]. It is found
that in the alveolar spaces, the nanoparticles first come into contact with the pulmonary surfactant,
a fluid composed of lipids (90%) and proteins (10%) which provides important functions in the
lung physiology [5-6]. This scenario prompted researchers to actively study the interactions
between nanoparticles and lipid vesicles, typically with vesicular structures in the size range 100
nm to 1 μm [7-10].
Another example where particles interact directly with biological membranes is the process of
endocytosis [11]. Endocytosis is the biological process by which nano-objects of different nature
and sizes, including pathogens, bacteria, virus, nanoparticles etc… are internalized inside living
cells. For particles larger than 1 µm, the process is referred to micropinocytosis, whereas for 100
nm nanoparticles the passage through the membrane can be passive or active, this later being
mediated by caveolin or clathrin proteins [12]. When nanoparticles are close to a cell membrane,
the interactions generate forces of different origins (e.g. van der Waals, electrostatic), leading to
To evaluate the interplay of nanomaterials with biological membranes, recent experimental,
theoretical and simulation studies have focused on the interaction of nanoparticles with closed
membranes in the form of vesicles [9,16-23]. Most experiments reported until recently were
performed using synthetic lipids of the phosphatidylcholine class, such as
1,2-dipalmitoylphosphatidylcholine (DPPC), 1,2-dimyristoyl-sn-glycero-3-phosphocholine (DMPC)
or 1,2-dioleoyl-sn-glycero-3-phosphocholine (DOPC). From their structures, the
phosphatidylcholine vesicles are similar to those found in pulmonary surfactants [5,17,24-26].
Strategies based on the use of more biological models and substitutes have been also proposed
[17,27-29]. Depending on the particle size, charge and hydrophobicity, several mechanisms have
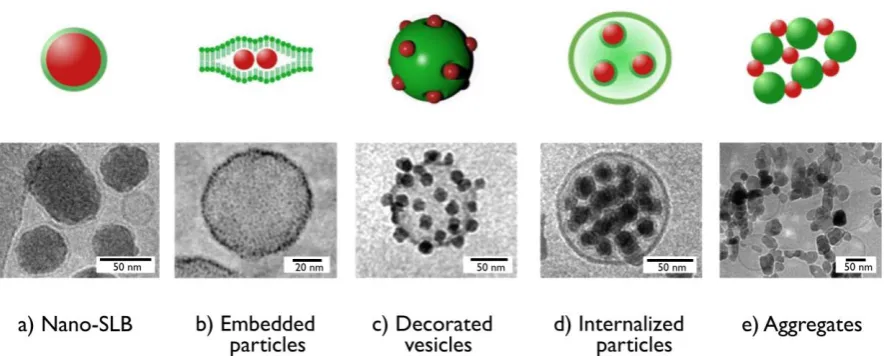
been suggested, leading to a wide variety of hybrid structures. Fig. 1 displays a library of
nanoparticle-membrane structures observed using cryogenic transmission electron microscopy
(cryo-TEM). They include nanoparticles coated with a single bilayer (called nano-SLB in the
following, Fig. 1a) [17,28], particles embedded with the lipid membrane or adsorbed at the surface
(Fig. 1b and 1c respectively) [30-31], particles internalized inside the lipid compartment (Fig. 1d)
[32] and mixed nanoparticle-vesicle aggregates (Fig. 1e) [18]. In the case of particle
internalization, the fluid membrane invaginates and envelops one or several particles like in
cellular endocytosis [11]. Despite many efforts, the mechanisms of particles interacting with the
synthetic or biological membranes are not fully understood.
A broad range of experiments was used to study particle-membrane interaction. These experiments
include, among others light scattering [17,33], leakage assays [18], quartz crystal microbalance
[34], electron and fluorescence microscopy [17,24-25,30-32]. Cryogenic transmission electron
microscopy is probably one of the best methods to visualize the nanoparticle-membrane structures,
as illustrated in Fig. 1 [35]. It has the required resolution (~ 1 nm) and electronic contrast to identify
few objects are usually displayed. In this context, there is need to develop simple protocols that
can rapidly assess the nature of structures obtained from particles and vesicles. Here we provide
examples of light scattering based analytical models that are able to discriminate among the
different association scenarios illustrated in Fig. 1. The approach is developed for static light
scattering but could be extended as well to small-angle neutron and X-ray scattering or UV-visible
spectroscopy. To this aim, we use the method of continuous variation developed by Paul Job,
leading to what we describe as Job scattering plots [36-41]. Here we provide analytical expressions
for the Rayleigh ratio obtained from mixed nanoparticle-vesicle aggregates and particle coated
with a single bilayer, respectively. Quantitative comparisons with experimental data are also
discussed.
Figure 1: Cryogenic transmission electron microscopy images obtained from nanoparticle-vesicle
association. a) Silica nanoparticles coated with a supported lipid bilayer [17]; b) Gold particles embedded within the lipid membrane of a vesicle [31]; c) Silica particles adsorbed at the surface of a vesicles [30]. d) Silica particles internalized inside the lipid compartment [32]. e) Aggregates of ZnO nanoparticles and vesicles [18]. The upper panels provide an illustration for the different structures.
II – Experimental
Nanoparticles: Aluminum oxide nanoparticles from Disperal® (SASOL, Germany) have the
homogeneous dispersions, the alumina powder is dissolved in a nitric acid solution (0.4 wt. % in
deionized water) at the concentration of 10 g L-1 and sonicated for an hour. The particles have an
hydrodynamic diameter 𝐷𝐻 = 64 nm. The positively charged silica particles were synthetized using
the Stöber synthesis. Following the synthesis, the silica were functionalized by amine groups,
resulting in a positive coating [17,23,42]. Aminated silica were synthesized at 40 g L-1 and diluted
with DI-water at pH 5. The hydrodynamic and geometric diameters were determined at 𝐷𝐻 = 60
nm and 𝐷𝑇𝐸𝑀 = 41.2 nm. Negative silica particles (trade name CLX®) were purchased from Sigma
Aldrich at the concentration of 450 g L-1. The batch was diluted down to 50 g L-1 and dialyzed
against DI-water at pH 9 for two days. The diameters were measured at 𝐷𝐻 = 34 nm and 𝐷𝑇𝐸𝑀 =
20 nm [23]. The particle surface charge densities were determined using the polyelectrolyte
assisted charge titration spectrometry [39], leading densities of +7.3e, +0.62e and -0.31e nm-2
respectively. In the following, the particles are abbreviated Alumina (+), Silica (+) and Silica (-).
Phospholipids: Dipalmitoylphosphatidylcholine (DPPC), L-α-Phosphatidyl-DL-glycerol sodium
salt from egg yolk lecithin (PG, Sigma-Aldrich, MDL number: MFCD00213550) and
2-Oleoyl-1-palmitoyl-sn-glycero-3-phospho-rac-(1-glycerol) (POPG) were purchased from Sigma-Aldrich.
Phospholipids DPPC, PG and POPG were dissolved in methanol, at 10, 10 and 20 g L-1
respectively and then mixed in proper amounts for a final weight concentration of 80% / 10% /
10% of DPPC / PG / POPG. The solvent was evaporated under low pressure at 60 ˚C for 30
minutes. The lipid film formed on the bottom of the flask was then rehydrated with the addition of
Milli-Q water at 60 ˚C and agitated at atmospheric pressure for another 30 minutes. Milli-Q water
was added again to finally obtain a solution at 1 g L-1. The lipid vesicles are characterized by a
hydrodynamic dimeter 𝐷𝐻 = 120 nm and a zeta potential 𝜁 = - 32 mV. Nanoparticle-vesicle
interactions were investigated using a mixing protocol known as the continuous variation method
concentration and the stock solutions were mixed at different volumetric ratios 𝑋 = 𝑐𝑉𝑒𝑠⁄𝑐𝑁𝑃,
where 𝑐𝑉𝑒𝑠 and 𝑐𝑁𝑃 are the vesicle and nanoparticle concentrations. For Alumina (+), the pH of
the stock dispersions was adjusted at pH 5 to ensure that particles do not aggregate as a result of
the pH changes. Silica (+) and Silica (-) were studied at physiological pH.
Static and Dynamic Light Scattering: The scattered intensity 𝐼𝑆 and the hydrodynamic diameter
𝐷𝐻 were obtained from the NanoZS Zetasizer spectrometer (Malvern Instruments). Analytical
expressions in the following will be given in terms of the Rayleigh ratio ℛ, which is basically
proportional to 𝐼𝑆 in the case considered here. The second-order autocorrelation function was
analyzed using the cumulant and CONTIN algorithms to determine the average diffusion
coefficient 𝐷𝐶 of the scatterers. 𝐷𝐻 was calculated according to the Stokes-Einstein relation 𝐷𝐻 =
𝑘𝐵𝑇/3𝜋𝜂𝐷𝐶 where 𝑘𝐵 is the Boltzmann constant, 𝑇 the temperature and 𝜂 the solvent viscosity.
The hydrodynamic diameters provided here are the second coefficients in the cumulant analysis
described as 𝑍𝐴𝑣𝑒. Measurements were performed in triplicate at 25 °C and 37 °C after an
equilibration time of 120 s, yielding experimental uncertainties better than 10% in both intensity
and diameter.
Electrophoretic mobility and zeta potential: Laser Doppler velocimetry using the phase analysis
light scattering mode and detection at an angle of 16° was used to carry out the electrokinetic
measurements of electrophoretic mobility and zeta potential with the Zetasizer Nano ZS
equipment (Malvern Instruments, UK). Zeta potential was measured after a 120 s equilibration at
25 °C.
III.1 – Job scattering plots
In 1928, Paul Job developed the method of continuous variation to determine the stoichiometry of
binding (macro)molecular species in solutions, providing information about the equilibrium
complexes. We have adapted this technique to study interactions in soft condensed matter using
small-angle scattering techniques. In the cases of coacervation or microphase separation , the Job
scattering technique allows to screen large domains of phase diagrams and to detect phase
boundaries [43]. In the cases of protein forming corona, of polymer or lipid adsorption on
nanoparticles, the method is quantitative and provide some key features of the association, e.g. the
stoichiometry, the layer thickness and density [41,44]. In this work, emphasis is put on static light
scattering and the modeling of attractive interaction between nanoparticles and lipids. This
approach leads to analytical expressions for the scattering intensity during aggregate or SLB
formation.
More specifically, we are concerned with ternary phase diagrams for which the total active
concentration 𝑐 = 𝑐𝑁𝑃+ 𝑐𝑉𝑒𝑠 is constant and the ratio between the two concentrations is varying
continuously according to 𝑋 = 𝑐𝑉𝑒𝑠⁄𝑐𝑁𝑃, where 𝑐𝑁𝑃 and 𝑐𝑉𝑒𝑠 are the nanoparticle and vesicle
concentrations, respectively. In practice, 𝑐 is held in the range 0.01 – 10 g L-1 and 𝑋 = 10-3 – 103.
This technique has several advantages, one of them being that the solutions are in the dilute regime
and that the Debye-Gans theory applies to all solutions [45]. The approach also relies on the fact
that the scattering intensity arising from different species is additive, leading to:
ℛ(𝑞, 𝑐, 𝑋) = ∑ 𝐾𝑖𝑐𝑖(𝑋) [ 1 𝑀𝑤𝑖 (1 +
𝑞2𝑅𝐺,𝑖2
3 ) + 2𝐴2,𝑖𝑐𝑖(𝑋)]
−1
𝑖
(1)
where the index 𝑖 refers to the different types of scatterer. In this work, 4 types of scatterers are
considered: engineered nanoparticles, lipid vesicles, hybrid aggregates and supported lipid
bilayers. In Eq. 1, 𝐾𝑖 is the scattering contrast coefficient, 𝑀𝑤𝑖 the weight-averaged molecular
form factor (1 − 𝑞2𝑅𝐺2/3) and the interaction contribution 2𝐴2𝑐 will be neglected for sake of
simplicity, leading for the Rayleigh ratio an expression of the form:
ℛ(𝑐, 𝑋) = ∑ 𝐾𝑖𝑀𝑤𝑖 𝑐𝑖(𝑋)
𝑖
(2)
The scattering intensity arising from nanoparticle and vesicle mixed solutions is now provided for
three basic behaviors, the case of non-interacting species, the aggregate formation (Fig. 1e) and
the nano-SLB (Fig. 1a).
III.2 – Non-interacting species
For the trivial case where nanoparticles and vesicles do not interact, the scattering intensity isthe
sum of the 𝑋 = 0 and 𝑋 = ∞ intensities weighted by their actual concentrations 𝑐𝑁𝑃(𝑋) =
𝑐 (1 + 𝑋)⁄ and 𝑐𝑉𝑒𝑠(𝑋) = 𝑐𝑋 (1 + 𝑋)⁄ , leading to:
ℛ𝑁𝐼(𝑐, 𝑋) = 𝐾𝑁𝑃 𝑀𝑤𝑁𝑃𝑐 1
1 + 𝑋+ 𝐾𝑉𝑒𝑠 𝑀𝑤
𝑉𝑒𝑠𝑐 𝑋
1 + 𝑋 (3)
Eq. 2 is a slowly varying function of 𝑋 ranging between the Rayleigh ratio of the nanoparticles (𝑋
= 0) and that of the vesicles (𝑋 = ∞). Examples of ℛ𝑁𝐼(𝑋)-behavior are shown in Figs. 2 for 40
nm nanoparticles and 100/200 nm vesicles (continuous lines in grey). More details about these
calculations are provided in the next section.
III.2 – Nanoparticle-vesicle hybrid aggregates
Here we consider that the particle-vesicle interaction is attractive and leads to the formation of
mixed aggregates. The model is general and does not specify the interaction type. As the scattering
varies linearly with the weight-averaged molecular weight of the scatterers, the presence of
aggregates will lead to an excess scattering compared to the non-interacting case (Eq. 3). For sake
and 𝑛 vesicles. The aggregate molecular weight thus reads 𝑀𝑤𝐴𝑔𝑔 = 𝑚𝑀𝑤𝑁𝑃+ 𝑛𝑀𝑤𝑉𝑒𝑠. This later
equation has an important consequence, namely that at the critical stoichiometric ratio 𝑋𝐶, all the
particles and vesicles put in the solution will be in aggregates, leading to the relationships:
𝑋𝐶 =
𝑛 𝑚
𝑀𝑤𝑉𝑒𝑠 𝑀𝑤𝑁𝑃
(4)
𝑀𝑤𝐴𝑔𝑔 = 𝑛𝑀𝑤𝑉𝑒𝑠𝑋𝐶+ 1
𝑋𝐶 (5)
The above results also suggest that the overall mixing diagram can be decomposed in two regions:
for 𝑋 < 𝑋𝐶 nanoparticles are in excess and all added vesicles are consumed in the aggregate
formation and for 𝑋 > 𝑋𝐶, the vesicles are the main component and coexist with hybrid aggregates
in solutions. In the first regime, the hybrid aggregates are in equilibrium with free nanoparticles,
and in the second with free vesicles. Counting the different species as a function of 𝑋 leads to the
following expressions [38,46]:
𝐑𝐞𝐠𝐢𝐦𝐞 𝟏 → 𝑿 < 𝑿𝑪
ℛ𝐴𝑔𝑔(𝑐, 𝑋 < 𝑋𝐶) = 𝐾𝑁𝑃 𝑀𝑤𝑁𝑃𝑐 𝑋𝐶− 𝑋
𝑋𝐶(1 + 𝑋)+ 𝐾𝐴𝑔𝑔 𝑀𝑤
𝐴𝑔𝑔
𝑐𝑋(1 + 𝑋𝑐)
𝑋𝐶(1 + 𝑋) (6𝑎)
𝐑𝐞𝐠𝐢𝐦𝐞 𝟐 → 𝑿 > 𝑿𝑪
ℛ𝐴𝑔𝑔(𝑐, 𝑋 > 𝑋𝐶) = 𝐾𝐴𝑔𝑔 𝑀𝑤 𝐴𝑔𝑔
𝑐1 + 𝑋𝐶
1 + 𝑋 + 𝐾𝑉𝑒𝑠 𝑀𝑤
𝑉𝑒𝑠𝑐𝑋 − 𝑋𝑐
1 + 𝑋 (6𝑏)
The previous equations predict the scattering intensity in the case of aggregate formation. They
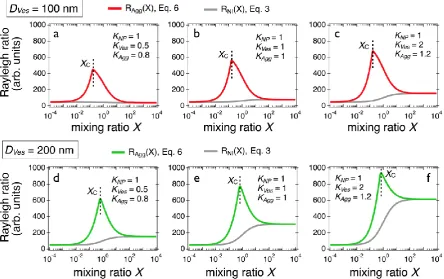
have been estimated for different sets of parameters, as shown in Fig. 2. Tests were performed
using two values of vesicular diameter, 100 and 200 nm and three scattering contrast conditions,
(𝐾𝑁𝑃, 𝐾𝑉𝑒𝑠, 𝐾𝐴𝑔𝑔) = (1, 0.5, 0.8), (1, 1, 1) and (1, 2, 1.2). The 𝐾-values were selected to encompass
a broad range of refractive index properties (𝐾 is indeed proportional to the square of the refractive
index increment 𝑑𝑛𝑠/𝑑𝑐) [45]. For these calculations, the stoichiometry was assumed to be 10
0.16 (𝐷𝑉𝑒𝑠 = 100 nm) and 0.64 (𝐷𝑉𝑒𝑠 = 200 nm). For the two sizes, the scattering peaks increase
with the lipid contrast. Also shown in the panels are the non-interacting predictions obtained from
Eq. 3. Note that these calculations could be easily extended to other types of assemblies such as
particles embedded in the membrane, vesicles decorated with nanoparticles or particles
internalized inside the membrane compartment. In these latter cases, the molecular weight 𝑀𝑤𝐴𝑔𝑔
and the stoichiometry should be adjusted to take into account the modeled structure.
Figure 2: a), b) and c) Scattering intensity obtained for 40 nm silica nanoparticles and 100 nm
lipid vesicles mixed solutions in the case of aggregate formation using three different sets of
contrasts, (𝐾𝑁𝑃, 𝐾𝑉𝑒𝑠, 𝐾𝐴𝑔𝑔) = (1, 0.5, 0.8), (1, 1, 1) and (1, 2, 1.2), respectively. The curves in red
refer to (𝑚 = 10, 𝑛 = 1)-aggregates (Eqs. 6) whereas those in grey arise from non-interacting
species (Eq. 3). 𝑚 and 𝑛 denotes the number of particles and of vesicles in the aggregates. d), e)
and f) Scattering intensity obtained for 40 nm silica nanoparticles and 200 nm lipid vesicles mixed solutions with the same set of contrasts as above.
For nano-SLB, there also exists a critical mixing ratio 𝑋𝐶 for which all the particles are covered
with a single lipid bilayer and form a supported lipid bilayer (Fig. 1a). At 𝑋𝐶, the nanoparticle and
vesicle surface area concentrations are equal, so :
𝑋𝐶 = 𝐴𝑁𝑃
𝐴𝑉𝑒𝑠 (7)
where 𝐴𝑁𝑃 and 𝐴𝑉𝑒𝑠 denote the specific surface areas for nanoparticles and vesicles respectively.
For particles of diameter 𝐷𝑁𝑃 and mass density 𝜌, one has 𝐴𝑁𝑃 = 6/𝜌𝐷𝑁𝑃. For vesicles, the
specific surface area reads 𝐴𝑉𝑒𝑠 = 𝑠𝐿𝒩𝐴/2𝑀𝑛𝐿, where 𝑠𝐿 is the area per polar head, 𝒩𝐴 the
Avogadro number and 𝑀𝑛𝐿 the lipid number-average molecular weight. In the following
simulation, we discuss the case of 40 nm silica particles (density 𝜌 = 2200 kg m-3) and of DPPC
lipids of area per polar head 𝑠𝐿 = 0.6 nm-2 (molecular weight 𝑀
𝑛𝐿 = 734 g mol-1). With this
assumption, one gets 𝐴𝑁𝑃 = 6.8×105 cm2 g-1 and 𝐴𝑉𝑒𝑠 = 2.4×106 cm2 g-1, and a value for 𝑋𝐶 =
0.28 that does not depend on the vesicle size. The total scattering cross section arises from the sum
of the coated and uncoated particle contributions. The scattering intensity then reads [23]:
𝐑𝐞𝐠𝐢𝐦𝐞 𝟏 → 𝑿 < 𝑿𝑪
ℛ𝑆𝐿𝐵(𝑐, 𝑋 < 𝑋𝑐) = 𝐾𝑁𝑃 𝑀𝑤𝑁𝑃𝑐
(𝑋𝑐 − 𝑋) 𝑋𝑐(1+ 𝑋)
+ 𝐾𝑆𝐿𝐵 𝑀𝑤𝑆𝐿𝐵𝑐
𝑋(1 + 𝑋𝑐) 𝑋𝐶(1 + 𝑋)
(8𝑎)
𝐑𝐞𝐠𝐢𝐦𝐞 𝟐 → 𝑿 > 𝑿𝑪
ℛ𝑆𝐿𝐵(𝑐, 𝑋 > 𝑋𝑐) = 𝐾𝑆𝐿𝐵 𝑀𝑤𝑆𝐿𝐵𝑐1 + 𝑋𝐶
1 + 𝑋 + 𝐾𝑉𝑒𝑠 𝑀𝑤
𝑉𝑒𝑠𝑐 (𝑋 − 𝑋𝑐)
(1+ 𝑋) (8𝑏)
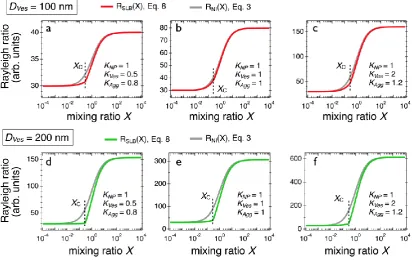
where 𝑀𝑤𝑆𝐿𝐵 = 𝑀𝑤𝑁𝑃(1 + 𝑋𝐶) and 𝐾𝑆𝐿𝐵 the scattering contrast for the SLB-coated particles. Note
the similarities of the 𝑋-dependences in Eqs. 6 and Eqs. 8. Differences however can be found in
the determination of 𝑋𝐶, in the contrast coefficients and in the molecular weights. The continuous
lines in red (resp. in green) in Figs. 3 were obtained from 40 nm particles and 100 (resp. 200 nm)
vesicles using the scattering contrast conditions of Fig. 2, (𝐾𝑁𝑃, 𝐾𝑉𝑒𝑠, 𝐾𝐴𝑔𝑔) = (1, 0.5, 0.8), (1, 1,
non-interacting species (Eq. 3), which are indicated as continuous lines in grey in each figure.
From this, it can be concluded that Job scattering plots display very different features for aggregate
and nano-SLB formation. On one side, embedded in the membrane, vesicles decorated with
nanoparticles or particles internalized inside the membrane or aggregates give rise to an increase
in light scattering and on the other side nano-SLBs are characterized by a decrease of the intensity
around a critical ratio. Note that under certain conditions (e.g. in Fig. 3b), this decrease is modest
and would not be detectable experimentally. An interaction strength parameter 𝑆𝐼𝑛𝑡 can be defined
from the integral beneath the Rayleigh ratio scattering curve ℛ(𝑋) relative to that of the
non-interacting model, such as [23]:
𝑆𝐼𝑛𝑡 = 1
ℛ(𝑐, 𝑋 = 0) 𝑐∫ (ℛ(𝑐, 𝑋) − ℛ𝑁𝐼(𝑐, 𝑋))𝑑𝑋 (9)
∞
0
To allow comparison between different particulate systems, the integral is normalized with respect
to the nanoparticle intensity and to concentration. According to Eq. 9, the aggregate and SLB
formations are characterized by 𝑆𝐼𝑛𝑡 > 0 and 𝑆𝐼𝑛𝑡 < 0 respectively, whereas the non-interacting
systems give 𝑆𝐼𝑛𝑡 = 0, a result that should also help in identifying the nature of the association
Figure 3: a), b) and c) Scattering intensity obtained for 40 nm silica nanoparticles and 100 nm
lipid vesicles forming supported lipid bilayers using different contrasts, (𝐾𝑁𝑃, 𝐾𝑉𝑒𝑠, 𝐾𝐴𝑔𝑔) = (1,
0.5, 0.8), (1, 1, 1) and (1, 2, 1.2), respectively. The curves in red refer to nano-SLB (Eqs. 8), whereas the curves in grey arise from non-interacting model (Eq. 3). d), e) and f) Same as before for 200 nm vesicles. Note that for the different conditions, the scattering intensity for the SLB formation remains below that of the non-interacting species.
III.4 – Comparison with experiments
In this part we study the interactions between nanoparticles and vesicles and compare Job
scattering plots obtained experimentally with the above predictions. For the experimental studies,
we used vesicles made from a mixture of DPPC, PG and POPG lipids in a ratio 80:10:10
synthesized via the evaporation-rehydratation technique. For the particles, we used the aluminum
and silicon oxide particles, Alumina (+), Silica (+) and Silica (-) of sizes around 40 nm. The data
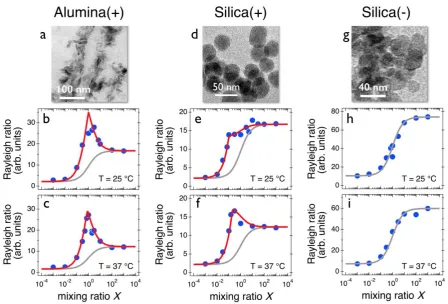
shown in Figs. 4 reveal that the scattering intensities ℛ(𝑋) are characterized by strong maxima,
indicating the formation of aggregated structures. These peaks correlate well with the
intensity for the Alumina (+) was successfully adjusted using Eqs. 6, leading a stoichiometry of 2
particles per vesicle at the two temperatures investigated. For Silica (+) the scattering maxima are
less prominent and shifted to lower X (𝑋𝐶 = 0.2), leading to a stoichiometry of 10 particles per
vesicle. For Silica (-), the scattering intensity varies monotonously as a function of 𝑋, in agreement
with the non-interacting prediction from Eq. 3. The results from Fig. 4 suggest that the
nanoparticle-vesicle aggregate formation is driven by electrostatic interaction. For same charge
systems, aggregation is not observed. Finally, none of the nanoparticles tested here display light
scattering signatures characteristic of SLBs.
Figure 4: a, d, e) Transmission electron microscopy images of alumina, positive and negative
IV – Conclusion
In this work we study the interaction of engineering nanoparticles with lipid vesicles and search
for prominent features pertaining to their scattering properties. The first goal is to provide tools to
characterize the different types of structures resulting from synthetic/biological membranes and
nanomaterials, an issue that is relevant in many biophysical applications. The second objective
consists in writing down quantitative predictions for the scattering of dilute solutions, allowing to
differentiate between the formation of aggregates and that of supported lipid bilayer. The
expressions for the scattering cross-sections are simple and analytical, and they show the relevance
of the Job scattering plot approach, as different association scenarios can be discriminated. It is
found for instance that the SLB formation is associated with a decrease of the scattering intensity,
whereas the aggregate formation is associated with an increase in light scattering. The models
proposed are also implementable as the form factor, the dispersity or the interaction of the particles
and vesicles can be taken into account into the equations. The result that emerges from the
experiments on alumina and silica particles is that electrostatics plays an important role in the
association, but is not sufficient to induce the formation of supported lipid bilayers.
Acknowledgments
ANR (Agence Nationale de la Recherche) and CGI (Commissariat à l’Investissement d’Avenir)
are gratefully acknowledged for their financial support of this work through Labex SEAM
(Science and Engineering for Advanced Materials and devices) ANR 11 LABX 086, ANR 11
the contracts: ANR-13-BS08-0015 (PANORAMA), ANR-12-CHEX-0011 (PULMONANO) and
ANR-15-CE18-0024-01 (ICONS) and by Solvay.
References
1. Brook, R. D.; Rajagopalan, S.; Pope, C. A.; Brook, J. R.; Bhatnagar, A.; Diez-Roux, A. V.; Holguin, F.; Hong, Y. L.; Luepker, R. V.; Mittleman, M. A.; Peters, A.; Siscovick, D.; Smith, S. C.; Whitsel, L.; Kaufman, J. D. Particulate matter air pollution and cardiovascular disease: An update to the scientific statement from the American Heart Association. Circulation 2010,121 (21), 2331-2378. doi:10.1161/CIR.0b013e3181dbece1
2. Xia, T.; Zhu, Y. F.; Mu, L. N.; Zhang, Z. F.; Liu, S. J. Pulmonary diseases induced by ambient ultrafine and engineered nanoparticles in twenty-first century. Nation. Sci. Rev. 2016,3 (4), 416-429. doi:10.1093/nsr/nww064
3. Bajaj, P.; Harris, J. F.; Huang, J. H.; Nath, P.; Iyer, R. Advances and Challenges in Recapitulating Human Pulmonary Systems: At the Cusp of Biology and Materials. ACS Biomater.
Sci. Eng 2016,2 (4), 473-488. doi:10.1021/acsbiomaterials.5b00480
4. Puisney, C.; Baeza-Squiban, A.; Boland, S. Mechanisms of Uptake and Translocation of Nanomaterials in the Lung. In Cellular and Molecular Toxicology of Nanoparticles, Saquib, Q.; Faisal, M.; Al-Khedhairy, A. A.; Alatar, A. A., Eds.; Springer International Publishing: Cham, 2018, pp 21-36.
5. Lopez-Rodriguez, E.; Perez-Gil, J. Structure-function relationships in pulmonary surfactant membranes: From biophysics to therapy. Biochimica Et Biophysica
Acta-Biomembranes 2014,1838 (6), 1568-1585. doi:10.1016/j.bbamem.2014.01.028
6. Wustneck, R.; Perez-Gil, J.; Wustneck, N.; Cruz, A.; Fainerman, V. B.; Pison, U. Interfacial properties of pulmonary surfactant layers. Adv. Colloids Interface Sci. 2005,117 (1-3), 33-58. doi:10.1016/j.cis.2005.05.001
7. Rascol, E.; Devoisselle, J. M.; Chopineau, J. The relevance of membrane models to understand nanoparticles-cell membrane interactions. Nanoscale 2016, 8 (9), 4780-4798. doi:10.1039/c5nr07954c
8. Michel, R.; Gradzielski, M. Experimental Aspects of Colloidal Interactions in Mixed Systems of Liposome and Inorganic Nanoparticle and Their Applications. Int. J. Mol. Sci. 2012, 13 (9), 11610-11642. doi:10.3390/ijms130911610
9. Froehlich, E. The role of surface charge in cellular uptake and cytotoxicity of medical nanoparticles. Int. J. Nanomed. 2012,7, 5577-5591. doi:10.2147/ijn.s36111
10. Troutier, A.-L.; Ladaviere, C. An overview of lipid membrane supported by colloidal particles. Adv. Colloids Interface Sci. 2007,133 (1), 1-21. doi:10.1016/j.cis.2007.02.003
11. Zhang, S. L.; Gao, H. J.; Bao, G. Physical Principles of Nanoparticle Cellular Endocytosis.
ACS Nano 2015,9 (9), 8655-8671. doi:10.1021/acsnano.5b03184
12. Conner, S. D.; Schmid, S. L. Regulated portals of entry into the cell. Nature 2003, 422 (6927), 37-44. doi:10.1038/nature01451
13. Bahrami, A. H.; Raatz, M.; Agudo-Canalejo, J.; Michel, R.; Curtis, E. M.; Hall, C. K.; Gradzielski, M.; Lipowsky, R.; Weikl, T. R. Wrapping of nanoparticles by membranes. Adv.
Colloids Interface Sci. 2014,208 (0), 214-224. doi:10.1016/j.cis.2014.02.012
15. Deserno, M.; Gelbart, W. M. Adhesion and wrapping in colloid-vesicle complexes. J.
Phys. Chem. B 2002,106 (21), 5543-5552. doi:10.1021/jp0138476
16. Mornet, S.; Lambert, O.; Duguet, E.; Brisson, A. The formation of supported lipid bilayers on silica nanoparticles revealed by cryoelectron microscopy. Nano Letters 2005,5 (2), 281-285. doi:10.1021/nl048153y
17. Mousseau, F.; Puisney, C.; Mornet, S.; Le Borgne, R.; Vacher, A.; Airiau, M.; Baeza-Squiban, A.; Berret, J. F. Supported pulmonary surfactant bilayers on silica nanoparticles: formulation, stability and impact on lung epithelial cells. Nanoscale 2017,9 (39), 14967-14978. doi:10.1039/c7nr04574c
18. Liu, J. W. Interfacing Zwitterionic Liposomes with Inorganic Nanomaterials: Surface Forces, Membrane Integrity, and Applications. Langmuir 2016, 32 (18), 4393-4404. doi:10.1021/acs.langmuir.6b00493
19. Sachan, A. K.; Harishchandra, R. K.; Bantz, C.; Maskos, M.; Reichelt, R.; Galla, H. J. High-Resolution Investigation of Nanoparticle Interaction with a Model Pulmonary Surfactant Monolayer. ACS Nano 2012,6 (2), 1677-1687. doi:10.1021/nn204657n
20. Pera, H.; Nolte, T. M.; Leermakers, F. A. M.; Kleijn, J. M. Coverage and Disruption of Phospholipid Membranes by Oxide Nanoparticles. Langmuir 2014, 30 (48), 14581-14590. doi:10.1021/la503413w
21. Savarala, S.; Ahmed, S.; Ilies, M. A.; Wunder, S. L. Formation and Colloidal Stability of DMPC Supported Lipid Bilayers on SiO2 Nanobeads. Langmuir 2010, 26 (14), 12081-12088. doi:10.1021/la101304v
22. Le Bihan, O.; Bonnafous, P.; Marak, L.; Bickel, T.; Trepout, S.; Mornet, S.; De Haas, F.; Talbot, H.; Taveau, J. C.; Lambert, O. Cryo-electron tomography of nanoparticle transmigration into liposome. J. Struct. Biol. 2009,168 (3), 419-425. doi:10.1016/j.jsb.2009.07.006
23. Mousseau, F.; Berret, J. F. The role of surface charge in the interaction of nanoparticles with model pulmonary surfactants. Soft Matter 2018, 14 (28), 5764-5774. doi:10.1039/c8sm00925b
24. Waisman, D.; Danino, D.; Weintraub, Z.; Schmidt, J.; Talmon, Y. Nanostructure of the aqueous form of lung surfactant of different species visualized by cryo-transmission electron microscopy. Clin. Physiol. Funct. Imaging 2007, 27 (6), 375-380. doi:10.1111/j.1475-097X.2007.00763.x
25. Schleh, C.; Muhlfeld, C.; Pulskamp, K.; Schmiedl, A.; Nassimi, M.; Lauenstein, H. D.; Braun, A.; Krug, N.; Erpenbeck, V. J.; Hohlfeld, J. M. The effect of titanium dioxide nanoparticles on pulmonary surfactant function and ultrastructure. Respir. Res. 2009,10, 90. doi:10.1186/1465-9921-10-90
26. Bernardino de la Serna, J.; Vargas, R.; Picardi, V.; Cruz, A.; Arranz, R.; Valpuesta, J. M.; Mateu, L.; Perez-Gil, J. Segregated ordered lipid phases and protein-promoted membrane cohesivity are required for pulmonary surfactant films to stabilize and protect the respiratory surface. Faraday Discuss. 2013,161 (0), 535-548. doi:10.1039/C2FD20096A
27. Curstedt, T.; Halliday, H. L.; Speer, C. P. A Unique Story in Neonatal Research: The Development of a Porcine Surfactant. Neonatology 2015, 107 (4), 321-329. doi:10.1159/000381117
28. De Backer, L.; Braeckmans, K.; Stuart, M. C. A.; Demeester, J.; De Smedt, S. C.; Raemdonck, K. Bio-inspired pulmonary surfactant-modified nanogels: A promising siRNA delivery system. J. Control. Release 2015,206, 177-186. doi:10.1016/j.jconrel.2015.03.015 29. Wohlleben, W.; Driessen, M. D.; Raesch, S.; Schaefer, U. F.; Schulze, C.; von Vacano, B.; Vennemann, A.; Wiemann, M.; Ruge, C. A.; Platsch, H.; Mues, S.; Ossig, R.; Tomm, J. M.; Schnekenburger, J.; Kuhlbusch, T. A. J.; Luch, A.; Lehr, C. M.; Haase, A. Influence of agglomeration and specific lung lining lipid/protein interaction on short-term inhalation toxicity.
30. Michel, R.; Plostica, T.; Abezgauz, L.; Danino, D.; Gradzielski, M. Control of the stability and structure of liposomes by means of nanoparticles. Soft Matter 2013, 9 (16), 4167-4177. doi:10.1039/c3sm27875a
31. Rasch, M. R.; Rossinyol, E.; Hueso, J. L.; Goodfellow, B. W.; Arbiol, J.; Korgel, B. A. Hydrophobic Gold Nanoparticle Self-Assembly with Phosphatidylcholine Lipid: Membrane-Loaded and Janus Vesicles. Nano Letters 2010,10 (9), 3733-3739. doi:10.1021/nl102387n 32. Michel, R.; Kesselman, E.; Plostica, T.; Danino, D.; Gradzielski, M. Internalization of Silica Nanoparticles into Fluid Liposomes: Formation of Interesting Hybrid Colloids. Angew.
Chem.-Int. Edit. 2014,53 (46), 12441-12445. doi:10.1002/anie.201406927
33. Mousseau, F.; Le Borgne, R.; Seyrek, E.; Berret, J.-F. Biophysicochemical Interaction of a Clinical Pulmonary Surfactant with Nanoalumina. Langmuir 2015, 31 (26), 7346-7354. doi:10.1021/acs.langmuir.5b01639
34. Reviakine, I.; Johannsmann, D.; Richter, R. P. Hearing what you cannot see and visualizing what you hear: Interpreting quartz crystal microbalance data from solvated interfaces. Anal. Chem.
2011,83 (23), 8838-8848. doi:10.1021/ac201778h
35. Dubochet, J. On the Development of Electron Cryo-Microscopy (Nobel Lecture).
Angewandte Chemie (International ed. in English) 2018, doi:10.1002/anie.201804280
36. Job, P. Studies on the formation of complex minerals in solution and on their stability. Ann.
Chim. France 1928,9, 113-203.
37. Renny, J. S.; Tomasevich, L. L.; Tallmadge, E. H.; Collum, D. B. Method of Continuous Variations: Applications of Job Plots to the Study of Molecular Associations in Organometallic Chemistry. Angew. Chem.-Int. Edit. 2013,52 (46), 11998-12013. doi:10.1002/anie.201304157 38. Fresnais, J.; Lavelle, C.; Berret, J.-F. Nanoparticle Aggregation Controlled by Desalting Kinetics. J. Phys. Chem. C 2009,113 (37), 16371-16379. doi:10.1021/jp904665u
39. Mousseau, F.; Vitorazi, L.; Herrmann, L.; Mornet, S.; Berret, J. F. Polyelectrolyte assisted charge titration spectrometry: Applications to latex and oxide nanoparticles. J. Colloid Interface
Sci. 2016,475, 36-45. doi:http://dx.doi.org/10.1016/j.jcis.2016.04.036
40. Oikonomou, E. K.; Mousseau, F.; Christov, N.; Cristobal, G.; Vacher, A.; Airiau, M.; Bourgaux, C.; Heux, L.; Berret, J. F. Fabric Softener–Cellulose Nanocrystal Interaction: A Model for Assessing Surfactant Deposition on Cotton. J. Phys. Chem. B 2017, 121 (10), 2299-2307. doi:10.1021/acs.jpcb.7b00191
41. Torrisi, V.; Graillot, A.; Vitorazi, L.; Crouzet, Q.; Marletta, G.; Loubat, C.; Berret, J.-F. Preventing Corona Effects: Multiphosphonic Acid Poly(ethylene glycol) Copolymers for Stable Stealth Iron Oxide Nanoparticles. Biomacromolecules 2014, 15 (8), 3171-3179. doi:10.1021/bm500832q
42. Reinhardt, N.; Adumeau, L.; Lambert, O.; Ravaine, S.; Mornet, S. Quaternary Ammonium Groups Exposed at the Surface of Silica Nanoparticles Suitable for DNA Complexation in the Presence of Cationic Lipids. J. Phys. Chem. B 2015, 119 (21), 6401-6411. doi:10.1021/acs.jpcb.5b01834
43. Vitorazi, L.; Ould-Moussa, N.; Sekar, S.; Fresnais, J.; Loh, W.; Chapel, J. P.; Berret, J.-F. Evidence of a two-step process and pathway dependency in the thermodynamics of poly(diallyldimethylammonium chloride)/poly(sodium acrylate) complexation. Soft Matter 2014, 10 (47), 9496-9505. doi:10.1039/c4sm01461h
44. Giamblanco, N.; Marletta, G.; Graillot, A.; Bia, N.; Loubat, C.; Berret, J.-F. Serum Protein-Resistant Behavior of Multisite-Bound Poly(ethylene glycol) Chains on Iron Oxide Surfaces. ACS
Omega 2017,2 (4), 1309-1320. doi:10.1021/acsomega.7b00007
45. Lindner, P.; Zemb, T. Neutrons, X-rays and Light : Scattering Methods Applied to Soft
Condensed Matter. Elsevier: Amsterdam, 2002.
46. Berret, J.-F. Stoichiometry of electrostatic complexes determined by light scattering.