a
Corresponding author: [email protected]
Velocity measurements of the liquid - gas flow using gamma absorption
and modified conditional averaging
Robert Hanus1,a, Marcin Zych 2, Adam Kowalczyk1 and Leszek Petryka2
1
Rzeszow University of Technology, Rzeszow 35-959, Poland 2
AGH University of Science and Technology, Krakow 30-059, Poland
Abstract. The paper presents idea and an exemplary application of gamma-absorption in the measurement of gas bubbles transportation in a gas-liquid mixture flow through a horizontal pipeline. In the tests on laboratory installation two 241Am radioactive sources and probes with NaI(Tl) scintillation crystals have been used. For analysis of electrical signals obtained from detectors the modified conditional averaging of the absolute value of delayed signal (CAAV) is proposed. The proposed method is based on the quotient of classical cross-correlation (CCF) and CAAV. Results of the time delay estimation and gas-phase velocity measurements are compared with one obtained using CCF. The combined uncertainties of the mean velocity of air bubbles evaluation in the presented experiment did not exceed 2.1% (CCF) and 1.7% (CCF/CAAV), which is a satisfactory result in industrial applications.
1 Introduction
The flow when gas is transporting by liquid commonly occurs in industry, e.f. in nuclear, chemical and petrochemical engineering. To describe such flow it is required to record variation of the velocity or flow rate of each components, as well as their mixing and distribution between the transported streams. Direct measuring of these values is difficult, and requires the use of advanced techniques, employing computer tomography (resistive, capacitive, optical and X-rays), Coriolis flowmeters, optical equipment, and nuclear performances [1 - 9].
The routine mentioned lastly uses tracers injected under certain conditions into the flow (radiotracer method), or is based on the use of sealed radioactive sources (absorption method) [5 - 9]. Often in both cases scintillation probes are mounted outside the analysed stream as detectors of the radiation. The advantage of such methods is the simplicity and relatively high accuracy of provided information. The absorption measurement is non-invasive, and at the same time allows determining the velocity and concentration of a minority phase with use of the same equipment.
Frequently in such measurements the mutually delayed stochastic signals are provided by probes situated on walls of the pipeline or open channel. The time delay of these signals is used to determine the velocity of the minority phase and other flow parameters. The processing of measured signals usually is disturbed by noise, so requires the use of signal conditioning and statistical processing in the time or frequency domain.
The classical methods of the time delay estimation applied for stationary random signals include the correlation function (CCF) and the phase of cross-spectral density [9 - 16]. Less popular method includes, among others, correlation analysis with the Hilbert Transform [13, 17, 18], differential methods [19 - 21] and methods based on the conditional averaging of the signals [22 - 25].
The paper consists of five sections. In the next one a basic of application of the gamma-absorption for two-phase flow evaluation and short description of the laboratory installation are presented. The section 3 presents methods of the signal analysis: CCF, conditional average value of the absolute value of delayed signal (CAAV) and proposed combined CCF/CAAV function. In this section the principle of calculation of the velocity of air bubbles in the gas-liquid mixture flow through horizontal pipeline is also described. In the next section exemplary results of measurements of the time delay and mean velocity of gaseous phase transported by liquid and their uncertainties are presented. The last section contains the summary of the presented study and final conclusions.
2 Gamma-absorption in two-phase flow
evaluation and laboratory installation
The gamma absorption is based on exponential decreasing of a monoenergetic gamma beam in function of composition and geometry of absorbent:
C
Owned by the authors, published by EDP Sciences, 2015
)
exp( x
J
J = 0 −η⋅μ⋅ , (1)
where J0 is the inlet to absorbent radiation intensity, J is the outlet intensity detected after the beam has traveled a distance x through the absorbing materials, and μ represents consequently the density and mass absorption coefficient of these materials [7].
If the basic equation is applied to an air-water mixture flow then the corresponding expression is:
[
( )]
exp A A A W W W
0 x x
J
J = −η ⋅μ ⋅ +η ⋅μ ⋅ , (2)
where indexes A and W for , μ and x denote the air and the water respectively.
The changes of the intensity of radiation are recorded by the scintillation detectors and converted into output electrical impulses [6].
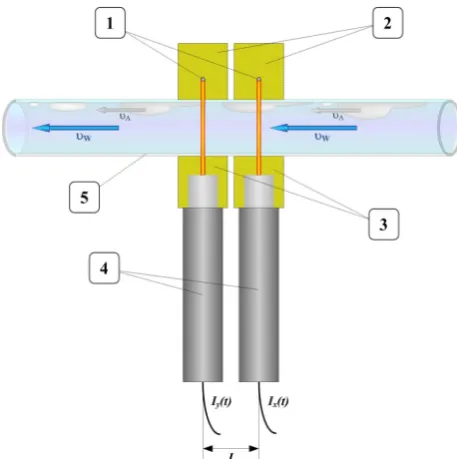
The gamma-absorption measuring stand is presented in figure 1. Two sealed radioactive sources (1) emit gamma radiation beams shaped by collimators (2). Photons pass through the pipeline with analyzed air-water mixture (5) and collimator (3) before achieved the detector (4). In the presented experiment two sets consisting of linear 241Am sources with an activity of 100 mCi and probes with NaI(Tl) scintillation detectors are located with the distance of L = 97 mm between them. At the outputs of scintillation probes count rates Ix(t) and Iy(t) are recorded and processed after removal a background contribution. These values depend on the local condition of the flowing medium.
Figure 1. The γ-ray absorption stand: 1 – gamma radiation source, 2 – collimator of source, 3 – colli-mator of detector, 4 – scintillation probe, 5 – pipeline, A, W – velocities of air and water respectively.
The measuring equipment presented in figure 1 was applied in the Industrial Radiometry Laboratory of the AGH University of Science and Technology in Krakow, Poland in an experimental hydraulic installation show in figure 2.
Figure 2. Scheme of experimental hydraulic installation: 1 - γ-ray sealed source, 2 – scintillation probe, 3 – ultrasonic flow meter, 4 – pump, 5 – air compressor, 6 – air-removing vessel, 7 – air nozzle, 8 – shifting system.
The installation consists of a transparent acrylic glass tube with internal diameter 30 mm and a length of 4.5 m, to which water is pumped by a rotary pump (4) and air from the compressor (5) by an injector nozzle (7). Due to that the controlled mixture of water and air supply the measuring pipe and flowing up to the air-removing tank (6). The measurement of air bubbles velocity was arrange by the measuring system consisting of two γ-radioactive sources (1) and two scintillation probes (2). The measuring set is mounted on a special trolley (8), which allows moving the set along the pipeline. Independently water flow rate was continuously measured by Uniflow 990 ultrasonic flowmeter (3). The rotary pump (4) controlled by a waver allows selection of water velocity in the measuring pipe between 0.5 - 2.5 m / s.
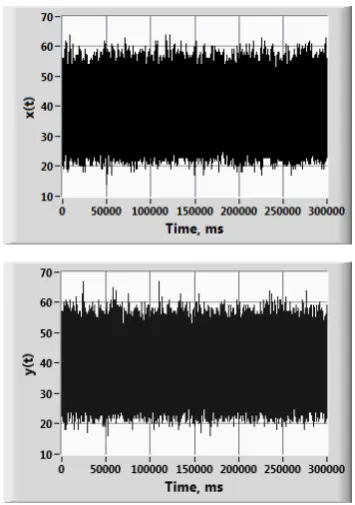
The data acquisition equipment is comprised of PC with the dedicated counters card connected to a USB port. The voltage pulses Ix(t) and Iy(t) obtained from the detectors counted within the sampling time t = 1 ms create mutual delayed stochastic signals x(t) and y(t) [20, 21, 23, 26]. An exemplary time records of the signals (after centering and filtration) obtained for the air-water flow in the experiment denoted as “BUB010” are presented in figure 3.
3 The analysis of signals
The analyses of signals from scintillation probes allow determining of the transportation time delay 0 and then the mean velocity A of gas phase transportation, from the following formula:
0 /τ
υA =L . (3)
The most known classical methods of time delay estimation of an ergodic random signals is based on the cross - correlation function, defined as follow [13]:
³
+=
∞ →
T
T
xy xt yt dt
T R
0
) ( ) ( 1 )
where T is the averaging time, – time delay.
Figure 3. Time records of signal x(t) and y(t)(after prepro-cessing) obtained in the BUB010 experiment.
Following normalisation, the correlation (4) is equal to: y x xy xy R σ σ τ τ ρ ⋅ = ( ) )
( , (5)
where x and y are standard deviations of x(t) and y(t) signals respectively.
The 0transportation time delay is determined on the base of position of the main maximum of the CCF.
The
discrete estimator for the cross-correlation function can be expressed by the following formula:¦
− = ⋅ + = 1 0 ) ( ) ( 1 ) ( ˆ N nxy x n y n
N
R τ τ , (6)
where N is the number of values of discrete x(n) and y(n) signals, and n = t / t [28 - 30].
In papers [22 - 25] for analysis of stochastic signals the conditional averaging has been proposed. In this technique for the time delay determination the principle of the minimum of the conditional expected value was used. This value of the delayed signal y(t) for x(t) = 0 can be presented by the relationship:
{ }
y y p( )
y dyE A A x x x y y
³
∞ = = = = = ⋅ = 0 0 00 , (7)
where for the simplifying of the notation it was assumed that y(t) = y, x(t) =x, and
(
)
0
= x
y
p is the conditional
probability of the density function of the signal absolute value y for x = 0 [22].
The normalized ay(τ) function is defined as:
max ) ( ) ( ) ( τ τ τ y y y A A
a = . (8)
A good estimator of the conditional expected value (7) is CAAV. In practice it is determined by the detection of the signal x passes through zero and then recording the signals y and averaging the absolute values of them. The discrete estimator CAAV can be written in the following form: 0 ) ( ) ( 1 0 ) ( ) ( ) ( ˆ 1 = + = = + =
¦
= x n
n y M n x n y A M n
y τ τ τ , (9)
where M is the number of passes through the zero of the signal x(n).
In the case of CAAV the determination of 0is based on finding the main minimum of this function.
In this work we propose to use the combined CCF/CAAV calculation for analysis of signals obtained in gamma-absorption measurements of the liquid-gas mixture transportation. This calculation is as follows:
) ( ) ( ) ( / τ τ τ y xy CAAV CCF A R
R = , (10)
or for normalized CCF and CAAV functions:
) ( ) ( ) ( / τ τ ρ τ y xy CAAV CCF a
R = . (11)
In theoretical considerations of the noise–free signals a small positive numbers should be added to the denominators of the equations (10) and (11) to avoid division by zero. However, for the analysis of real signals this is not necessary.
4 Exemplary results
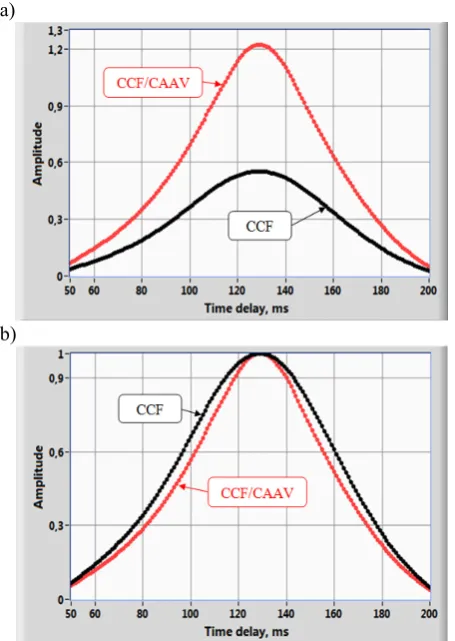
Figure 4a presents plots of the normalized CCF (5) and CCF/CAAV (11) characteristics obtained for signals recorded in the BUB010 experiment. In figure 4b additional normalization of each function by its maximum value was done. In the BUB010 experiment, the laminar flow was analyzed and the bandwidth of signals was about 20 Hz. The data acquisition parameters in this experiment were: N = 300000, t = 1 ms. In both methods, the filtration of recorded signals was used in order to noises reduction.
In calculations of transportation time delay the selected range of data around the maximum of the CCF and CCF/CAAV have been interpolated with the Gaussian probability density distribution p():
( )
(
)
¸¸ ¹ · ¨ ¨ © § ⋅ − − ⋅ + = 2 2 0 0 2 ˆ exp 2 1 σ τ τ π σ τ pp , (12)
a)
b)
Figure 4. (a) Comparison of the normalized CCF and CCF/CAAV functions calculated in the BUB010 experiment, (b) the same functions after additional amplitude normalization.
Therefore the τˆ0 estimator of the mean transportation time is determined as the first moment of the fitted distributions [10, 20, 27] and the standard uncertainty
( )
τˆ0u is given by:
( )
quτ =ˆ0 σ , (13)
where q – number of points selected for interpolation.
In table 1 results of the time delay estimation and its standard uncertainty obtained in the BUB010 experiment for q = 126 are presented.
Table 1. Time delay estimation in the BUB010 experiment.
Method Time delay 0
τˆ ,ms
Standard uncertainty
( )
τˆ0u , ms
CCF 128.45 2.65
CCF/CAAV 128.30 2.27
The combined standard uncertainty uc(A) of the gas phase velocity, with negligible small uncertainties of the acquisition set, depends on an inaccuracy of uncorrelated L and τˆ0 values determination:
2 / 1
0 2 2
0 2
2
) ˆ ( ˆ ) ( )
(
» » ¼ º «
« ¬ ª
¸¸¹ · ¨¨© §
∂ ∂ +
¸ ¹ · ¨ © §
∂ ∂
= τ
τ υ υ
υ u L u
L
uc A A A , (14)
where u(L) is the standard uncertainty of the distance between the detectors.
Results of the mean velocity A and its combined uncertainty uc(A) [31] obtained in the BUB010 experiment are presented in the table 2.
Table 2. Mean velocity of air A and its uncertainty uc(A).
Method Mean velocity
A, m / s
Combined uncertainty
uc(A), m / s
CCF 0.755 0.016
CCF/CAAV 0.756 0.013
5
Conclusions
Based on the preliminary results it can be stated that the CCF/CAAV method can be used in gamma-absorption measurements for mean gas bubbles velocity determination of the liquid-gas mixture flow in the horizontal pipeline. The results of the time delay and air bubbles velocity obtained in the BUB010 experiment by CCF/CAAV and CCF methods were similar. The standard uncertainty of time delay measurement using CCF/CAAV gives 8.6% lower value than one delivered by the CCF alone. The combined uncertainties of the mean velocity of air bubbles evaluation in the presented experiment did not exceed 2.1% (CCF) and 1.7% (CAAV), which are satisfactory results in industrial applications.
References
1. G. Falcone, G.F. Hewitt, C. Alimonti, Multiphase flow metering: principles and applications (Elsevier Amsterdam, 2009)
2. M. Bottin, et al, Int. J. Multiphas. Flow 60, 161-179 (2014)
3. T. Xue, L. Qu, Z. Cao, T. Zhang, Flow Meas. Instrum. 27, 29–36 (2012)
4. M.R. Rzasa, Nucl. Eng. Des. 239, 699-707 (2009) 5. G.A. Johansen, P. Jackson, Radioisotope gauges for
industrial process measurements (John Wiley, New York 2004)
6. Z. Yu, B. Qincheng, H. Richa, Appl. Therm. Eng.
60, 398-410 (2013)
7. W.A.S. Kumara, B.M. Halvorsen, M.C. Melaaen, Int. J. Multiphas. Flow 36, 467-480 (2010)
8. B.K. Arvoh, R. Hoffmann, M. Halstensen, Flow Meas. Instrum. 23, 56-65 (2012)
10. M. Zych, et al, Flow Meas. Instrum. 35, 11–15 (2014)
11. L. Petryka, et al, Prz. Elektrotech. 88 (1b), 185-188 (2012)
12. E. Pawlowski, Proc. SPIE 4516, 181-186 (2001) 13. J.S. Bendat, A.G. Piersol, Random data - analysis
and measurement procedures (John Wiley, New York, 2010)
14. V. Mosorov, Meas. Sci. Technol. 17, 753-760 (2006)
15. R. Hanus, Prz. Elektrotech. 84 (12), 301-303 (2008) 16. A.G. Piersol, IEEE Trans. Acoust. Speech Sign
Proc. 29, 471-477 (1981)
17. J.S. Bendat, The Hilbert Transform and applications to correlation measurements Brüel&Kjær BT0008-11 (Naerum, Denmark, 1985)
18. R. Hanus, Prz. Elektrotech. 88 (10b), 39-41 (2012) 19. G. Jacovitti, G. Scarano, IEEE Trans. Sign. Proc 41,
525-533 (1993)
20. R. Hanus, L. Petryka, M. Zych, Flow Meas. Instrum. 40, 58–63 (2014)
21. R. Hanus, M. Zych, L. Petryka, JPCS 530 012042 (2014)
22. A. Kowalczyk et al, Metrol. Meas. Syst. 18, 335-342 (2011)
23. R. Hanus, et al, Proc. 2012 IEEE Mediterranean Electrotechnical Conference MELECON 2012, 144-147 (2012)
24. A. Kowalczyk, A. Szlachta, Prz. Elektrotech. 86 (1), 225-228 (2010)
25. R. Hanus, Prz. Elektrotech.86 (6), 232-235 (2010) 26. D. Swisulski, Prz. Elektrotech. 88 (10b), 29-31
(2012)
27. L. Petryka, et al, Proc. 10th ISOPE Ocean Mining & Gas Hydrates Symp. OMS-2013, 230-233 (2013) 28. M.S. Beck, A. Plaskowski, Cross correlation
flowmeters - their design and application (Adam Hilger, Bristol, 1987)
29. W.Q. Yang, M.S. Beck, Flow Meas. Instrum. 8, 77-84 (1998)
30. S.L. Soo (ed.), Instrumentation for fluid-particle flow (Noyes Publications, New Jersey, 1999)