1607 THE PRACTICE OF DIVIDEND-YIELD STRATEGIES IN THE GREATER
CHINA REGION
Chin-Sheng Huang
Department of Finance, National Yunlin University of Science and Technology, Taiwan
Chun-Fan You
Department of Finance, Trans World University, Taiwan
Jiang-Chuan Huang
Department of Finance, Trans World University, Taiwan
Su-Wen Kuo
Department of Finance, Ling Tung University of Science and Technology, Taiwan
ABSTRACT
Studies have shown that, under equally-weighted portfolio returns, dividend-yield strategies often
exhibit anomalies in U.S. and European markets. However, Fama (1998) argued that long-term
abnormal returns would disappear or shrink considerably if value-weighted returns are adopted.
This study is the first to use an equally-weighted measure to show that this phenomenon is
prevalent in the broad Chinese markets, covering China, Hong Kong, and Taiwan. While adopting
the three-factor model and value-weighted measure, the differences between the returns of dividend
yield portfolio and the market index still remain significantly positive. Further, the results remain
largely unchanged after accounting for market liquidity. This phenomenon occurs during the
two-year period immediately following dividend-announcements and gradually disappears in
subsequent years.
© 2014 AESS Publications. All Rights Reserved.
Keywords: Dividend yield, Trading strategies, Three-factor model, The Greater China region. JEL Classification: G11.
Contribution/ Originality
This study adopts adopting the three-factor model and value-weighted measure, the differences between the returns of dividend yield portfolio and the market index still remain significantly positive. The results of this research may help shed more light on dividend-yield strategies among the white-hot in the Greater China region.
Asian Economic and Financial Review
1608 1. INTRODUCTION
since McQueen et al. (1997) found that a Dow-10 portfolio had a statistically higher mean return in the U.S. market over the 50 years from 1946 to 1995, many financial researchers have presented evidence declaring “higher dividends = higher returns” among North American and European markets (Visscher and Filbeck, 2003; Brzeszczyński and Gajdka, 2007). For international equity markets, Eun and Huang (2007) found that investors in China are willing to pay a premium for high-dividend-paying stocks. Kyriazis and Diacogiannis (2007) also showed that stocks with high-dividend-yields are associated with significantly higher returns in the Athens market. The rationale behind these findings could be based on the following arguments. Firstly, investors are essentially acknowledging the fundamental proposition of dividend signaling hypothesis; managers may tend to increase their dividends, and thereby raising the dividend yields, to convey the message of potential future profits (Nissim and Ziv, 2001; Harada and Nguyen, 2005). In particular, investors generally regard the dividends of firms ranked at the very top of dividend yields as having stronger information content than others.
Secondly, for corporate operational performance, Arnott and Asness (2003) found that high aggregate current payouts are associated with high aggregate future earnings growth for overall market. Zhou and Ruland (2006), ap Gwilym et al. (2006) and Huang et al. (2009) also found that high payouts are related to high future earnings growth for individual stocks. The „free cash flow‟ hypothesis supports the empirical findings that high dividend payout ratios are favorable to future earnings growth. The free cash flow hypothesis posits that managers of companies with ample free cash flow will be tempted to over-invest rather than pay it out to shareholders (Jensen, 1986). Therefore, a high-dividend payout policy can greatly reduce the agency costs of firms with poor investment opportunities.
Thirdly, from the perspective of behavioral finance, (Edwards, 1968) maintained that market investors behave conservatively when facing new market information. Barberis et al. (1998)
pointed out that a conservative bias can cause investors to react to dividend announcements slowly.
Koch and Sun (2004) confirmed that, after firms increase their dividends, investors do not consider the signal information to be permanent until the subsequent quarter earnings show positive growth.
Asem (2009) recently claimed that market generally under-reacts toward both dividend-increasing announcements of winners and the dividend-decreasing announcements of losers. Therefore, the trading profits involved in dividend-yield portfolio might simply be momentum effects from the under-reaction of dividend announcements.
Finally, why are dividend-yield portfolios taken for granted in stock markets? According to
1609 returns. Particularly, senior investors and pension fund managers who specifically request cash
dividends are more in favor of the dogs strategies (Baker and Wurgler, 2004; Graham and Kumar, 2006; Eun and Huang, 2007).
Although many studies support dividend-yield strategies, financial economists have not yet reached consensus on this issue (Miller and Modigliani, 1961; Filbeck and Visscher, 1997). Black and Scholes (1974) forcefully argued that „If a corporation could increase its share price by increasing (or decreasing) its payout ratio, then many corporations would do so, which would saturate the demand for higher (or lower) dividend yield and would bring about an equilibrium wherein marginal changes in a corporation‟s dividend policy would have no effect on the price of its stock.‟ Empirical evidence from Black and Scholes (1974) indicates that neither the whole sample period, 1936-1966, nor three ten-year sub-periods can significantly support the “higher dividends = higher returns” concept.
Regarding the issue of research methodology, Fama (1998) indicated that apparent anomalies in long-term post-event returns typically shrink significantly, and often disappear, when event firms are value-weighted rather than equally-weighted. Fama (1998) further argued for a value-weighted measure for two reasons: (i) value-value-weighted returns give the right perspective on an anomaly because they more accurately capture the total wealth effects experienced by investors; (ii) equally-weighted portfolio returns give more weight to small stocks, which increases the severity of misspecification problems (bad-model) in inferences from equally-weighted returns. Small stock sampling may also involve a survivorship bias. Wang (2000) showed that when ignoring a subset of small firms delisted due to bankruptcy or other causes during the sample period, the size effect may trigger an upward bias in reported returns. Ultimately, further research is necessary to answer the question of whether “higher dividends = higher returns.”
We investigate the issue of dividend-yield strategies based on the inconclusive evidence of previous studies and controversial research methods. We then adopt the following considerations to accommodate market practices. Firstly, this paper explores the dividend-yield portfolios whether exhibit anomalies in the content of CAPM and three-factor mode. Secondly, we examine a wide variety of measures of portfolio weights shown in literature to test the main findings. Thirdly, this study tests the phenomenon of “higher dividends = higher returns” within ten sub-samples of the original high-dividend-yield portfolio. Fourthly, to simultaneously account for the preferences of individuals and institutional investors, we investigate the abnormal returns of top 30 portfolios and high-dividend-yield portfolios, respectively. The results of this research may help shed more light on dividend-yield strategies among the white-hot in the Greater China region.
1610 2. DATA DESCRIPTION
This study examines empirical data of corporate dividends, financial ratios, and stock prices provided by Taiwan Economic Journal (TEJ). However, the MSCI Golden Dragon Index of Data Stream International was employed as the market benchmark of the Greater China region because it is a free-float weighted equity index consisting of equities from China, Hong Kong, and Taiwan. The data frequency mainly is annual, except for the monthly stock prices. The dividend sample period spans from 2000 to 2008. When calculating portfolio returns, additional data of 2009 were added to the original sample. Furthermore, this study adopts the following criteria for data selection:
i. Companies were exclusively drawn from non-financial industries; companies in financial industry were excluded because the financial structure differs from others.
ii. Companies with incomplete financial data, preferred shares, or TDRs were excluded from the sample.
iii. The top 1% of dividend yield samples was removed.
This study first drew 23,284 non-financial firm samples. After excluding 730 incomplete financial data firms and 135 abnormal dividend yield samples, the final sample included 22,419 samples, including 12,949 dividend-distributing firms, with the rest being no-dividend firms. The dividend sample was further partitioned into five categories of dividend-subgroups in descending order of dividend yield; in addition, the firms of zero-dividend were added as the sixth category. Table 1 presents summary statistics of the empirical data.
The highest dividend-yield subgroup exhibits the highest average dividend yield of 10.55 per cent, as indicated in Panel A of Table 1, in contrast to the second subgroup with far lower dividend level at 5.23 per cent. This study defines dividend yield as the ratio of cash dividend and the year-end stock price. Panel B of Table 1 displays the size of the six dividyear-end-subgroups. The zero-dividend subgroup and the highest subgroup respectively are with the smallest size (US$402 Mil.) and the second least size (US$627 Mil.). This study employs market value as the measure of firm size. The market value was calculated in two steps. Firstly, the local currency denominated year-end market value was obtained by multiplying the number of outstanding shares with the year-year-end share price. The year-end market value in local currency was then converted into US dollar denominated firm size using the year-end Dollar exchange rate in each issuing market. These figures imply that the abnormal returns of these two subgroups are likely related to the prevalent size effect.
1611 Table-1. Summary statistics for dividend-yield groups a
2000 2001 2002 2003 2004 2005 2006 2007 2008 2009 Avg. Panel A: Avg. Dividend Yield (%)
High 11.95 10.94 11.80 10.49 11.42 12.09 8.62 7.41 10.27 - 10.55 #2 4.75 4.82 6.19 5.66 6.11 6.33 4.84 3.51 4.92 - 5.23 #3 2.54 2.83 4.01 3.75 4.07 4.28 3.06 1.73 2.73 - 3.22 #4 1.45 1.69 2.47 2.43 2.75 2.79 1.87 0.89 1.55 - 1.99 Low 0.69 0.69 1.07 1.24 1.35 1.36 0.86 0.37 0.73 - 0.93 zero div. 0.00 0.00 0.00 0.00 0.00 0.00 0.00 0.00 0.00 - 0.00 Panel B: Avg. ME (US$ Mil.)
High 546 640 469 524 620 555 719 1079 491 - 627
#2 777 801 742 699 892 1273 1228 3827 2235 - 1386
#3 700 943 844 982 864 935 1928 5488 3152 - 1760
#4 844 538 709 1047 1237 1520 2906 3652 1374 - 1536
Low 800 834 556 1283 727 1385 1523 3480 1295 - 1320
zero div. 566 392 244 276 322 253 427 815 327 - 402
Panel C: Avg. Invest Returns in Yt+1 (%) b
High - 31.91 26.48 66.23 15.91 20.10 84.19 78.36 -43.57 155.40 50.39 #2 - 6.07 -1.56 37.45 6.43 6.62 68.48 75.72 -51.75 125.36 33.34 #3 - -9.36 -11.56 29.27 6.47 3.29 50.85 104.39 -53.35 126.10 31.93 #4 - -21.42 -20.06 7.05 -3.38 -0.89 63.10 104.32 -57.00 137.04 28.77 Low - -19.97 -21.77 1.14 -7.77 -9.16 56.41 124.95 -60.29 117.92 25.18 zero div. - 11.89 6.13 91.22 17.22 15.49 99.16 170.36 -54.30 201.09 68.30 Panel D: Avg. Invest Returns in Yt+2 (%) c
High - - 25.36 56.10 8.73 9.06 72.09 109.82 -48.44 119.99 44.09 #2 - - 1.60 52.80 3.94 7.09 70.98 73.04 -50.74 134.81 36.69 #3 - - -11.28 18.85 5.83 2.02 64.96 102.32 -53.96 144.35 34.14 #4 - - -14.68 0.95 -6.45 -5.14 61.92 100.80 -53.52 142.76 28.33 Low - - -24.09 -6.87 -12.43 -7.48 64.54 97.96 -58.39 139.82 24.13 zero div. - - 8.84 110.76 25.08 14.77 100.83 168.41 -52.76 201.41 72.17 Notes:
a This table reports summary statistics for dividend-yield groups in the period, 2000-2008. For each year in the sample
period, the table shows the average dividend yield, size, and investment return of the six dividend-yield groups. Specifically, Dividend Yield is the ratio of dividend and stock price at the year-end, ME denotes market value by stock price timing shares outstanding (US$ Mil.)
b Invest Returns in Y
t+1 is the investment returns of dividend-yield portfolios constructed at the year-end of Yt and
invested in Yt+1 which is the dividend-announcement year. c Invest Returns in Y
t+2 is the investment returns of the same dividend-yield portfolios in Yt+2.
3. METHODOLOGY
A wide variety of factors could affect portfolio returns, including individual characteristics of constituent shares, weighting methods, market timing, the definition of dividend-yields, and risk-adjusted models. The above factors and models are described below.
1612 This study mainly employs equally-weighted returns, in addition to the ln value-weighted
returns and price-weighted returns. Year-endcapitalization and prices are used to measure value-weighted and price-value-weighted portfolio returns. Value-value-weighted portfolio returns are generally close to benchmark returns, while equally-weighted measures easily display rosy outlook on returns due to the size effect. Price-weighted portfolios are suitably adopted by individual investors, while ln value-weighted construction can result in higher returns by deflating the influence of big companies.
This study presumes that investors start dividend-yield portfolios at the very beginning of the dividend-announcement year. Information about the designated components of dividend-yield portfolios is not available until the June of the dividend-announcement year, raising some skepticism about the investment timing. However, most financial analysts attempt to forecast dividend-yield portfolios at the current year-end, and therefore implement investment portfolios at the beginning of the next year. Therefore, this study regards the beginning of the dividend-announcement year as reasonable investment timing and examines the related investment consequences in terms of several different implementing timings. We depict the original forming and investing of three different periods in the following schematic diagram.
1613 Regarding risk-adjusted models,this study first employs one-period Sharpe-Lintner CAPM as
benchmark to empirically examine the divergences of abnormal returns of among six dividend-yield portfolios. The Sharpe-Lintner CAPM is specified as follows:
,
)
(
mt ft ptp p ft
pt
R
R
R
u
R
(1)Where, Rpt represents the dividend-yield portfolio‟s return at month t; Rft uses the return of
one-year U.S. Treasury Bill at month t as the proxy of the risk-free assets return (Source is from the Data Stream); Rmt is the market portfolio‟s return at month t; and upt is the error item. Among the
regression, βp represents the loading of the systematic risk of dividend-yield portfolios and αp
measures the abnormal returns beyond market risk for the portfolios.
Many researchers have identified that the covariation in the returns of small firms and the covariation in returns related to relative distress of book-to-market equity are consistently not captured by the market return and are compensated in average returns. Therefore, this study adopts the three-factor model as Fama (1998) to further verify whether the abnormal returns of dividend-yield portfolios still left unexplained. The specification of the three-factor model of Fama and French (1993) is as follows.
R
pt
R
ft
p
p(
R
mt
R
ft)
s
pSMB
h
pHML
u
pt,
(2)where SMB refers to the difference between the returns of small- and large-stock portfolios in the Greater China region; and HML measures the difference between the returns of high- and low-BE/ME portfolios in the Greater China region (where BE/ME is the ratio of the book value of common equity to its market equity). The factor sensitivities (or loadings), βp, sp and hp, are the
slopes in the time-series model; all other variables are the same as those described in Equation (1).
4. RESULTS
This study employs a three-step procedure for investigating the abnormal returns of dividend-yield strategies. Firstly, equally-weighted high-dividend-dividend-yield portfolios as those of Visscher and Filbeck (2003) and Brzeszczyński and Gajdka (2007) are constructed to test the “higher dividends = higher returns” issue. Secondly, the analysis of broader top 30 dividend-yield portfolios, particularly by value-weighted measure, reveals whether significant abnormal returns actually exist compared to market indices. Ultimately, this study presents empirically robust tests for the main findings by accommodating several methodological considerations.
4.1. Risk-adjusted Models
1614 Table-2. The return of dividend-yield portfolios with risk-adjusted models a
Notes:
a This table evaluates abnormal returns of dividend-yield portfolios using the month-by-month cross-section risk-adjusted
models in the dividend announcement year. Dividend-yield portfolios are ranked in descending order of dividend yield from the highest-dividend group to zero-dividend group. The monthly returns are calculated in the dividend-announcement years during the period, 2001~2009.
b The CAPM here adopts the Sharpe-Lintner specification.
c *, **, and *** respectively indicate significance at the 10%, 5%, and 1% levels.
d The three-factor model follows Fama and French (1993) and assesses the effects of SMB and HML, with s and h
respectively indicating the coefficients of SMB and HML.
The picture of risk-adjusted returns turns a lot different under the three-factor model. As Table 2 shows, positive abnormal return only appears at the highest dividend-yield group with relative smaller α (α approximates 0.007 vs. 0.022 under CAPM). Moreover, the zero-dividend group appears in a negative abnormal return (α approximates -0.007). This result is consistent with the
Fama (1998) argument, using a robust model to evaluate the abnormal return, and then it will shrink a lot, or disappear. For the coefficient value of SMB, generally showing the lower dividend-yield, then SMB's coefficient values are higher. In the HML factor, h value (0.419) in the highest dividend-yield group, significantly higher than other dividend-yield groups. Those results imply that the abnormal returns of highest dividend-yield group may stem from the risk of firm value; in contrast, the return of zero dividend-yield is from a firm size effect.
4.2 Equally-Weighted Returns
Market ranking on public information, including sale growth rates, earnings growth rates, and dividend yields, have traditionally been the foci of investors since the very first launching of modern stock markets. Although discarded by the doctrines of market efficiency, the bold figures of Table 3 clearly indicate that the equal-weighted top 30 dividend-yield portfolios has generated average annual returns of 82.08 per cent, 64.83 per cent, and 58.54 per cent, respectively, in Yt+1,
Yt+2, Yt+3, during 2003-2009 compared to the 20.29 per cent of MSCI Golden Dragon index. The
Yt+3 returns reported in Table 3 serve the purpose of tracking the long-term performance of the
1615 Table-3. Returns of top 30 dividend-yield portfolios: equally-weighted measure a
Notes:
a This table reports the equally-weighted excess returns between top 30 dividend-yield portfolios and MSCI Golden Dragon
Index during the period, 2003-2009. The table also shows the index returns for A-shares of Shanghai, A-shares of Shenzhen, Hong Kong (HIS) and Taiwan (TAIEX). To compare the sensitivity of measurement of returns, we also present two alternative measures of Ln Value-Weight and Price-Weight.
b
Invest Returns of Yt+1 is the investment returns of dividend-yield portfolios constructed at the year-end of Yt and invested
in Yt+1 which is the dividend-announcement year. c
Thecalculation of the t-statistic is based upon the paired difference test; *, **, and *** respectively indicate significance at the 10%, 5%, and 1% levels.
d
Invest Returns in Yt+2 is the investment returns of the same dividend-yield portfolios in Yt+2. e
Invest Returns in Yt+3 is the investment returns of the same dividend-yield portfolios in Yt+3.
This phenomenon is robust across returns of ln value-weighted and price-weighted measures. Ultimately, this empirical evidence confirms the findings of Visscher and Filbeck (2003) and
Brzeszczyński and Gajdka (2007) and implies that the dividend announcement effects gradually die out.
Portfolios 2000 2001 2002 2003 2004 2005 2006 2007 2008 2009 Avg. R.
Shanghai A 34.38 -21.89 -17.13 10.57 -15.23 -8.21 130.57 96.14 -65.38 79.80 32.61
Shenzhen A 35.16 -26.84 -17.91 -4.02 -16.46 -11.75 96.36 167.04 -61.77 116.89 40.90
HIS -2.81 -24.50 -18.21 34.92 13.15 4.54 34.20 39.31 -48.27 52.02 18.55
TAIEX -51.37 17.14 -19.79 32.30 4.23 6.66 19.48 8.72 -46.03 78.34 14.81
MSCI Golden Dragon index
(A) -31.27 -12.78 -21.67 44.02 10.83 6.28 35.03 34.29 -51.12 62.70 20.29
Panel A: Invest year t+1 b,c
Equally-Weighted (B) - 14.39 49.72 140.68 23.35 11.07 113.58 88.16 -42.68 240.39 82.08
Ln Value-Weighted - 6.18 39.98 112.92 17.60 10.28 117.68 88.00 -45.12 242.72 77.73
Price-Weighted - 7.82 61.49 43.14 18.16 -2.89 105.56 62.46 -49.30 165.23 48.91
Difference in return rates
(B–A) - 27.17 71.39 96.66 12.52 4.79 78.55 53.87 8.44 177.69 61.79
t-Statistic - 1.14 4.64*** 1.40* 0.33 0.38 2.17** 1.21 0.83 3.09*** 3.73***
Wilcoxon signed-rank test - 1.10 2.75*** 1.18 0.39 0.39 2.35** 1.26 0.47 2.82*** 3.57***
Panel B: Invest yeart+2 d
Equally-Weighted (B) - - 41.09 42.54 36.87 8.16 126.17 170.11 -46.00 115.98 64.83
Ln Value-Weighted - - 33.88 43.95 29.22 8.58 132.73 168.72 -47.48 116.61 64.62
Price-Weighted - - 50.31 32.08 27.90 8.26 98.86 99.17 -45.84 144.02 52.06
Difference in return rates
(B–A) - - 62.76 -1.48 26.04 1.88 91.14 135.82 5.12 53.28 44.54
t-Statistic - - 3.96*** -0.01 1.17 0.24 2.64** 1.86** 0.82 3.09*** 3.34***
Wilcoxon signed-rank test - - 2.75*** 0.24 1.33 0.71 2.51** 1.73* 0.55 2.51** 3.42***
Panel C: Invest yeart+3 e
Equally-Weighted (B) - - - 74.41 17.75 8.89 105.27 139.28 -48.00 112.22 58.54
Ln Value-Weighted - - - 68.10 14.26 6.47 111.08 142.62 -49.19 119.59 58.99
Price-Weighted - - - 51.20 20.48 -4.28 70.44 79.15 -47.45 141.10 44.38
Difference in return rates
(B–A) - - - 30.39 6.92 2.61 70.24 104.99 3.12 49.52 38.25
t-Statistic - - - 1.13 0.44 -0.01 2.30** 1.57* 0.31 2.20** 2.69***
1616 4.3. Value-Weighted Returns
The value-weighted return proposed by Fama (1998) exhibits statistically significant abnormal returns of 41.59 per cent, 26.03 per cent, and 18.07 per cent, as indicated by the italicized figures of Panels A-C in Table 4.
Table-4. Returns of top 30 dividend-yield portfolios: value-weighted measure a
Portfolios 2000 2001 2002 2003 2004 2005 2006 2007 2008 2009 Avg. R.
MSCI Golden Dragon index
(A) -31.27 -12.78 -21.67 44.02 10.83 6.28 35.03 34.29 -51.12 62.70 20.29
Panel A: Invest year t+1 b,c
Value-Weighted (B) - -20.10 6.23 49.79 27.62 -7.23 89.68 125.71 -56.31 203.90 61.88
Difference in return rates
(B–A) - -7.32 27.90 5.77 16.79 -13.51 54.65 91.42 -5.19 141.20 41.59
t-Statistic - -0.40 1.20 0.11 1.03 -0.79 2.46** 1.60* -0.38 3.47*** 2.70*** Wilcoxon signed-rank test - -0.31 0.94 0.00 0.78 -0.86 2.35** 1.57 -0.47 2.59*** 2.56** Panel B: Invest yeart+2 d
Value-Weighted (B) - - 12.34 49.34 27.53 -2.24 94.31 96.03 -52.35 111.65 46.32
Difference in return rates
(B–A) - - 34.01 5.32 16.70 -8.52 59.28 61.74 -1.23 48.95 26.03
t-Statistic - - 1.73* 0.19 0.77 -0.59 2.80*** 1.12 0.20 3.27*** 2.21**
Wilcoxon signed-rank test - - 1.33 0.24 0.39 -0.55 2.35** 1.33 -0.08 2.35** 2.42**
Panel C: Invest yeart+3 e
Value-Weighted (B) - - - 19.66 0.89 -2.84 65.45 85.26 -45.71 145.80 38.36
Difference in return rates
(B–A) - - - -24.36 -9.94 -9.12 30.42 50.97 5.41 83.10 18.07
t-Statistic - - - -1.14 -0.55 -0.54 1.19 1.04 0.55 2.35** 1.2.3
Wilcoxon signed-rank test - - - 1.07 -0.63 -0.04 0.86 1.26 0.26 2.28** 1.07
Notes:
a This table uses value-weighted measure to evaluate the abnormal returns between top 30 dividend-yield portfolios and
MSCI Golden Dragon Index in the period, 2003-2009. We adopt U.S. dollar as the currency numeracies of four different markets in the Greater China region. Moreover, the MSCI Golden Dragon Index of Data Stream International is employed as the market benchmark for the Greater China region because it is a free-float equity index covering the major stocks in China, Hong Kong, and Taiwan.
b Invest Returns in Y
t+1 is the investment returns of dividend-yield portfolios constructed at the year-end of Yt and invested
in Yt+1 which is the dividend-announcement year.
c Thecalculation of the t-statistic is based upon the paired difference test; *, **, and *** respectively indicate significance at
the 10%, 5%, and 1% levels.
d Invest Returns in Y
t+2 is the investment returns of the same dividend-yield portfolios in Yt+2. e Invest Returns in Y
t+3 is the investment returns of the same dividend-yield portfolios in Yt+3.
1617 4.4. Market Timing
Does market timing affect abnormal returns? Table 5 reports the average monthly returns of the top 30 dividend-yield portfolios from January 2002 to December 2009.
Table-5. Monthly returns of top 30 dividend-yield portfolios: 200201~200912(%)a
Portfolios Invest period
b, c
2002 2003 2004 2005 2006 2007 2008 2009 Avg.
Jan. 0.90 13.27 6.87 -7.15 9.26 10.31 -14.70 -1.03 2.22
Feb. 3.73 -2.84 7.67 13.19 6.56 6.38 13.38 8.28 7.04
Mar. 3.75 -2.69 2.48 -16.94 4.29 7.18 -0.93 17.72 1.86
Apr. 3.76 2.45 -8.17 -8.98 5.75 13.30 9.01 25.25 5.29
May. -5.51 3.67 -0.03 -2.05 4.74 7.09 -6.73 29.26 3.81
Jun. 10.05 8.91 2.62 3.96 5.88 4.49 -16.21 1.89 2.70
Jul. -3.52 5.30 1.04 -10.20 -2.93 20.45 -2.66 18.75 3.28 Aug. -0.90 4.76 1.58 21.71 2.72 7.27 -8.42 -9.57 2.39 Sep. -3.30 -4.00 6.80 -2.66 5.40 11.90 -28.93 4.94 -1.23 Oct. -2.18 5.30 0.98 -1.70 4.91 -3.32 -22.85 5.26 -1.70 Nov. -1.20 0.98 5.41 5.18 11.30 -13.02 -4.25 6.99 1.42 Dec. -0.81 5.27 -1.96 11.27 5.69 6.37 14.16 5.76 5.72
F-test - - - 0.59
Notes:
a This table reports average monthly returns for top 30 dividend-yield portfolios by value-weighted measure in the period,
2001-2008, and the investment during the period, 200201~200912. For each year in the sample period, the table shows the monthly return of the portfolios.
b We adopt F- test to test the null hypothesis that average monthly returns are equal for each month in the Great China
region, where F-statistic distributed F(11,84).
c *, **, and *** respectively indicate significance at the 10%, 5%, and 1% levels.
This table indicates that October, September, and November respectively account for the lowest three average returns, while February, December, and April have the largest returns. The former period represents the quarter just closely following the start of schools with slack consumption, while the latter period stands for actively trading seasons of Chinese lunar New Year, accounting the window dressing date, and the annual earnings and dividends announcements dates. Although Table 5 seems to show monthly timing, the de facto trading profits are not able to capitalize on market timing. For example, February, the month with the highest average return, exhibits only one negative figure within the eight-year period of Table 5, showing a large loss in 2010 (not reported in the Table). Moreover, the F-test is not able to reject the null hypothesis of the equality across average monthly returns with the low F-statistic of 0.59. Due to the intractable monthly seasonality, the annual measure of portfolio returns can be utilized to smooth out the monthly returns volatility. Ultimately, the monthly timing of buy-and-hold strategy can be expected to have little influence on the main results of this study.
4.5. Market Liquidity
1618 portfolio is accordingly built using the following two-step procedure. Firstly, rank the annual high
dividend-yield subgroup by market value in descending order and select the top 1/3 firms to form the new pool. Secondly, rank again the pool by BE/ME ratio in descending order and finally form the top 30 stocks as the new dividend-yield portfolio. The first step effectively excludes illiquid small stocks and contracts the original annual sample numbers ranging from 215-346 to 65-104. The second step adopts the higher BE/ME ratios ascribed by the three-factor model conducted by this study.
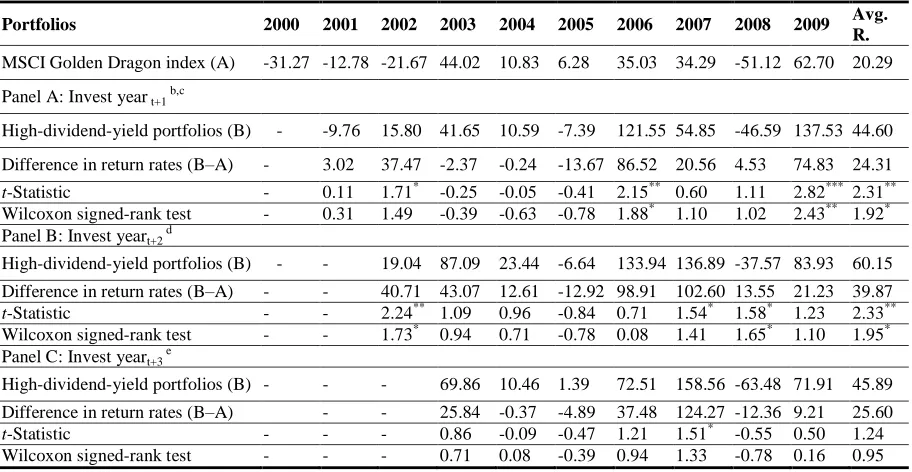
Table 6 reports the investment performance of the new high-dividend-yield portfolios under value-weighted measure. The abnormal returns of high-dividend-yield portfolios at Yt+1, Yt+2, and
Yt+3 respectively account for 24.31 per cent, 39.87 per cent, and 25.60 per cent. Among them, Yt+1,
and Yt+2 reach the 5 per cent statistical significance level with the exception of Yt+3 at marginal 10
per cent. The Wilcoxon test reveals similar results, but is a bit weaker in statistical significance.
Table-6. Returns of high-dividend-yield portfolios: value-weighted measure a
Portfolios 2000 2001 2002 2003 2004 2005 2006 2007 2008 2009 Avg.
R.
MSCI Golden Dragon index (A) -31.27 -12.78 -21.67 44.02 10.83 6.28 35.03 34.29 -51.12 62.70 20.29
Panel A: Invest year t+1 b,c
High-dividend-yield portfolios (B) - -9.76 15.80 41.65 10.59 -7.39 121.55 54.85 -46.59 137.53 44.60
Difference in return rates (B–A) - 3.02 37.47 -2.37 -0.24 -13.67 86.52 20.56 4.53 74.83 24.31
t-Statistic - 0.11 1.71* -0.25 -0.05 -0.41 2.15** 0.60 1.11 2.82*** 2.31**
Wilcoxon signed-rank test - 0.31 1.49 -0.39 -0.63 -0.78 1.88* 1.10 1.02 2.43** 1.92*
Panel B: Invest yeart+2 d
High-dividend-yield portfolios (B) - - 19.04 87.09 23.44 -6.64 133.94 136.89 -37.57 83.93 60.15
Difference in return rates (B–A) - - 40.71 43.07 12.61 -12.92 98.91 102.60 13.55 21.23 39.87 t-Statistic - - 2.24** 1.09 0.96 -0.84 0.71 1.54* 1.58* 1.23 2.33**
Wilcoxon signed-rank test - - 1.73* 0.94 0.71 -0.78 0.08 1.41 1.65* 1.10 1.95*
Panel C: Invest yeart+3 e
High-dividend-yield portfolios (B) - - - 69.86 10.46 1.39 72.51 158.56 -63.48 71.91 45.89
Difference in return rates (B–A) - - 25.84 -0.37 -4.89 37.48 124.27 -12.36 9.21 25.60
t-Statistic - - - 0.86 -0.09 -0.47 1.21 1.51* -0.55 0.50 1.24
Wilcoxon signed-rank test - - - 0.71 0.08 -0.39 0.94 1.33 -0.78 0.16 0.95
Notes:
a This table adopts value-weighted measure to evaluate the excess returns between high-dividend-yield portfolios and MSCI
Golden Dragon Index during the period 2003-2009.
b
Invest Returns in Yt+1 is the investment returns of dividend-yield portfolios constructed at the year-end of Yt and invested
in Yt+1 which is the dividend-announcement year. c Thecalculation of the t
-statistic is based upon the paired difference test; *, **, and *** respectively indicate significance at the 10%, 5%, and 1% levels.
d
Invest Returns in Yt+2 is the investment returns of the same dividend-yield portfolios in Yt+2. e
Invest Returns in Yt+3 is the investment returns of the same dividend-yield portfolios in Yt+3.
1619 smaller than they should be) and a loss of power for upper-tailed tests (i.e., reported p values will
be too large). To address this issue, we follow the bootstrapped skewness-adjusted t-statistic of
Lyon et al. (1999), and the findings of table 6 remain largely unchanged.
In addition, Campbell et al. (2001) suggests that, because of increase in idiosyncratic risk, the requirement of amounts of shares to constitute a fully diversified portfolio increases significantly up to 50 in the US markets after 1990s. Therefore, we form a new high-dividend-yield portfolio adopting 50 firms for the purpose of sensitivity test, but the result is similar to our main finding.
5. CONCLUSIONS
This study is among the first and most comprehensive examinations of the performance of the Dogs strategy in the Greater China region. Although many studies show that the superior performance of the dividend strategy is firmly provided in both North American and European markets, Fama (1998) argued that reasonable changes of measure of abnormal returns typically suggest that apparent anomalies are methodological illusions. Therefore, in addition to traditional equally-weighted abnormal returns, this study examines the evidence in terms of three-factor model and value-weighted measure.
Our empirical evidence indicates that positive abnormal returns do appear at the highest dividend-yield group even under the three-factor model. Further, the annual returns of equally-weighted portfolios also significantly beat MSCI Golden Dragon index during 2003-2009. The results are robust across measures of ln value-weighted and price-weighted portfolios. Particularly, the value-weighted portfolios of Fama (1998) also provide statistically significant abnormal returns of the Dogs strategy. Finally, the superiority of the buy and hold strategy of dividend portfolios remains strongly confirmed even when market liquidity is taken into consideration.
This study helps shed light on the issue surrounding dividend portfolios in several aspects. Firstly, this study extends the evidence of Visscher and Filbeck (2003) and Brzeszczyński and
Gajdka (2007) from equally-weighted measure to value-weighted measures. Secondly, this study provides an in-depth analysis of the Dogs strategy based on the white-hot broad China markets. Thirdly, this study carefully examines empirical to avoid the critical factors of liquidity risk and market timing. Particularly, the annual return measure instead of monthly timing used by previous researches provides direct evidence that abnormal returns of dividend announcements actually occur during the first two years and gradually die out thereafter. These findings provide important insights into capital market behavior and should prove useful for trading strategies and portfolio management.
REFERENCES
Arnott, R.D. and C.S. Asness, 2003. Surprise! Higher dividends = higher earnings growth. Financial Analysts
Journal, 59(1): 70-87.
Asem, E., 2009. Dividends and price momentum. Journal of Banking & Finance, 33(3): 486-494.
1620 Barber, B.M. and J.D. Lyon, 1997a. Detecting long-run abnormal stock returns: The empirical power and
specification of test statistics. Journal of Financial Economics, 43(3): 341–372.
Barberis, N. and A. Shleifer, 2003. Style investing. Journal of Financial Economics 68(2): 161-199.
Barberis, N., A. Shleifer and R. Vishny, 1998. A model of investor sentiment. Journal of Financial Economics,
49(3): 307-343.
Black, F. and M. Scholes, 1974. The effects of dividend yield and dividend policy on common stock prices
and returns. Journal of Financial Economics, 1(1): 1-22.
Blume, M.E., 1980. Stock returns and dividend yields: Some more evidence. Review of Economics and
Statistics, 62(4): 567-577.
Brzeszczyński, J. and J. Gajdka, 2007. Dividend-driven trading strategies: Evidence from the warsaw stock
exchange. International Advances in Economic Research, 13(3): 285-300.
Campbell, J.Y., M. Lettau, B.G. Malkiel and Y. Xu, 2001. Have individual stocks become more volatile? An
empirical exploration of idiosyncratic risk. Journal of Finance, 56(1): 1-43.
Derwall, J., N. Guenster, R. Bauer and K. Koedijk, 2005. The eco-efficiency premium puzzle. Financial
Analysts Journal, 61(2): 51–63.
Edwards, W., 1968. Conservatism in human information processing. In: Kleinmutz, B (Ed.) Formal
representation of human judgement. New York: Wiley.
Elton, E.J., M.J. Gruber, S.J. Brown and W.N. Goetzmann, 2007. Modern portfolio theory and investment
analysis. Figure 4-2, 4-3. 7th Edn.: John Wiley & Sons, Inc.
Eun, C.S. and W. Huang, 2007. Asset pricing in china‟s domestic stock markets: Is there a logic?
Pacific-Basin Finance Journal, 15(5): 452-480.
Fama, E.F., 1998. Market efficiency, long-term returns, and behavioral finance. Journal of Financial
Economics, 49(3): 283-306.
Fama, E.F. and K.R. French, 1993. Common risk factors in returns on stocks and bonds. Journal of Financial
Economics, 33(1): 3-56.
Filbeck, G. and S. Visscher, 1997. Dividend yield strategies in the British stock market. European Journal of
Finance, 3(4): 277-289.
Fisher, L. and J.H. Lorie, 1970. Some studies of variability of returns on investments in common stocks.
Journal of Business, 43(2): 99-134.
Graham, J.R. and A. Kumar, 2006. Do dividend clienteles exist? Evidence on dividend preferences of retail
investors. Journal of Finance, 61(3): 1305-1336.
Gwilym, A.O., J. Seaton, K. Suddason and S. Thomas, 2006. International evidence on the payout ratio,
earnings, dividends and returns. Financial Analysts Journal, 62(1): 36-53.
Gwilym, A.O., J. Seaton and S. Thomas, 2005. Dividend yield investment strategies, the payout ratio, a nd
zero-dividend stocks. The Journal of Investing, 14(4): 69-74.
Harada, K. and P. Nguyen, 2005. Dividend change context and signaling efficiency in Japan. Pacific-Basin
Finance Journal, 13(5): 504-522.
Huang, C.S., C.F. You and S.H. Lin, 2009. Cash dividends, stock dividends and subsequent earnings growth.
1621 Jensen, M.C., 1986. Agency costs of free cash flow, corporate finance and takeovers. The American Economic
Review, 76(2): 323-329.
Keim, D.B., 1985. Dividend yields and stock returns: Implications of abnormal January returns. Journal of
Financial Economics, 14(3): 473-489.
Koch, A.S. and A.X. Sun, 2004. Dividends changes and the persistence of past earnings changes. Journal of
Finance, 59(5): 2093-2116.
Kyriazis, D. and G. Diacogiannis, 2007. Testing the performance of value strategies in the athens stock
exchange. Applied Financial Economics, 17(18): 1511-1528.
Lyon, J.D., B.M. Barber and C.L. Tsai, 1999. Improved methods for tests of long-run abnormal stock returns.
Journal of Finance, 54(1): 165-201.
McQueen, G., K. Shields and S.R. Thorley, 1997. Does the „dow-10 investment strategy‟ beat the dow
statistically and economically? Financial Analysts Journal, 53(4): 66-72.
Miller, M.H. and F. Modigliani, 1961. Dividend policy, growth, and the valuation of shares. Journal of
Business, 34(4): 411-433.
Morgan, G. and S. Thomas, 1998. Taxes, dividend yields and returns in the UK equity market. Journal of
Banking and Finance, 22(4): 405-423.
Nissim, D. and A. Ziv, 2001. Dividend changes and future profitability. Journal of Finance, 56(6): 2111-2133.
Teo, M. and S.J. Woo, 2004. Style effects in the cross-section of stock returns. Journal of Financial
Economics, 74(2): 367-398.
Visscher, S. and G. Filbeck, 2003. Dividend-yield strategies in the Canadian stock market. Financial Analysts
Journal, 59(1): 99-106.
Wang, X., 2000. Size effect, book-to-market effect, and survival. Journal of Multinational Financial
Management, 10(3-4): 257-273.
Zhou, P. and W. Ruland, 2006. Dividend payouts and future earnings growth. Financial Analysts Journal,