Geometry and charge distribution of
H
centres in the
fluorite structure
S Parker:, K S Song$, C R A Catlow§ and A M Stoneham Theoretical Physics Division, AERE Hanvell, Didcot. Oxon, OX11 ORA, UK
Received 23 January 1981
Abstract. The analysis of experimental optical and spin-resonance data for the H centre gives a consistent picture of the local geometry and one-electron wavefunctions. One of the two ions in the F; molecular in remains very close to the perfect lattice site; the other is at a distance close to that found in other FF centres. This analysis is confirmed by atomistic calculations using the HADES code. The results are used to give a preliminary analysis of the self-trapped exciton data.
1. ‘Molecule in a crystal’ defects
Some important defectscan be described as a ‘molecule in acrystal’, (see, e.g., Stoneham 1975, Hayes and Stoneham 1974). They behave like a free molecular species, apart from a slight change in dimension because of the surrounding matrix. The most important example is the self-trapped hole in halides, where the Vk centre is essentially an Xz-
molecular ion substituting for two X- halogen ions. Another important example is the
H centre, the neutral anion interstitial in alkali halides, where an Xz- molecular ion substitutes for a single
X-
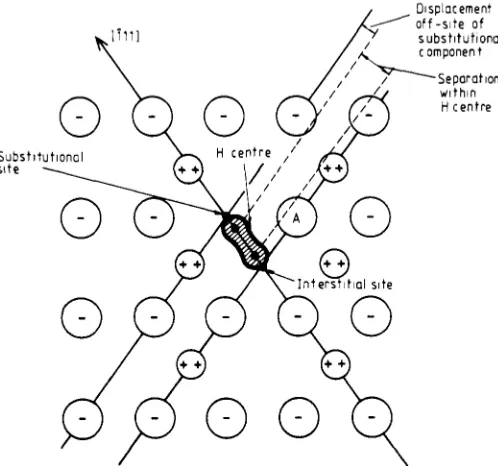
ion.In all these cases one can deduce the X-X separation within the Xz- ion from spectro- scopic measurements, both optical and spin resonance (Schoemaker 1973, Jette et a1 1969, Tasker and Stoneham 1977). For the Hcentre in the fluorite structure, the situation is less clear, for the geometry is more complicated and the two halogens are not equiv- alent. This is shown in figure 1. We shall show, nevertheless, that the spectra do define the positions of the two halogens. These deduced positions can be compared with predictions based on atomistic calculations.
The critical experimental results compare the ultraviolet optical absorption of the H
and Vk centres. From this we can put bounds on the difference in Madelung potential at the sites of the two components of the interstitial. In calculating the effect of this asymmetric potential, we can predict too the asymmetry in the hyperfine constants, which have also been measured. Quantitatively, however, it is more accurate to start from atomistic calculations of the geometry and to predict spectroscopic quantities. We shall follow this latter approach here.
t On attachment from Department of Chemistry, University College, London,
$ Permanent address: Physics Department, University of Ottawa, Canada, I Permanent address: Department of Chemistry, University College, London.
0022-3719/81/284009
+
07 $01.50 @ 1981 The Institute of Physics 4009Figure 1. CaF2 interstitial geometry. The diagram shows a (110) plane and defines the distances referred to in the text. The site A is one of the possible vacant sites for the self- trapped exciton.
2. Geometry and observed spectra
The H centre in the fluorite structure lies along a (111) axis, with one ion near the tetrahedral interstitial site and the other close to a substitutional site. There are thus two key distances-the separation within the H centre, and the shift of the ion closest to substitutional from the perfect lattice site. Since it is a rule from all other
XT
systems that theX; ion has a spacing close to its free-space equilibrium value, it is the shift rather than the separation that needs especial attention.The main effect of the difference in Madelung potential between the two halogen sites is to mix the U, and ug molecular orbitals of theX; molecular ion. The ultraviolet absorption band is one in which an electron is excited from the up state to the
a,
state. Consider first a simple model in which the U,, and up orbitals both derive from non- overlapping atomic pz orbitals (X; is along the Oz axis):U,, = [pzl(r)
+
pzz(r)1~fi (2.1)transition is determined by the off-diagonal matrix element ( p , ~
1% 1
pz2) (which is just E in this case). When the sites are not equivalent there are extra terms defined by 2A = (pZzl XIpz2)-
(pZl1
X ~ p z l ) . We then note that the transition energy is increased toE,, = 2 4 1
+
(A/E)*]~”and that the wavefunctions, which determine the hyperfine constants, are now altered by terms which are functions of A/&.
This model is too simple in several respects. First, it is clear that both s and p2 orbitals are involved, This means that we must consider a (4 X 4) secular determinant, involving
s and pz orbitals on the two sites (1) and (2) (site (1) refers to the one near the substitutional site and (2) the interstitial site). Secondly, there are complications in the choice of A . Normally one would argue that 2A is simply the difference in Madelung potential between the two sites. However, when the asymmetry is at all significant, the net charge on each ion changes, and we must consider the shifts in one-electron energy from intra-atomic effects.
The full (4 x 4) secular determinant within the basis of pzl, pz2, s1 and s2 is as follows:
E O , - A - E E 0 -V
E G + A - E V 0
= 0,
0 V E ! - A - E W
-V 0 W E : + A - E
e
andI$
are the energies of the 2s and 2p electron states respectively in free F-. V and Ware the off-diagonal energy matrix elements which are introduced with the inclusion of s orbitals. Qualitatively speaking, E determines the ultraviolet absorption energy as mentioned earlier. V determines the s-p admixture of the hole state, and W describes the splitting of much deeper states which are primarily s-like. The absorption energy, as well as the hole population on the two inequivalent sites, are determined byI$
-e
,
and not by the absolute values of the levels.0.64 au and the electron affinity is 0.125 au) we can attain a low level of self-consistency by using linear interpolation. Specifically, if Z and 1
-
Z are the fractional charges on the two ions of the H centre (e.g. with Z = 0.6 one has F-o.6 near the lattice site and F-0.4 near the interstitial site), then the second component in 2A is 14.01 (1 - 2 2 ) eV. As there is only a slight difference, we have used the same value of 2A for the s orbitals. We are now in a position to estimate the value of Z , the transition energy and the one- electron wavefunctions. The wavefunctions will be related to the hyperfine constants by requiring the same parameters describe correctly the Vk centre spin-resonance data.Even at this stage we can comment on the geometry from a comparison (table 1) of
the observed
Vk
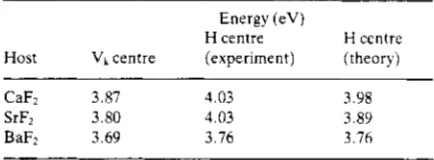
centre and H centre optical bands (Beaumont et a1 1970, Williams et a1 1976). Suppose that one of the two H centre ions remains exactly at the substitutional site, and that the other lies in a (111) direction at a distance equal to the freeFT ionTable 1. Optical transition energies. The experimental data are from Beaumont e t a / (1970). and the theory from the present paper, using the HADES predictions of geometry.
Energy (eV)
H centre H centre Host Vk centre [experiment) [theory)
CaF2 3.87 4.03 3.98
SrFz 3.80 4.03 3.89
BaF2 3.69 3.76 3.76
separation. Then, from observed spectra and the known Madelung potentials, we deduce values 1.12 eV (CaF2), 1.34 eV (SrF2) and 0.72 eV (BaF2) for 2A. From our model for 2A we find this implies 2 to be 0.76 (CaF2), 0.69 (SrF2) and 0.69 (BaF2). On the other hand, direct solution of the full secular determinant leads to values 0.65,0.67 and 0.60 respectively; the slight discrepancy can be corrected by small changes in ion positions. From this simple calculation we learn three things. First, the closeness of the
Vk
centre andH
centre bands itself gives useful geometric information. Secondly, the values of 2 will be about 0.6-0.7, a point we confirm later in discussing hyperfine constants. Thirdly, only very modest changes from the assumed geometry are consistent with observation. This is one of several cases(vk
centres being another) where spectro- scopic data alone give useful information on defect geometry.3. Atomistic calculations
Atomistic calculation requires the specification of interatomic potentials both for the host lattice interaction and for the interactions between host and defect ions. Shell model potentials for three alkaline earth fluorides are taken from the work of Catlow and Norgett (1973). For the H centre we took the intramolecular potential calculated using Hartree-Fock methods by Gilbert and Wahl(l971). This numerical potential was fitted to a simple analytical function of the Buckingham form by Norgett and Stoneham (1973). The same analytical function was used in our calculations. Interaction between the host ions and the component atoms of the H centre were taken to be the same as the lattice ion-ion interactions. Calculations were performed on the H centre with both polarisable and unpolarisable component atoms. In the former case the same polarisation para- meters (shell charges and spring constants were used as for the lattice F- ion.
Our calculations investigated a number of charge distributions in the H centre in order to determine whether an asymmetric charge distribution would be stabilised by the surrounding lattice. Thus, in addition to the symmetric case where both component atoms have a charge of 0.5, we examined asymmetric distributions in which we placed partial charges on the component atoms. The intra-atomic potential for F; calculated by Gilbert and Wahl(l971) is only strictly applicable to the case of a symmetric charge distribution. Our calculation thus ignores the effects of the perturbation of the charge distribution on this interaction. However, our results are not strongly dependent on details of this potential, and this approximation should not seriously affect the reliability of our calculations.
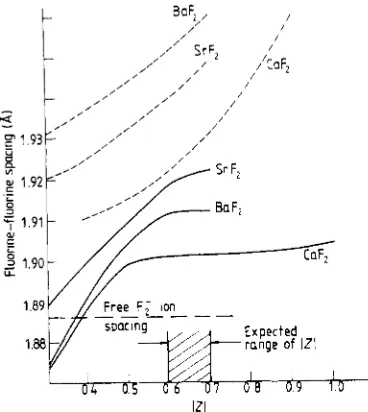
The results which emerge confirm the qualitative arguments given in the earlier sections. First, we find theF; spacing close to that (1.885
A)
of the free molecular ion. For Z = 0.65, the spacings are 1.90A
(CaF2). 1.922A
(SrF2) and 1.912A
(BaF2); as Z rises, the spacings increase by about 0.01A
per 0.1 le/ charge change. Secondly, one of the two fluorines remains close to the substitutional site. The displacements away from the anionsite are 0.098,
(CaF2), 0.15A
(SrF2) and0.23A
(BaF2)for 2 = 0.65, increasing by about 0.04A
per 0.11
el increase in Z . The defect energy becomes systematically lower as 2 rises. Basically, there is an energy advantage when the hole is near the interstitial site, where the Madelung potential is slightly favourable, rather than at the anion site, where the potential is repulsive. Roughly, the difference in Madelung poten- tial changes by 0.45 eV per 0.1t
et
change in 2, after allowance for geometry changes. This Madelung term is, of course, balanced by the shifts in one-electron levels discussed in 82.As in previous work on Vk centres (Norgett and Stoneham 1973) we find the energy is insensitive to the electronic polarisabilities assumed for the ions in the F; molecular ion. However, the geometries do show some sensitivity: the separations become bigger, and the shifts of the substitutional ion less if there is no electronic polarisation (figure 2). This simply reflects the way the ionic polarisation takes up the response which would otherwise be achieved by the electronic terms.
4. Comparison with experiment for the H centre
IZI
Figure 2. Equilibrium fluorine-fluorine spacings for different charges Z on the fluorine closest to the substitutional site. The broken lines refer to fluorines in the Fy ion which are electronically unpolarisable; the full lines assume the same electronic polarisability for these ions as for the other fluorine ions in the lattice.
anisotropic hyperfine constants on the two sites. The hyperfine constants are defined by
%ehr =
Zd
*S
+
Zi(3ZzSz-
I * S)+
Z2(ZJx-
ZySy)= A,Z,S,
+
A,Z,S,+
AyZySy.It is also possible to derive the A , and A , constants on the two sites and compare them directly with the experimental values reviewed by Hayes and Stoneham (1974). Table
2 presents these data. From the various studies the sign of A , for
Vk
centres in fluorides is known to be negative. We have assumed the same sign here. Our model reproduces quite reasonable values for both the isotropic and the anisotropic parameters although the agreement is less satisfactory for the isotropic term. It is known thatZI
varies muchTable 2. Hyperfine interaction parameters (in Gauss) for the H centre in CaF2, SrF2 and BaF2. Both ( A z , A,) and (IO, I,) are given. The experimental data are bracketed. The superscripts a and b refer to the substitutional and the interstitial sites respectively.
CaF2 (267) (316) 311 (221) 215 (230) 242 (186) 390 (425)
SrF2 (269) (315) 310 (230) 222 (258) 248 (188) 382 (406)
BaF2 (269) (315) 307 (246) 226 (265) 254 (211) 376 (392)
Host A: A: A: A!
CaF2 795(593) 995(1079) 6 9 ( / 3 5 1 ) -175(1195/)
SrF2 806(607) 986(1071) 6 2 ( 1 4 2 / ) -160(1148l)
less from system to system than lo. We also obtain the general trends among the three fluorites adequately. It is to be noted that from our model the signs of the transverse components of A are opposite on the two sites.
5. Discussion
We have shown that one can construct a consistent ‘molecule in a crystal’ picture for the
H centre in the fluorite structure, despite the low symmetry. The optical data alone give good results for the distortions, and distortions calculated atomistically lead to satisfac- tory hyperfine constants.
The natural extension of this work would be to treat the self-trapped exciton, in which a neutral vacancy (Fcentre) as well as a neutral interstitial (H centre) are involved. We have made preliminary calculations which show two main features. First, there are several sites near to the interstitial at which one might find the vacancy. Which site is favoured depends sensitively on how one treats the trapped electron in choosing a suitable interatomic potential. Secondly, if one makes a sensible choice of site the resulting hyperfine constants are not well represented by superposition of Fand H centre contributions. Clearly, a fuller treatment is needed, and we defer this to a later paper.
Acknowledgments
We are indebted to Dr C H Leung for his contributions in the early stages of this work.
References
Beaumont J H, Hayes W, Kirk D Land Summers G P 1970 Proc. R. Soc. A315 69 Call P J, Hayes W and Kabler M N 1974 J . Phys. C: Solid State Phys. 7 2429 Catlow C R A 1980 J . Physique 41 05-53
Catlow C R A, Corish J , Diller K M, Jacobs P W M and Norgett M J 1976 J . Physique 37 C7-253 Catlow C R A and Norgett M J 1973 J . Phys. C: Solid State Phys. 6 1325
Catlow C R A, Norgett M J and Ross A 1977 J . Phys. C: Solid State Phys. 10 1627 Clementi E and Roetti C 1974 At. NUC. Data Tables 14 177
Gilbert T L and Wahl A C 1971 1. Chem. Phys. 55 5247
Hayes Wand Lamboum R F 1975 J . Phys. C: Solid State Phys. 8 L60
Hayes Wand Stoneham A M 1974 Crystals with the Fluorite Structure ed W Hayes (Oxford: Oxford University Itoh N 1976 J . Physique 37 (C7) 26
Jacobs P W M and Norgett M J 1976 J . Physique 37 C7-253
-
1979 J . Phys. C: Solid State Phys. 12 451Jette A N, Das T P and Gilbert T L 1969 Phys. Reu. 186 919
Marrone M J , Patten F W and Kabler M N 1973 Phys. Rev. Lett. 31 467 Mott N F and Littleton M J 1938 Trans. Faraday Soc. 34 405
Norgett M J 1974 UKAEA Report AERE-R7650
Norgett M J and Stoneham A M 1973 J . Phys. C: Solid State Phys. 6 229 Schoemaker D 1966 Phys. Reu. 149 693
-
1973 Phys. Reu. B2 1148Stoneham A M 1975 Theory of Defects in Solids (Oxford: Oxford University Press) Stoneham A M , Hayes W, Smith P H S and Stott J P 1968 Proc. R. Soc. A306 1369 Tasker P Wand Stoneham A M 1977 J . Phys. Chem. Solidr 38 1185