Article
1
Initial field testing results from building-integrated
2
solar energy harvesting windows installation in
3
Perth, Australia
4
Mikhail Vasiliev *, Mohammad Nur-E-Alam, and Kamal Alameh
5
Electron Science Research Institute (ESRI), School of Science, Edith Cowan University, 270 Joondalup Dr,
6
6027, WA, Australia
7
* Correspondence: [email protected]
8
9
Featured Application: Unconventional, highly transparent building integrated photovoltaics.
10
Abstract: We report on the field testing datasets and performance evaluation results obtained from
11
a commercial property-based visually-clear solar window installation site in Perth-Australia. This
12
installation was fitted into a refurbished shopping centre entrance porch, and showcases the
13
potential of glass curtain wall-based solar energy harvesting in built environments. In particular,
14
we focus on photovoltaic (PV) performance characteristics such as the electric power output, specific
15
yield, day-to-day consistency of peak output power, and the amounts of energy generated and
16
stored daily. The dependencies of the generated electric power and stored energy on multiple
17
environmental and geometric parameters are also studied. An overview of the current and future
18
application potential of high-transparency, visually-clear solar window-based curtain wall
19
installations suitable for practical building integration is provided.
20
Keywords: Renewables; energy saving and generation; built environments; solar windows;
21
advanced glazings; photovoltaics.
22
23
24
1. Introduction
25
The global building integrated photovoltaics (BIPV) market is likely to expand from USD 6.7
26
billion to USD 32.2 billion by 2024, witnessing a compound annual growth rate (CAGR) of 23.4% over
27
the forecast period [1]. This growth trend is due to both the increasing availability of new and
28
innovative BIPV products, and the growing attention of the architects, city planners, property
29
developers, and governments towards the sustainable construction practices and the integration of
30
renewable energy generators into urban landscapes. At the same time, the worldwide annual energy
31
consumption continues to grow, and is projected to exceed 0.74 billion TJ by 2040, with the generation
32
contributions from fuels other than coal (mainly renewables) being on the increase [2]. Global
33
warming-related concerns and environmental protection trends and policies also continue to favour
34
the development of renewable energy generation and storage facilities [3–6]. At present, the BIPV
35
technologies and products are only beginning to experience their expected widespread adoption, and
36
a range of different novel technologies are being introduced into the well-established market of
37
construction materials [7-12]. The benefits of distributed energy generation (an approach based on
38
employing a combination of small-scale technologies to produce electricity close to the end users of
39
power) include the avoidance of significant transmission-line losses and the provision of blackout
40
resistance. Generating electricity at the point of its use can also lead to making the urban built
41
environments potentially grid-independent, even if this energy supply independency is provided
42
only on limited time-scales. Multiple recent literature sources emphasize the importance of
43
distributed generation networks and the development of sustainable microgrids [13-15]. Advanced
44
building-scale integration of renewable energy generators utilising most of the available deployment
45
areas, including walls and windows, can lead towards future city-scale distributed generation
46
networks in “smart cities”. Additionally, the emergent concept of “smart facades” that provide
47
locally embedded self-powering environmental sensor systems integrated with
window-48
powered equipment, such as motorized blinds, is gaining increasing attention in commercial
49
engineering circles [16]. The most desired attributes of building wall-integrated PV are either the
50
highly-transparent, perfectly-clear visual appearance, or a possibility of significant (active or passive)
51
control over their transparency, appearance, and colour. A number of recent and detailed reviews
52
of the current trends in BIPV are available [17-20], with the most recent sources underscoring the
53
importance of transparent photovoltaics and solar windows, which have just started to appear on the
54
market at present, packaged as installation-ready framed systems suitable for long-term
55
environmental exposure.
56
57
The importance of energy-efficient construction practices is currently gaining substantial
58
attention from multiple governments and research groups worldwide, leading to the emergence of a
59
large range of principally new construction materials and their components, such as advanced
60
coatings which ensure improved thermal insulation and/or change transparency in response to
61
external conditions [21]. It is the combination of the energy saving and energy generation
62
functionalities possible to be engineered in modern windows that is of primary interest for leading
63
architects and property developers. In early 2019, Vicinity Centres (a real estate investment trust
64
company based in Melbourne, Australia) has installed 18 transparent solar windows supplied by
65
Clearvue Technologies Ltd. (Perth, Australia), into a refurbished entrance porch of Warwick Grove
66
Shopping Centre in Warwick (a northern suburb of Perth), in order to evaluate their suitability and
67
practical application potential in commercial property settings. The installation site is illustrated in
68
Figure 1.
69
70
71
72
73
74
75
76
78
79
80
Figure 1. Entrance porch (atrium) of Warwick Grove Shopping Centre in Warwick (Perth, WA, Australia)
81
constructed using 18 solar windows supplied by Clearvue Technologies Ltd. (Perth, WA, Australia). (a) front
82
view and (b) top view.
83
84
The solar window design type was derived from the previous transparent solar window designs,
85
multiple prototype models of which have been developed by Edith Cowan University (ECU) and
86
Clearvue Technologies over several recent years, and were trialled in 2017 at a grid-independent bus
87
stop in Melbourne [22]. Several engineering features related to the glazing system structure, window
88
size, system packaging-related details, and solar modules circuitry implementation have changed
89
since these were reported originally ([22]), improving the peak-rated electric power output of
90
transparent solar windows towards 30 Wp/m2, measured at standard test conditions (STC) using the
91
manufacturer-sourced large-scale flash-lamp PV testing equipment. The core design and
assembly-92
related features of solar windows remained almost the same, and included the triple-glazed structure,
93
low-iron glass plates, low-emissivity heat-mirror coating, and particles of high Stokes-shift inorganic
94
luminescent materials embedded into a lamination interlayer. More technical details are available
95
from [23-26], whist the general system design philosophy has been derived from the approaches
96
reported throughout the last several decades in [27-30], and in references therein.
97
98
The following sections of this article provide the installation-specific microgrid configuration
99
details, and the results of a case study of the energy harvesting efficiency conducted over May-June
100
2019. We then summarise the data and main results, providing an outlook for the future application
101
potential of transparent solar windows, and propose some new future application areas.
2. System Design Features, Methodologies of Energy Harvesting Performance Assessment, and
104
Principal Results
105
Each of the 18 solar windows, factory-assembled at Qingdao Rocky Technical Glass Co., Ltd.
106
(Qingdao, China) have been re-tested following their shipment to Perth, in outdoor morning sunlight
107
conditions, confirming stable operation and the expected power outputs. Approximately (27±1) W of
108
electric output has been obtained from each window at close to their optimal geometric orientation
109
and tilt angles towards the incoming natural sunlight, and at solar module surfaces being at > 37 °C.
110
The weather conditions in mid-April in Perth (at the time of testing) were typical for autumn, and
111
without strong UV irradiation background (likely at UV index near 5, out of the yearly maximum of
112
12 [31]). The typical measured output parameters from each window were as follows: open-circuit
113
voltage Voc = 58.85V, short-circuit current Isc = 0.723 A, and Fill Factor FF = 0.639. The maximum power
114
point (MPP) parameters corresponded to VMPP = 49.5 V and IMPP = 0.55 A. The same windows of area
115
size near 1.3 m2 (1.087m x 1.2m) have been tested at STC previously, resulting in electric outputs
116
being in excess of 36 W; the differences with the outdoor test results were due to both the solar cell
117
temperature effects, and also the weather-dependent solar irradiation power density. Three principal
118
deployment areas were available on-site for the installation of 16 unshaded solar window units: (i)
119
an East-facing tilted roof section, with 4 parallel-connected windows; (ii) a North-facing vertical wall
120
section, containing 8 windows, and (iii) a West-facing tilted roof section with 4 windows. An
121
additional deployment area on the east-facing vertical wall housed 2 more window units, which were
122
strongly shaded by the nearby car-park roofing during most of the daylight hours. The shopping
123
centre atrium installation at Warwick Grove Shopping Centre (Fig. 1) was completed in early 2019
124
[32], and a systematic study of its energy harvesting performance commenced in May 2019, following
125
a short period of initial configuration tests and some reconfiguration of the microgrid equipment and
126
circuitry used. Vicinity Centres has stated their commitment to achieving Net Zero carbon emissions
127
by 2030 [33], and solar energy harvesting can be expected to play a major role in reaching this
128
objective. Vicinity Centres’ giant solar energy program and roadmap of renewable energy
129
installations have led to winning the “People’s Choice” award at the Property Council of
130
Australia/Rider Levett Bucknall Innovation and Excellence Awards 2019 [34].
131
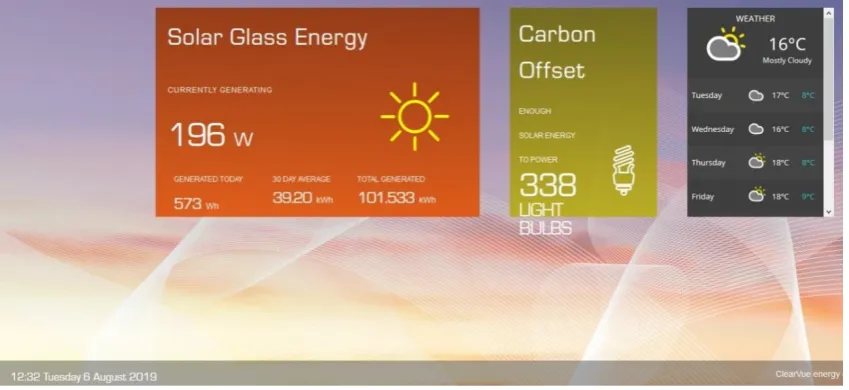
Figure 2 shows a graphical summary of the microgrid circuitry details and equipment
132
configuration installed, as well as sample plots of the daily power generation and use waveforms
133
recorded by Enphase Energy’s Enlighten Systems applications programming interface (API) over
134
several days in May 2019. Four Enphase microinverters (Enphase Energy Inc., Fremont, CA, USA)
135
were installed to service the four separate solar window installation areas described above; each
136
microinverter collected the combiner-box bundled parallel-connected electric output from the
137
windows placed into each installation area. A LED TV panel (powered by the generated energy
138
stored in batteries) was installed in the shopping centre entrance foyer, and was configured to display
139
a graphic summary of the system operation state (also shown in Fig. 2). The main system parameters
140
displayed, related to the generation of energy and carbon offset capacity, were also configured for
141
online live internet broadcasting at http://tcp.iotstream.io/vicinity-warwickgrove/index.php. The live
142
power generation data are being refreshed every 15-20 minutes, and the amounts of daily and total
143
generated energy (since May 14, 2019) are also shown. Electric loads other than LED TV included a
144
computer system (Intel NUC small-form mini PC), modem (D-Link GSM), and two 30 W LED ceiling
145
lamps within the foyer area, used continually for about 12 h daily. The energy storage was enabled
146
by installing twin LiFePO4 Enphase AC batteries providing 1.2 kWh capacity each. The Enphase
147
Envoy-S Metered™ communications gateway system delivered the real-time solar production and
148
energy consumption data to Enphase Enlighten™ monitoring and analysis software for
149
comprehensive, remote maintenance and management of the complete microgrid system. Fuses were
150
installed into each window’s output cabling lines to safeguard against any possible issues related to
151
the accidental (however unlikely) electric faults leading to the high reverse-current loading of any
152
individual modules. These protective components were necessary, considering the high maximum
153
Isc (~0.75A) generated by individual PV windows, and the numbers (up to 8) of the parallel-connected
154
window modules installed into bundles. Parallel electric connection of the individual windows
placed into the same deployment areas (presumed uniformly lit in clear weather conditions) has been
156
selected to improve the stability of the combined electric output to differential shading effects,
157
originating from the possible glass surface contamination and variable cloud-related shading.
158
Additionally, this allowed minimisation of the system output voltage to safe levels, and the selection
159
of a suitable low-power microinverter model with matched electric input characteristics and having
160
maximum power point tracking (MPPT) capabilities. The benefits of using the parallel and also the
161
massively-parallel electric circuit configurations of PV modules installed into low-power solar energy
162
harvesters have been well documented and reported previously [35].
163
164
165
166
167
169
Figure 2. A graphical summary of the microgrid configuration details, sample data logs for the daily energy
170
generation and use, and a photo of TV screen data showing a summary of system state (also available through
171
live Internet broadcast at http://tcp.iotstream.io/vicinity-warwickgrove/index.php with 15-minute data
172
sampling intervals).
173
174
After configuring the microgrid connections, electric loads, storage system, and system
175
management software in May 2019, a case study of the system performance started, and the electric
176
characteristics were monitored almost daily, at regular time intervals, and in varying weather
177
conditions. The amounts of storage-ready electric energy generated by all four individual
178
(differently-oriented) bundles of solar windows were monitored in different conditions. Energy
179
losses at the microinverters and inside cabling would have amounted to several percent of the total
180
generated energy, yet these were ignored and not monitored specifically. Regular system
181
performance and electric output observations continued until the end of June 2019, resulting in
182
obtaining a large dataset suitable for system performance characterisation. Weather-dependent solar
183
irradiation and cumulative daily solar exposure data were also collected (at the same times as the
184
electric outputs) from the online live data broadcasts of nearby Wanneroo Weather Station operated
185
by the Department of Primary Industries and Regional Development, Government of Western
186
Australia [36]. Additional solar geometry-related data for the current (and local) Sun azimuth and
187
Sun altitude angles at the times of data logging were recorded from SunCalc.org online solar
188
astronomy calculator [37].
189
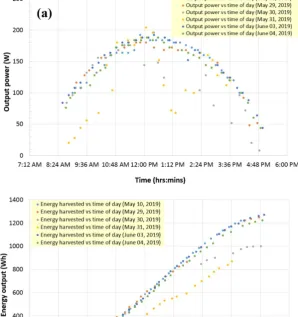
Figure 3 shows the dependencies of the generated electric power and stored energy on the time
190
of day, measured over several sunny days in May and June of 2019. It is interesting to note the high
191
consistency of the power generation on different sunny days, even measured weeks apart. The effects
192
of variable weather conditions such as cloud cover are also seen in the graphs.
194
195
Figure 3. Energy harvesting performance of 18-window solar atrium versus time of day. (a) Electric power
196
output readings recorded over several days in May-June 2019; (b) the amounts of stored electric energy vs time
197
of day; the data points used are from the same dataset of system-state records as in part (a).
198
199
It can also be noted from the data of Fig. 3 that the time distribution of the power generation
200
follows the “bell curve” shape well-known in conventional roof-based PV installations. This is despite
201
the fact that this installation does not include any optimally-tilted, north-oriented roof sections, but
202
rather is composed of an unequal number of PV generators placed into four deployment areas of
203
substantially different geometric orientations, tilts, and shading exposure conditions. Also notable is
204
the almost-linear time dependency of the stored electric energy, observed until late afternoons on
205
sunny days. Considering that the sun-path geometry over the course of day involves large changes
206
in both the azimuth and sun altitude angles, all occurring simultaneously with weather- and
time-207
dependent irradiation intensity variations across all planes, these data confirm that all four main parts
208
of this solar-window atrium provided important contributions to the daily energy generation
209
function.
210
Figure 4 shows the solar irradiation intensity dependencies of the output power (recorded on
211
different sunny days during the study), and the dependency of stored electric energy on the total
212
cumulative amount of incoming solar energy received during the day by each 1m2 of horizontal (land)
213
surface area. Both datasets are notable in terms of the data points clustering around nearly-linear
214
function shapes. Since only the horizontal-plane solar irradiation intensity was measured by the
215
weather station, and because most of the daily total energy was being generated by the eight
216
vertically-mounted north-facing windows, the data trends seen in Fig. 4(a, b) (and also in Fig. 3(b))
confirm the relative insensitivity of the electric power output and energy storage rate on the geometry
218
of sunlight incidence. This is because the transparent solar windows are of solar concentrator design
219
type, which improves the angular stability of power generation compared to conventional PV panels.
220
221
222
223
Figure 4. Energy harvesting performance vs solar exposure parameters. (a) Output power vs solar
224
irradiation intensity measured in the horizontal plane by a local weather station; (b) generated electric energy
225
vs daily land-area cumulative solar exposure (measured by the same weather station since midnight of the same
226
day).
227
It can be noted from Fig. 4(a) that the maximum output power readings have been recorded for
228
moderate horizontal-plane solar irradiance values between 300-400 W/m2. These irradiances
229
correspond to the smaller Sun altitude angles during the morning hours, when a stronger UV
230
irradiation background is usually present (compared to the afternoon hours), and colder ambient air
231
temperatures. A combination of incidence angles (in both the horizontal and vertical planes) thus
232
exists, favouring the power generation from the east-tilted roof and also the north-facing wall sections.
233
A maximum electric power output registered so far was 232 W, recorded on May 08, 2019, shortly
234
after 11 am. Since this data point was acquired outside a systematic study conducted later, it hasn’t
235
been included in the dataset of Fig. 4. For sunny Australian autumn days in May, each 1 kWh (3.6
236
MJ) of harvested electric energy corresponded to approximately 11 MJ/m2 of daily land-area
237
cumulative solar exposure. Considering the land-area footprint of this atrium structure being approx.
238
12.5 m2 (5m×2.5 m), the combined (installation-scale) direct estimate of its actual solar energy
239
harvesting efficiency is then approximately 2.6%. This figure is only marginally smaller than the rated
240
efficiency of individual solar windows at standard test conditions (~3.0%), despite the absence of any
241
optimally-tilted deployment areas and seasonal weather conditions without strong UV irradiation
242
background. Interestingly, these field-measured performance data show some contrast with the
recently reported figures for the “real” (field-measured) energy harvesting efficiencies of
244
conventional PV generator types (solar panels) evaluated in major Australian cities [38]. In particular,
245
these field-evaluated (”real”) efficiencies of most conventional solar panel types stood at only about
246
one-half of their rated energy conversion efficiency specifications. Environmental factors such as
247
partial shading and soiling of solar panels, and installation-related geometric factors such as panel
248
orientation and tilt angles, all affect the energy harvesting performance characteristics significantly
249
[39-42].
250
Table 1 shows an example of a typical daily system-related and environmental data-related
251
dataset obtained during the study. It is important to note, that Enphase data interface has always
252
rounded the output power readings to the nearest even number of Watts; this is possibly related to
253
the fact that the live data were sampled in 3-minute intervals, followed by the data averaging
254
occurring every 15 minutes prior to internet broadcasting. Also, the cumulative solar exposure
255
figures have apparently been adjusted by the weather station (however infrequently), to sometimes
256
correct the sensor readings towards smaller values (compared to the data published at previous data
257
sampling intervals) during the course of day.
258
259
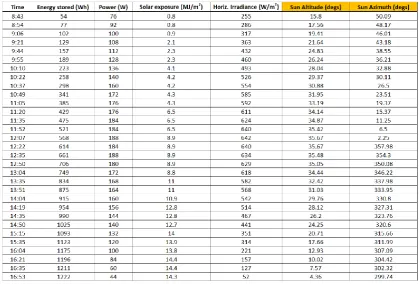
Table 1. Example of the daily dataset collected from the installation data interface and online data sources
260
on June 4th, 2019.
261
262
263
264
The datasets shown in Figure 5 illustrate the details of the atrium’s power generation trends with
265
respect to the variables such as the solar path-related angles, instantaneous irradiance intensity, time
266
of day, and weather conditions. During this study conducted over autumn and winter months, the
267
Sun altitude angle reached a maximum of only about 36° near mid-day, and therefore the solar
268
atmospheric path-length always exceeded its standardized value (air-mass 1.5, corresponding to the
269
AM1.5 NREL standard for solar spectrum measurements). Solar azimuth angles, on the other hand,
270
varied across a wide range between about 40° (NNE) and -60° (WNW) between 9:00 and 17:00. The
271
electric output power correlated well with both the Sun altitude angle and horizontal-plane
272
irradiance, despite most of the power generation obtained consistently (throughout the days) from
273
the north-oriented vertical wall of windows. It is important to note (Fig. 5(d)) that the output power
274
readings exceeding 150 W (out of the typical maximum-recorded output powers near 200W) have
275
been obtained consistently on different days, in a range of solar exposure conditions, between 10:00
and 15:00, and at a large range of horizontal-plane solar irradiance variations (between about 250 –
277
650 W/m2). This confirms the capability of this solar window atrium to collect energy efficiently in a
278
wide range of solar incidence geometry conditions, at least during clear and sunny weather
279
conditions. The dataset of Fig. 5(d) has only been collected over several weeks (and therefore, not all
280
possible independent time/solar irradiation variable combinations could be evaluated); it also
281
contains some weather-related “noise” affecting the low-power readings. This dataset is, however,
282
quite representative of the system power generation capabilities seen during most winter conditions
283
on sunny, cloudless days. We included this additional two-dimensional surface-plot representation
284
as “a guide for the eye” only, to demonstrate and visualize the time- and weather-related correlations
285
of the output power. The irradiation data used for plotting Fig. 5(d) have been grouped, so that all
286
data points for the horizontal irradiation values measured inside small intervals between eg 150-200
287
W/m2 were all assigned a 200 W/m2 value for plotting. For all “missing” output power data points
288
(due to the limited duration of study not covering all possible weather conditions) corresponding to
289
some locations across the time-irradiance data grid used, these points were approximated to
290
correspond to the minimum actually measured power values observed at boundaries of the
291
corresponding data intervals.
292
293
294
295
296
297
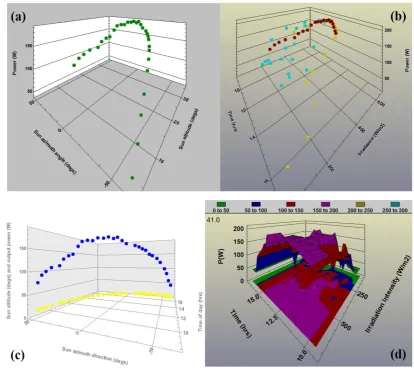
Figure 5. Electric output power trends observed with respect to the solar geometry and irradiation-related
298
parameters. (a) 3D scatter plot of the output power vs the Sun azimuth and Sun altitude angles; (b) 3D scatter
299
plot of the output power vs the time of day and the horizontal-plane solar irradiation intensity; (c) 3D scatter
300
plot of the output power shown in correlation with the Sun altitude angle, vs the Sun azimuth direction and the
301
time of day; (d) 3D surface plot (and its corresponding 2D contour plot shown in the X-Y plane underneath)
302
illustrating the variations in the electric output power with both the time of day, and the instantaneous
dependent (horizontal-plane) solar irradiation intensity. The data were collected over the entire period of study
304
(about 2 months) covering a wide range of weather conditions observed at regular intervals at most times of day.
305
306
The amounts of electric energy generated by each individual sub-section of the atrium
307
installation have also been monitored. On May 28, by 7 pm, the two shaded east-wall windows have
308
only produced 54 Wh of electric energy, whereas the four east-roof windows produced 268 Wh, the
309
8 windows on northern wall contributed 743 Wh, and 4 west-roof windows generated 191 Wh. On a
310
slightly sunnier day (June 03, 2019), the 8 front-wall windows produced 794 Wh of energy during the
311
day. Therefore, the vertically-mounted north-oriented wall windows, which were often shaded
312
temporarily by the people traffic near the shopping centre entrance, contributed daily, on average,
313
almost 100 Wh per window unit, in late-autumn conditions. Per unit window module, the daily
314
energy generation from shaded windows (on eastern wall) was a factor of 3.4 smaller compared to
315
the north-facing vertically-mounted units. Increased energy collection efficiencies are expected to be
316
observed during the spring and summer months, due to both the stronger solar irradiation intensity
317
levels, and (most importantly) the substantially longer daily sunshine durations. The
angle-318
dependent solar illumination flux-cross-section differences between the vertically-mounted and
319
peak-tilted window orientations (eg if placed onto optimally-tilted North-facing roof section) are also
320
significant. These geometric factors correspond to approximately a factor of (1/cos45°) in peak-power
321
output difference, which allows predicting the orientation-related increases in the energy outputs per
322
window by up to several tens of percent, in future optimally-mounted units. A yearly-averaged
323
estimate for the daily energy output per 1m2 of solar window area can therefore be made, based on
324
the observed data, being near 0.1 kWh/m2, presuming that installation sites are configured favouring
325
the north-facing, azimuth-optimized window orientations. For future dome-type installations, the
326
average daily energy outputs per window can be predicted, by averaging the data from the three
327
main (unshaded) parts of Warwick Grove atrium installation, leading to estimates near 70 Wh/m2.
328
These estimates can be considered conservative, since only the seasonal increases in the daily
329
sunshine durations were factored in to produce these year-scale averages. In other geographic
330
locations, where stronger yearly insolations are typically measured (eg, Middle East, or the
north-331
west of Australia), higher energy yields will be obtained.
332
333
3. Discussion and Assessment of Future Application Areas
334
In order to assess the practical applications potential of this emergent class of transparent solar
335
window-based PV, it is necessary to refer to the industry-standard system-level performance
336
indicators, the most common of which is Specific Yield. Specific yield (SY) quantifies the amounts of
337
electric energy (in kWh) harvested annually (per typical calendar year, in each installation location),
338
per each 1 kWp of installed PV generation capacity [43]. SY values are commonly used in industry to
339
directly compare the performance of different PV system configurations installed at different
340
locations. Typically measured SY values in the United States reach up to about 1500 kWh/kWp,
341
according to the data reported in [43] for conventional solar PV module installations. For
342
conventional (silicon modules-based) rooftop PV installations in Perth, Australia, average daily
343
energy generation outputs of about 4.4 kWh/kWp have been reported [44], which translates into the
344
estimated approx. SY values of near 1320 kWh/kWp, based on 300 sunny days per year in this location.
345
Accounting for the PV generation amounts during the other 65 days showing at least about a third of
346
maximum generation (compared to the stable-sunshine days, from our observations of Warwick
347
Grove Atrium energy outputs measured on rainy days in winter), a more detailed estimate for the
348
SY figure for typical Perth-based PV systems is then also close to 1500 kWh/kWp. These data sets are
349
only valid, however, for the optimally-oriented, optimally-tilted roof-based, completely unshaded
350
silicon PV module installations.
351
352
In order to evaluate the expected annual energy generation and specific yield of Warwick Grove
353
Atrium, local meteorological datasets for the monthly and yearly cumulative solar exposure values
can be used, in conjunction with the data of Fig. 4(b) for the energy yield per each MJ/m2 of solar
355
exposure. Quantified during sunny days in May, a conservative estimate (due to the weather being
356
more suitable for PV generation over many other months over the year) for this energy yield per unit
357
solar exposure, is near 1/11 kWh/(MJ/m2). According to the yearly solar exposure data summaries
358
available from a local weather station [36], the annual cumulative solar exposure figures were
359
consistently at near 7400 MJ/m2/year, in several recent years. Therefore, a conservative annual energy
360
output estimate can be obtained, being at least 673 kWh. This figure will likely be exceeded be up to
361
several hundred kWh, due to weather conditions being much more conducive to PV energy
362
harvesting in spring and summer, when both the UV and near-IR irradiation levels are much higher,
363
due to drier atmospheric conditions. Substantially stronger diffused and reflected solar irradiation
364
backgrounds are also present during the warmer months, leading (in our group’s experience) to
365
improved energy capture rates in solar windows.
366
367
It is possible to evaluate the (over-conservative) lower limit for the expected specific yield of
368
Warwick Grove Atrium installation, by using a nominal, sum-total-based installed generation
369
capacity of 18 solar windows (~0.54 kWp). Then, a standardized expected SY figure of ~1246 kWh/kWp
370
is obtained, which is still quite competitive to the typical conventional (even optimally tilted) PV
371
installations in sunny locations like Perth, especially if shading considerations are taking into account,
372
which strongly affected 2 out of 18 windows. Accounting for the real measured peak output powers,
373
and the local site-specifics of windows deployment at Warwick Grove, particularly the geometric
374
orientations of most modules being far from optimal, the actual electric output-related installed
375
capacity rating cannot exceed about 300 Wp. Using this figure, an adjusted (however non-standard)
376
estimate for the SY can be re-calculated, now exceeding 2240 kWh/kWp. This SY figure estimate
377
confirms the relative strengths of the energy harvesting approach using solar windows, compared to
378
many common types of PV systems. These strengths are due to the improved efficiency of solar
379
energy collection for light rays incident onto harvesting surfaces at large angles, which is a known
380
characteristic of luminescent concentrator-type devices, including transparent energy-generating
381
window systems.
382
383
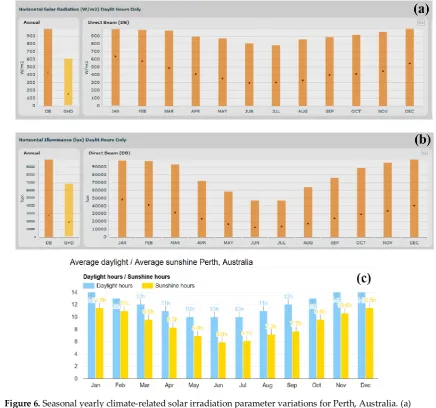
Significant seasonal variations in the daily amounts of generated energy are expected, due to
384
local climate-related variables. A graphical summary of seasonal climate-related solar irradiation
385
parameter variations for Perth, Australia is presented in Figure 6. It can be noted from Fig. 6 that very
386
strong monthly variations exist between the monthly-averaged direct-beam solar irradiation
387
intensities, the horizontal-plane illuminance, and also the mean daily total sunshine hours. The
local-388
based monthly distribution of peak output-equivalent sunshine hours for many Australian locations
389
is also known from specialized PV industry sources (eg [46]), and generally scales in correlation with
390
the mean daily total sunshine hours shown in Fig. 6(c). All of the above parameters are directly
391
relevant to the expected daily energy generation from all PV module types; further, longer-term
392
studies are necessary to generate the expected energy generation data per each calendar month.
393
394
395
396
397
398
400
401
Figure 6. Seasonal yearly climate-related solar irradiation parameter variations for Perth, Australia. (a)
402
Monthly averaged and maximum-recorded direct-beam solar irradiation intensities measured across
403
horizontal plane; (b) monthly averaged and maximum-recorded direct-beam solar illuminance values
404
measured across horizontal plane; (c) monthly distributions of the total daylight hours and the daily sunshine
405
durations. The datasets shown in parts (a) and (b) have been obtained using COMFEN 5 software [45]; the
406
dataset of part (c) has been published online by [31].
407
408
The results of this initial pilot-trial study of shopping centre entrance-based solar windows
409
installation lead to a preliminary conclusion regarding the generally expected suitability (and
410
relevance) of transparent solar windows in commercial property-based settings. It is particularly
411
important to note that the amounts (and usefulness) of the generated electric power and renewable
412
energy both scale favourably with the installation size, presuming that the geographic location is
413
suitable, and the architectural design features are adjusted to maximizing the generated energy. For
414
example, considering a semi-spherical dome-type installation housing 2000 m2 of solar window
415
surfaces, the diameter of this dome-shaped roof-based installation area will be near 35 m, a size not
416
uncommon in shopping centre properties. Based on 70 Wh/m2 estimate for the system-averaged,
417
seasonally-averaged daily energy generation, about 140 kWh of daily energy production can be
418
expected. This corresponds to the total daily energy consumption requirements of about 10
3-419
bedroom Australian households. The area under the modelled solar-window dome and its surrounds
420
will be approximately 40 m x 40 m in footprint, requiring a square 21 x 21 grid of 441 LED lamps
421
separated by about 2 m. Presuming 30W LED lamps and using the calculated daily-average energy
422
production figure, this area-lighting circuit of lamps can be run for approximately 10.5 hours.
423
Accounting for the high visual transparency of windows, with >65% of total (direct and diffused)
visible-range transparency, significant reduction in the lighting-related energy consumption can be
425
predicted. Additionally, a large degree of electricity supply blackout resistance provided by on-site
426
distributed generation using these building-material-integrated PV can be expected, provided that
427
suitable battery storage systems are installed. Other expected future application areas of highly
428
transparent energy-generating construction materials and solar windows will likely include roof-top
429
canopies, balcony glazings, skylights, and airport roofs.
430
4. Conclusions
431
A case study of a small-scale transparent solar windows installation in Perth (Australia) over the
432
period of May-June 2019 has been reported. The photovoltaic power and energy outputs have been
433
characterized during varying weather conditions and times of day. The results reported elucidate the
434
practical application potential of the described type of solar window products in various public
435
infrastructure and commercial property-based applications. In particular, a small-scale (18 windows,
436
with none installed at optimum orientation) solar window microgrid generated about 1 kWh of
437
stored electric energy per 11 MJ/m2 of land-area cumulative solar exposure, as measured by a local
438
weather station, in variable weather conditions. Each vertically-placed, north-facing window unit of
439
area near 1.3 m2 harvested approximately 0.1 kWh on each sunny winter day of total sunshine
440
duration ~6-7 h. It can be expected that multiple new commercial and residential building-based
441
installations of the latest transparent BIPV products and technologies will continue to be constructed
442
and trialled, broadening the acceptance of transparent energy-generating construction materials.
443
Author Contributions: All authors (M. V., M. N. A., and K. A.) have contributed to the design features of test
444
installation at Warwick Grove Shopping Centre (Perth, Australia), the design features of solar window modules,
445
the conceptualization of this article, and data collection; M. V. collected and analyzed the electric output and
446
weather-related datasets, and prepared the manuscript. All authors discussed the data, graphics, and the
447
presentation; M. N. A. contributed substantially to the data curation and the original draft preparation; M. V.
448
and K. A. further reviewed and edited the manuscript.
449
Acknowledgements: The authors would like to acknowledge the contributions of Gemtek Automation Pty. Ltd.
450
(Malaga, WA, Australia) and Steve Coonen (independent PV Consultant Engineer, California, USA) to the
451
microgrid configuration design and electrical installation works.
452
Funding: This research was funded by the Australian Research Council (ARC grant LP160101589) and Edith
453
Cowan University. Clearvue Technologies Ltd is Industry Partner Organisation co-operating in ARC-funded
454
research with Edith Cowan University, and have also funded the solar windows manufacture and construction
455
works at Warwick Grove Shopping Centre.
456
Conflicts of Interest: The authors declare no conflict of interest. The funders had no role in the design of the
457
study; in the collection, analyses, or interpretation of data; in the writing of the manuscript, or in the decision to
458
publish the results.
459
References
460
1. Global Building Integrated Photovoltaics (BIPV) market to witness a CAGR of 23.4% during 2018-2024,
461
Bloomberg Press Release, 25 April 2019, Available Online:
https://www.bloomberg.com/press-462
releases/2019-04-25/global-building-integrated-photovoltaics-bipv-market-to-witness-a-cagr-of-23-4-463
during-2018-2024 (sighted on 23 July 2019).
464
2. L. Capuano, International Energy Outlook 2018 (IEO2018), published by the US Energy Information
465
administration.
466
3. Hoffert, M.I.; Caldeira, K.; Benford, G.; Criswell, D. R.; Green, C.; Herzog, H.; et al. Advanced technology
467
paths to global climate stability: energy for a greenhouse planet. Science 2002, 298, 981.
468
4. Chu, S.; Majumdar, A. Opportunities and challenges for a sustainable energy future. Nature 2012, 488, 294–
469
303.
470
5. Hernandez, R.R.; Armstrong, A.; Burney, J.; Ryan, G.; Moore-O’Leary, K.; Diédhiou, I.; Grodsky, S.M.;
471
Saul-Gershenz, L.; Davis, R.; Macknick, J.; Mulvaney, D.; Heath, G.A.; Easter, S.B.; Hoffacker, M.K.; Allen,
472
M.F.; Kammen, D.M. Techno–ecological synergies of solar energy for global sustainability, Nature
473
Sustainability 2019, 2, 560-568, DOI: 10.1038/s41893-019-0309-z.
6. 20 overlooked benefits of distributed solar energy, online publication by TechXplore, 2019, Available
475
Online: https://techxplore.com/news/2019-07-overlooked-benefits-solar-energy.html (sighted on 26 July
476
2019).
477
7. Wang, W.; Shi, Y.; Zhang, C.; Hong, S.; Shi, L.; Chang, J.; Li, R.; Jin, Y.; Ong, C.; Zhuo, S.; Wang, P.
478
Simultaneous production of fresh water and electricity via multistage solar photovoltaic membrane
479
distillation. Nat. Commun. 2019, 10, 3012.
480
8. Ravyts, S.; Dalla Vecchia, M.; Van den Broeck, G.; Driesen, J. Review on Building-Integrated Photovoltaics
481
Electrical System Requirements and Module-Integrated Converter Recommendations. Energies 2019, 12,
482
1532.
483
9. Attoye, D. E.; Aoul, K. A. T.; Hassan, A. A Review on Building Integrated Photovoltaic Façade
484
Customization Potentials. Sustainability 2017, 9, 2287; doi:10.3390/su9122287.
485
10. Rezaei, S.D., Shannigrahi, S. Ramakrishna, S. A review of conventional, advanced, and smart glazing
486
technologies and materials for improving indoor environment. Sol. Energy Mater. Sol. Cells 2017, 159, 26–51.
487
11. Barman, S.; Chowdhury, A.; Mathur, S.; Mathur, J. Assessment of the efficiency of window integrated CdTe
488
based semitransparent photovoltaic module. Sustainable Cities and Society 2018, 37, 250–262.
489
12. Balin, I.; Garmider, V.; Long, Y.; Abdulhalim, I. Training artificial neural network for optimization of
490
nanostructured VO2-based smart window performance. Opt. Express 2019, 27(16), A1030-A1040.
491
13. United States Environmental Protection Agency, Distributed Generation of Electricity and its
492
Environmental Impacts. 2018 Available Online:
https://www.epa.gov/energy/distributed-generation-493
electricity-and-its-environmental-impacts (sighted 15 July, 2019).
494
14. Ramalingam, K; Indulkar, C. Distributed Generation Systems - Design, Operation and Grid Integration,
495
Chapter 3 - Solar Energy and Photovoltaic Technology, Butterworth Heinemann 2017, 69-147,
496
https://doi.org/10.1016/B978-0-12-804208-3.00003-0
497
15. Gao, D. W. Energy Storage for Sustainable Microgrid. Academic Press 2015 ISBN 978-0-12-803374-6, DOI
498
https://doi.org/10.1016/C2014-0-04144-5.
499
16. Online video presentation by Arup Group and Clearvue Technologies Ltd. 2019 Available Online:
500
http://www.clearvuepv.com/wp-content/uploads/2019/05/Arup-ClearVue-Smart-Facade-v2-900x506.mp4
501
(sighted 26 July 2019.)
502
17. Biyik, E.; Araz, M.; Hepbasli,A.; Shahrestani, M.; Yao, R.; Shao, L.; Essah, E.; Oliveira, A. C.; del Caño, T.;
503
Rico, E.; Lechón, J. L.; Andrade, L.; Mendes, A.; Atlı, Y. B. A key review of building integrated photovoltaic
504
(BIPV) systems. Engineering Science and Technology, an International Journal 2017, 20, 833-858.
505
18. Cornaro, C., Basciano, G., Puggioni, V.A., Pierro, M. Energy Saving Assessment of Semi-Transparent
506
Photovoltaic Modules Integrated into NZEB. Buildings 2017, 7, 9.
507
19. Husain, A. A. F.; Hasan, W. Z. W.; Shafie, S.; Hamidon, M. N.; Pandey, S. S. A review of transparent solar
508
photovoltaic technologies. Renew. Sust. En. Rev. 2018, 94, 779–791.
509
20. Vasiliev, M.; Nur-E-Alam, M.; Alameh, K. Recent Developments in Solar Energy-Harvesting Technologies
510
for Building Integration and Distributed Energy Generation. Energies 2019, 12(6), 1080;
511
https://doi.org/10.3390/en12061080.
512
21. Dalapati, G. K., Kushwaha, A. K., Sharma, M., Suresh, V., Shannigrahi, S., Zhuk, S., and Masudy-Panah, S.
513
Transparent heat regulating (THR) materials and coatings for energy saving window applications: Impact
514
of materials design, micro-structural, and interface quality on the THR performance. Prog. Mater. Sci. 2018,
515
95, 42-131.
516
22. Vasiliev, M.; Alameh, K.; Nur-E-Alam, M. Spectrally-Selective Energy-Harvesting Solar Windows for
517
Public Infrastructure Applications. Appl. Sci. 2018, 8(6), 849; https://doi.org/10.3390/app8060849.
518
23. Alghamedi, R., Vasiliev, M., Nur-E-Alam, M., and Alameh, K. Spectrally-Selective All-Inorganic Scattering
519
Luminophores For Solar Energy-Harvesting Clear Glass Windows. Sci. Rep. 2014, 4, 6632.
520
24. Vasiliev, M., Alghamedi, R., Nur-E-Alam, M., and Alameh, K. Photonic microstructures for
energy-521
generating clear glass and net-zero energy buildings. Sci. Rep. 2016, 6, 31831.
522
25. Rosenberg, V., Vasiliev, M., Alameh, K. (2017) A Spectrally Selective Luminescence Concentrator Panel
523
with a Photovoltaic cell. Patent EP 2 726 920 B1.
524
26. Vasiliev, M.; Alameh, K.; Rosenberg, V. A device for generating electric energy. 2016 Patent Appl.
525
US20160204297A1.
526
27. Goetzberger, A.; Greube, W. Solar-energy conversion with fluorescent collectors. Appl. Phys. 1977, 14, 123–
527
139.
28. Debije, M.G.; Verbunt, P.P.C. Thirty Years of Luminescent Solar Concentrator Research: Solar Energy for
529
the Built Environment. Adv. Energy Mater. 2012, 2, 12–35.
530
29. Mazzaro, R., and Vomiero, A. The Renaissance of Luminescent Solar Concentrators: The Role of Inorganic
531
Nanomaterials. Adv. Energy Mater. 2018, 1801903.
532
30. Liu, H.; Li, S.; Chen, W.; Wang, D.; Li, C.; Wu, D.; Hao, J.; Zhou, Z.; Wang, X.; Wang, K. Scattering enhanced
533
quantum dots based luminescent solar concentrators by silica microparticles. Solar Energy Materials and
534
Solar Cells 2018, 179, 380–385.
535
31. Monthly weather forecast and climate in Perth, Australia, Available Online:
https://www.weather-536
atlas.com/en/australia/perth-climate#uv_index (sighted on 31 July, 2019).
537
32. Online publication by Shopping Centre News, Global-first trial of a clear solar glass structure at Vicinity
538
Centres. 2019, Available Online:
https://www.shoppingcentrenews.com.au/shopping-centre-539
news/industry-news/global-first-trial-of-a-clear-solar-glass-structure-at-vicinity-centres/ (sighted 26 July
540
2019).
541
33. Vicinity Centres publication, Vicinity to reach Net Zero carbon emissions by 2030. 2019, Available Online:
542
https://www.vicinity.com.au/media-centre/media-and-news/190807_net-zero-carbon-emissions-by-2030
543
(sighted 26 July 2019).
544
34. Vicinity Centres and Mirvac celebrated for sustainability achievements, online publication by The Fifth
545
Estate, Australia, 2019. Available Online:
https://www.thefifthestate.com.au/events-tfeevents/awards-546
event-news/vicinity-centres-and-mirvac-celebrated-for-sustainability-achievements/ (sighted 31 July 2019).
547
35. Gao, L.; Dougal, R.A.; Liu, S.; Iotova, A.P. Parallel-connected solar PV system to address partial and rapidly
548
fluctuating shadow conditions. IEEE Trans. Indust. Electron. 2009, 56(5), 1548-1556.
549
36. Wanneroo Weather Station, Wanneroo, Western Australia. Live internet broadcasts of the local
weather-550
related data. Available Online: https://weather.agric.wa.gov.au/station/WN (sighted on 1 August 2019).
551
37. SunCalc.org solar astronomy online data calculator. Available Online:
https://www.suncalc.org/#/-552
31.9452,115.8816,15/2019.06.01/14:34/1/3 (sighted on 1 August 2019).
553
38. Imteaz, M. A.; Ahsan, A. Solar panels: Real efficiencies, potential productions and payback periods for
554
major Australian cities. Sust. En. Technol. Assessm. 2018, 25, 119-125.
555
39. Maghami, M. R.; Hizam, H.; Gomes, C.; Radzi, M. A.; Rezadad, M. I.; Hajighorbani, S. Power loss due to
556
soiling on solar panel: A review. Ren. Sust. En. Rev. 2016, 59, 1307-1316.
557
40. Mousazadeh, H.; Keyhani, A.; Javadi, A.; Hossein Mobli, H.; Abrinia, K.; Sharifi, A. A review of principle
558
and sun-tracking methods for maximizing solar systems output. Ren. Sust. En. Rev. 2009, 13, 1800-1818.
559
41. Meggers, F.; Aviv, D.; Charpentier, V.; Teitelbaum, E.; Ainslie, A.; Adriaenssens, S. Co-optimization of solar
560
tracking for shading and photovoltaic energy conversion. Proceedings of the 15th IBPSA Conference, San
561
Francisco, CA, USA, Aug. 7-9, 2017, 2224-2231, https://doi.org/10.26868/25222708.2017.605.
562
42. Nfaoui, M.; El-Hami, K. Extracting the maximum energy from solar panels. En. Reports 2018, 4, 536–545.
563
43. Zhang, T. What’s a good value for kWh/kWp? An overview of specific yield. 2017, Solar Power World,
564
Available Online: https://www.solarpowerworldonline.com/2017/08/specific-yield-overview/ (sighted on
565
5 August 2019).
566
44. Solar Calculator Ltd., Photovoltaic output of solar panels. 2018, Available Online:
567
https://solarcalculator.com.au/solar-panel-output/ (sighted on 5 August 2019).
568
45. COMFEN5 software, Berkeley Lab, USA. Available online:
569
https://windows.lbl.gov/tools/comfen/software-download (sighted on 6 August 2019).
570
46. Australian Solar Radiation Figures, data reproduced from from the Australian Solar Radiation Handbook,
571
April 1995 (Energy Research and Development Corporation). Available online:
572
https://www.rpc.com.au/pdf/Solar_Radiation_Figures.pdf (sighted on 6 August, 2019).