Volume 2008, Article ID 468390,9pages doi:10.1155/2008/468390
Research Article
A Framework for Automatic Time-Domain Characteristic
Parameters Extraction of Human Pulse Signals
Pei-Yong Zhang1and Hui-Yan Wang2
1Institute of VLSI Design, Zhejiang University, Hangzhou 310027, China
2College of Computer Science and Information Engineering, Zhejiang Gongshang University, Hangzhou 310018, China
Correspondence should be addressed to Hui-Yan Wang,[email protected]
Received 21 May 2007; Revised 17 September 2007; Accepted 19 November 2007
Recommended by Tan Lee
A methodology for the automated time-domain characteristic parameter extraction of human pulse signals is presented. Due to the subjectivity and fuzziness of pulse diagnosis, the quantitative methods are needed. Up to now, the characteristic parameters are mostly obtained by labeling manually and reading directly from the pulse signal, which is an obstacle to realize the automated pulse recognition. To extract the parameters of pulse signals automatically, the idea is to start with the detection of characteristic points of pulse signals based on wavelet transform, and then determine the number of pulse waves based on chain code to label the characteristics. The time-domain parameters, which are endowed with important physiological significance by specialists of traditional Chinese medicine (TCM), are computed based on the labeling result. The proposed methodology is testified by applying it to compute the parameters of five hundred pulse signal samples collected from clinic. The results are mostly in accord with the expertise, which indicate that the method we proposed is feasible and effective, and can extract the features of pulse signals accurately, which can be expected to facilitate the modernization of pulse diagnosis.
Copyright © 2008 P.-Y. Zhang and H.-Y. Wang. This is an open access article distributed under the Creative Commons Attribution License, which permits unrestricted use, distribution, and reproduction in any medium, provided the original work is properly cited.
1. INTRODUCTION
Pulse diagnosis is one of the most important examinations. The doctors diagnose the patient by feeling the pulse beating at the measuring point of the radial artery, which requires long experiences and a high level of skill. Traditional pulse diagnosis is subjective and deficient in quantitative criteria of diagnosis. Therefore, quantitative methods are needed. Much effort is being spent on pulse analysis, such as the classification of pulse waveforms [1–7] and cardiovascular assistant diagnosis [8–11]. In pulse diagnosis, time-domain parameters can reflect the specificity of pulse signals. So they are endowed with important physiological significance by specialists of traditional Chinese medicine (TCM) and have obvious medical diagnostic importance [1]. A study on the construction of pulse diagnostic model based on time-domain characteristic parameters was done in [5], which demonstrated that time-domain characteristics can be rep-resentative of pulse signals. In a pioneer work, pulse sig-nal characteristic points were mostly marked manually and the parameters were extracted by ocular estimation, which
1000 750
500 250
0
Time (ms) h1 h2h3 h
4
t1
t2 t3 G
S
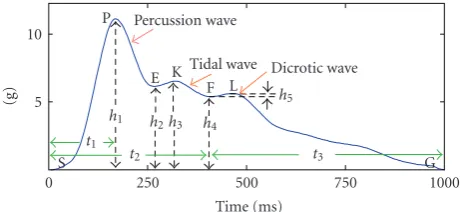
Figure1: Time-domain parameters of pulse signal. This pulse sig-nal sample is a triple-humped waveform, where S, P, E, K, F, and G are the characteristic points. The percussion wave, tidal wave, and dicrotic wave are three separate waves, on which the parameters are extracted. They-axis is the amplitude of the pulse signal whose unit is gram force (g). Thex-axis is the time whose unit is millisecond.
based on complex-valued wavelet transform and chain code is proposed and tested in this work.
In this paper, a framework for automated parameter extraction of pulse signals is constructed. The framework includes characteristic point detection, estimation of the number of pulse waveform peak, labeling of characteristic points, and parameters computation. To validate the pro-posed methodology, a pulse signal database is used, in which, five hundred pulse signal samples and corresponding param-eters computed manually by specialists are recorded from several hospitals.
This paper is organized as follows. The fundamental con-stituent of pulse signal, obtained through a pressure sensor, and the physiological significance of time-domain parame-ters are described in Section 2. The methodology of pulse parameter extraction is detailed inSection 3. The numerical experiments are reported inSection 4, followed by the con-clusion inSection 5.
2. TIME-DOMAIN CHARACTERISTIC PARAMETERS
Figure 1presents a period of a pulse waveform of a healthy
volunteer, which is obtained by a pulse transducer.Figure 2
illustrates the pulse signal acquisition system. The sampling rate is 100 Hz. The pulse transducer is belt-mounted and fixed on the radial pulse at the wrist while sampling pulse signal. This system can record a series of pulse signals under different contact pressures. The pulse signal whose modu-lus reaches the maximum is selected as the subject investi-gated. As the contact pressure of pulse transducer increases, the amplitude of the pulse signal first increases, reaching a maximum point, and then decreases. One period of pulse waveform is usually composed of three waves: a percussion wave, a tidal wave, and a dicrotic wave. The time-domain pa-rameters, which have been testified to be important for diag-nosis, are marked inFigure 1:h1,h2,h3,h4,h5,t1,t2andt3.
These parameters all have an important physiological, patho-logical and psychopatho-logical significance [1]. For example, the parameterh1is the amplitude of percussion wave, reflecting
wave, K the peak of tidal wave, F the onset of dicrotic wave, and L the peak of dicrotic wave.
The pulse waveform is called a triple-humped wave (TRI-Wave), which has three peaks. The parameter can be marked as shown inFigure 1. However, for some pulse pattern, such as slippery pulse and wiry pulse, their pulse waveforms may have two peaks, which is called a double-humped wave (DOU-Wave).Figure 3shows two Dou-Wave samples. The percussion wave of the slippery pulse is high, and the tidal wave superposes with a dicrotic wave. We named such pulse waveform as TDC-Wave, in which, the characteristic points E, K, and F are overlapping, and the parametersh3are equal
toh4[1]. For the wiry pulse, the percussion wave is round
and broad and superposes with the tidal wave. Such pulse waveform is named as PTL-Wave, in which, the characteris-tic points P, E, and K are overlapping, and the parametersh1
are equal toh3[1].
The above preliminary analysis has provided important information that the extraction of parameters not only needs to detect the characteristic points, but also requires to esti-mate the number of pulse waveform peaks, that is, to dif-ferentiate between TRI-Wave and DOU-Wave. If the pulse waveform is a DOU-Wave, it further needs to be classified into TDC-Wave and PTL-Wave.
3. METHODOLOGY
3.1. Preprocessing of pulse signals
Pulse signals can be easily contaminated by background noises, such as the uncontrollable movements of body limbs, respiration, and so on. Much work has been reported recently in pulse signal noise reduction [18] and baseline wander re-moval [19,20], which have achieved good performance. In this research, the background noise and baseline wander are eliminated based on a decomposition and reconstruction al-gorithm of wavelet, which is similar to the work done in [20]. By simulation, we found that a smooth and symmetric wavelet function, such as the Mexican Hat wavelet [21], can remove noise effectively and preserve the important infor-mation of the pulse signal at the same time. In addition, we found that the optimum scaleais equal to 4. We choose the Mexican Hat wavelet and decompose the contaminated pulse signal to scale eight. SupposeA4andA8are the
approxima-tions of the Mexican Hat wavelet at fourth and eighth scale decompositions. ThenA8is used to approximate the baseline
wander of the pulse signal, andA4−A8is just the pulse
sig-nal filtered. The reason thatA4−A8andA8are chosen as the
Preprocessing circuit
Belt
Transducer
Transducer vertical position regulator screw
Figure2: Pulse signal acquisition system, which consists of a preprocessing circuit and a pulse transducer. The preprocessing circuit is comprised of two amplifiers and an analog-digital converter. The transducer is made by Shanghai University of Traditional Chinese Medicine, Shanghai, China. It is a duplex cantilever beam transducer, which can be distinguished from sensors used in western medicine. The sensitivity and output impedance are 0.5 millivolt per gram (g) and one thousand ohm, respectively. The output dynamic range of the pulse signal acquisition system is from zero to fifty gram force (g).
1500 1250 1000 750
500 250
(ms) 0
5 10 15
(g)
h5
h3=h4
h1
(a)
1500 1250 1000 750 500 250
(ms) 0
5 10
(g) h5
h1=h3
h4
(b)
Figure3: A slippery pulse sample which is a TDC-Wave, a wiry pulse sample which is a PTL-Wave, and some of the labeling of their parameters.
10 9 8 7 6 5 4 3 2 1
(S) 0
5 10
S1(g)
(a)
10 9 8 7 6 5 4 3 2 1
(S) 0
5 10
S2(g)
(b)
Figure4: A contaminated pulse signal sample and its preprocessed result. S1 is a pulse signal sample contaminated with background noise and baseline wander. S2 is the result of S1 filtered with wavelet filter.
3.2. Detection of characteristic points
The pulse parameters are computed based on the corners of pulse signals [1]. Corners are locations where the
curva-ture changes sharply, regarded as the most descriptive fea-tures, and can be characterized by the modulus of their wavelet transforms [22]. Recently, several corner detection techniques based on WT [22–24] have been developed and applied in some domains, such as object recognition [25]. In this study, the characteristic points of pulse signals are de-tected based on complex-valued wavelet transform, which is testified to be more effective than methods based on real-valued wavelet transform by our experiments.
Letψ(x) be a complex-valued wavelet, the continuous wavelet transform of the pulse signalf(x) with respect to the waveletψ(x) is defined as
W f(a,b)=
+∞
−∞f(x)ψa(x−b)dx, (1)
whereψa(x) = 1/aψ(x/a) andψa(x) denotes the complex conjugate ofψa(x).
We choose the second derivative of the Gaussian function
θσ(x), which has two vanishing moments [13], as the real-valued waveletψr(x),
ψr
σ(x)= −
d2θδ(x)
W f = f(x)∗ψσ(x)=σ f(x)∗
dx2 . (3)
We turn the real-valued wavelet ψr(x) into the
complex-valued waveletψ(x) by means of Hilbert transformH [26] as follows:
ψ(x)=(1 +iH)ψr
σ(x). (4)
The frequency response ofψ(x) is expressed as
∧
Ψ(ξ)=K0ξ2e−ξ 2
/2χ
(0,∞)(ξ), (5)
whereχ(0,∞)(ξ) denote the Heaviside step function, which is equal to 1 whenξ >0 and to 0 otherwise.K0denote a
nor-malization constant.
Letψ(x)=ψr(x) + jψi(x), whose real part is shown as
(3). By (4), we obtain the imaginary part as follows:
ψi(x)= −1
π +∞
−∞
σ2(d2θσ/dt2)
x−t dx. (6)
By (6), the following equation can be inferred:
ψi(x)= 1
π √
2πx−θσ (x) + 2θσ(x)
. (7)
Then the complex wavelet transform of f(x) is
W fc= f∗ψ
σ(x)=σ2f(x)∗θ
σ(x)
+j−1 π
f∗
σ3θ
σ (x) + 2σθσ(x)−
√ 2π x
σ2
.
(8) Suppose Re(f∗ψσ(x)) is the real part of W fc, and
Im(f∗ψσ(x)) the imaginary part. The wavelet modulus maxima can be found by
dW fc2
dx =2
Re W fc∗Re W fc+ Im W fc
∗Im W fc=0.
(9)
The corners of the pulse signal correspond to these modulus maxima.Figure 5shows a sample of pulse signal and corre-sponding complex-valued wavelet transforms computed ac-cording to (8). The zero crossing points ofW fccorrespond
to the corners of f(x), that is, the characteristic points of the pulse signal.
3.3. Estimation of the number of pulse waveform peaks
Chain code is used to estimate the number of pulse waves in this study. The chain code is an algorithm that gives a symbolic representation of an object boundaries using a se-ries of specific directional, straight, connected lines [27]. The
−3 and 3 are not included. Therefore, the value span of chain code can be expressed as{−2,−1, 0, 1, 2}, where the number 0 represents east, 1 is northeast, 2 is north, 3 is northwest, and so on. Split the pulse waveform intoNt segments. Letd
denote the length of each segment, and letθdtrepresent the separation angle between each segment and thexaxis. The value of chain codeVdcan be defined as
Vd=
⎧ ⎪ ⎪ ⎪ ⎪ ⎪ ⎪ ⎪ ⎪ ⎪ ⎪ ⎪ ⎨ ⎪ ⎪ ⎪ ⎪ ⎪ ⎪ ⎪ ⎪ ⎪ ⎪ ⎪ ⎩
−2, −90o≤θdt<−67.5o,
−1, −67.5≤θdt≤ −22.5o,
0, −22.5o< θdt<22.5o,
1, 22.5o≤θdt≤67.5o,
2, 67.5o< θdt≤90o.
(10)
LetLddenote the chain code string of a period of pulse wave-form. We predict the number of peaks based on the fact that the values of chain code in Ld jump from a positive num-ber or zero to a negative numnum-ber gradually when there is a peak in pulse waveform. The graphical representation ofLd
is some saw-tooth, square waves, and the trailing edges cor-respond to the peaks of pulse waveform. The steps involved in this approach are summarized as follows.
(1) Find the positionspiinLd,i=1, 2,. . .,Cd, where the chain code drifts clockwise from one direction to another. Compute the length of the substring of chain code in both directions atpi, denoted ashi1andhi2, respectively.
(2) Let minhi denote the minimum ofhi1 andhi2,i =
1, 2,. . .,Cd. Set the length threshold to Td and count the number of minhi, which satisfies minhi> Td, denoted asNf. ThenNfis just the number of peaks to be estimated.Figure 7
shows the chain code graphical representation of a DOU-Wave sample and a TRI-DOU-Wave sample. The length threshold
Tdis set to 5 and the parameterdis set to 2.Nf is estimated to be 2 in the former pulse waveform and 3 in the latter one, respectively.
3.4. Characteristic points labeling
2100 1800 1500 1200 900 600 300 0
(ms) 2
4 6 8 10 12 14
(g)
(a)
2100 1800 1500 1200 900 600 300 0
(ms) −2
−1.5 −1 −0.5 0 0.5 1 1.5 2 ×10⁶
(g)
(b)
Figure5: A pulse signal sample f(x)(a), and the complex-valued wavelet transformW fc(b).
7 6
5 4
3 2 1
0
(a)
−1 −2
−3
3 2 1
0
(b)
Figure6: Eight connectivity directions and their numbering schemes (a), and the common chain code directions and their numbering scheme (b).
tidal wave K, the onset of dicrotic wave F, and the peak of dicrotic wave L, respectively, as shown inFigure 8(a).
On the basis of the concept mentioned above, DOU-Wave can be classified into TDC-DOU-Wave and PTL-DOU-Wave, in which, the characteristic points need to be labeled differently. For TDC-Wave, the percussion wave is high, steep, and thin, that is, the peak width is small. For PTL-Wave, the percussion wave is flat and broad or round and broad, that is, the peak width is large. We can differentiate TDC-Wave from PTL-Wave by computing the apex angle α of percussion wave, which can reflect the size of peak width. Suppose the coor-dinate of the peak of percussion wave P is (x,f(x)). Let P1
and P2 be points whose coordinates are (x−n,f(x−n))
and (x+n,f(x+n)). In this research,nis set to 4. The in-cluded angles between the longitudinal axis and PP1and PP2
are denoted asα1 andα2, respectively, wheretgα1 = n/l1,
tgα2=n/l2,l1= f(x)−f(x−n), andl2= f(x)−f(x+n).
Then the apex angleαcan be denoted as
tgα= tgα1 +tgα2
1−tgα1tgα2 =
n/l1+n/l2
1−n2/l 1l2 =
l2+l1
l1l2/n−n.
(11)
700 600 500 400 300 200 100 0
(ms) 0
700 600 500 400 300 200 100 0
(ms) −3
−2 −1 0 1 2 3
f
(
x
)
Ld
(a)
700 600 500 400 300 200 100 0
(ms) 0
700 600 500 400 300 200 100 0
(ms) −3
−2 −1 0 1 2 3
f
(
x
)
Ld
(b)
Figure7: A period of a DOU-Wave sample and its graphical representation of chain code string (a), and a period of a TRI-Wave sample and its graphical representation of chain code string (b).
4. EXPERIMENTAL RESULT
To analyze the performance of the methodology we pro-posed, a pulse signal database is employed, in which a to-tal of 500 pulse signals were gathered from several hospito-tals of TCM. The experiments will verify four objectives: (1) the proposed approach can detect the characteristics of the pulse signals accurately, and it is superior to the conventional tech-niques based on real-valued wavelet transform; (2) the pro-posed approach can estimate the number of pulse waveform peaks correctly, that is, the pulse waveform can be classi-fied into TRI-Wave and DOU-Wave effectively; (3) the pro-posed approach can discriminate between TDC-Wave and PTL-Wave accurately; (4) the parameters can be estimated precisely based on the proposed method.
In experiment I, we draw a comparison between the real-valued wavelet and the proposed method to validate the first objective, which is shown in Figure 9. Firstly, the background noise is removed by selecting the Mexican hat wavelet as the filter and setting a scale equal to 4. Sec-ondly, the characteristics are detected, shown by “∗.” By simulation, we found that the same characteristics are de-tected for all modulus thresholds based on complex-valued wavelet [26], which is depicted as Figure 9(b).Figure 9(c)
is a one-periodic time intercept ofFigure 9(b), which is la-beled based on a proposed method. Figures9(d) and9(e)
show that the corners detected based on real-valued wavelet are too many to be labeled. The reason is that the modu-lus of real-valued wavelet is oscillatory [13]. Figure 9(f) il-lustrates that the number of characteristics is near to six, but the position is located incorrectly when modulus thresh-old is set to twenty. This experiment testifies that the pro-posed algorithm outperforms the conventional real-valued wavelet-based method in the characteristic detection of pulse signals.
Table1: PAR results.
Pulse
waveform TRI-Wave DOU-Wave TDC Wave PTL Wave
PAR (%) 97.8 95.6 96.9 94.9
Table2: Confusion matrix of DOU-Wave and TRI-Wave.
DOU-Wave TRI-Wave
DOU-Wave 262 12
TRI-Wave 5 221
In experiment II, the second and the third objectives are validated. The predictive accuracy rate (PAR) is computed, which is defined as
PAR=number of samples correctly classified
total number of samples . (12)
700 600 500 400 300 200 100 0
(ms) 1.5
3 4.5 6 7.5 9 10.5 12
(g)
P
E K
F L
S
(a)
700 600 500 400 300 200 100 0
(ms) 1.5
3 4.5 6 7.5 9 10.5 12
(g)
P1
P P2
E(K,F) L
S
(b)
800 700 600 500 400 300 200 100 0
(ms) 1.5
3 4.5 6 7.5 9 10.5 12
(g)
P1P(E,K)P2
F L
S
(c)
Figure8: Detection result and labeling of characteristic points of a TRI-Wave (a), characteristic points detecting and labeling of a TDC-Wave whereα=5.8◦(b), and characteristic points detecting and labeling of a PTL-Wave whereα=122.8◦(c).
Table3: Confusion matrix of TDC-Wave and PTL-Wave.
TDC-Wave PTL Wave
TDC-Wave 94 3
PTL-Wave 9 168
To explore the fourth objective, we design experiment III. Firstly, we label the characteristic points manually and com-pute the parameters according to these characteristic points. The parameter set is denoted asPM = {PM1,PM2,. . .,PMN},
wherePMI= {hM1i,hM2i,hM3i,hM4i,hM5i,tM1i,tM2i,tM3i}, 1≤
i ≤ N andN = 500, is the number of pulse samples. Sec-ondly, we calculate the parameters based on the proposed methodology, and the parameter set is presented as PU =
{PU1,PU2,. . .,PUN}, wherePMI = {hU1i,hU2i,hU3i,hU4i,hU5i,
tU1i,tU2i,tU3i}. Thirdly, the mean square error function is
modified and acts as the measurement of the difference be-tweenPMandPU, which is defined as
MSE=
N
i=1 xi−xi0
2
N , (13)
wherexi ∈PUi,xi0 ∈PMi, andxiandxi0correspond to the
same parameter. Fourthly, MSE are estimated from all sam-ples, which is indicated as MSE-ERR. Finally, the samples misclassified in experiment II are eliminated, and MSE are calculated based on the residual samples, which is denoted as MSE-COR. On the basis of discussions above, if the charac-teristic points of the pulse signals are detected correctly, then MSE-COR is low and vice versa. The MSE results are pre-sented inTable 3. MSE-COR of the eight parameters are low and MSE-ERR of parametersh2,h3,h4,h5,t2, andt3are
rel-atively high. For parametersh1andt1, COR and
MSE-ERR are identical because they are not influenced by the clas-sification of pulse waveform. The parametersh2andh3may
be computed by mistake when TDC-Wave and PTL-Wave are misclassified. While the recognition of TRI-Wave and DOU-Wave is inaccurate, the computation of the parametersh4,h5,
t2andt3would be in error. This experiment validate that the
characteristic points are detected effectively and the parame-ters are computed accurately.
5. CONCLUSIONS
(ms) (a)
(ms) (b)
(ms) S
(c)
(ms)
(g)
(d)
(ms)
(g)
(e)
(ms)
(g)
(f)
Figure9: A PTL-Wave pulse signal sample, which is contaminated by background noise (a); characteristic points detection result based on a complex-valued wavelet (b); labeling result based on a proposed method (c); characteristic points detection results based on real-valued wavelet when modulus threshold is set to zero (d), ten (e), and twenty (f), respectively.
Table4: The MSE results of the parameters with the samples misclassified eliminated (MSE-COR) and the samples misclassified included (MSE-ERR).
Characteristic parameters h1 h2 h3 h4 h5 t1 t2 t3
MSE-COR 0.3235 0.2363 0.2988 0.2096 0.1625 0.1245 0.1383 0.1184
MSE-ERR 0.3235 2.0139 2.5301 1.3209 0.9531 0.1245 0.8755 1.0627
APPENDIX
THE ALGORITHM DESCRIPTION OF
AUTOMATIC TIME-DOMAIN CHARACTERISTIC PARAMETERS EXTRACTION
The proposed algorithm is executed as follows.
(1) Perform the preprocessing algorithm based on wavelet decomposition and reconstruction to remove noise and baseline wander of pulse signals.
(2) Detect the characteristic points of pulse signals based on complex-valued wavelet.
(3) Estimate the number of pulse waveform peaks based on chain code.
(4) If the pulse signal is a DOU-Wave, compute the apex angleα, according to which DOU-Wave is classified as TDC-Wave and PTL-Wave.
(5) Label the characteristic points of the pulse signals and compute the parameters.
REFERENCES
[1] Z. F. Fei,Contemporary Sphygmology in Traditional Chinese Medicine, People’s Medical Publishing House, Beijing, China, 2003.
[2] M. F. Abbod, D. G. von Keyserlingk, D. A. Linkens, and M. Mahfouf, “Survey of utilisation of fuzzy technology in medicine and healthcare,” Fuzzy Sets and Systems, vol. 120, no. 2, pp. 331–349, 2001.
[3] Y.-Z. Yoon, M.-H. Lee, and K.-S. Soh, “Pulse type classification by varying contact pressure,”IEEE Engineering in Medicine and Biology Magazine, vol. 19, no. 6, pp. 106–110, 2000.
[4] L. Xu, D. Zhang, K. Wang, and L. Wang, “Arrhythmic pulses detection using Lempel-Ziv complexity analysis,”EURASIP Journal on Applied Signal Processing, vol. 2006, Article ID 18268, 12 pages, 2006.
[5] H. Wang and Y. Cheng, “A quantitative system for pulse di-agnosis in traditional Chinese medicine,” inProceedings of the 27th Annual International Conference of the IEEE Engineering in Medicine and Biology Society (EMBS ’05), vol. 7, pp. 5676– 5679, Shanghai, China, September 2005.
[6] L. S. Xu, K. Q. Wang, and L. Wang, “Pulse waveforms classifi-cation based on wavelet network,” inProceedings of the 27th Annual International Conference of the IEEE Engineering in Medicine and Biology Society (EMBS ’05), vol. 7, pp. 4596– 4599, Shanghai, China, September 2005.
[7] L. Wang, K.-Q. Wang, and L.-S. Xu, “Recognizing wrist pulse waveforms with improved dynamic time warping algorithm,” inProceedings of the 3rd International Conference on Machine Learning and Cybernetics (ICMLC ’04), vol. 6, pp. 3644–3649, Shanghai, China, August 2004.
the 16th IEEE Symposium on Computer-Based Medical Systems (CBMS ’03), pp. 236–241, New York, NY, USA, June 2003. [9] Y. Diao, S. C. Wu, Y. J. Liu, S. Zhang, and Y. M. Yang, “An
algorithm for automatically detecting the pulse waveform of radial artery,”Beijing Biomedical Engineering, vol. 25, no. 1, 2006 (Chinese).
[10] P. H. Tsui, L. Y. Lin, C. C. Chang, et al., “Arterial pulse wave-form analysis bya the probability distribution of amplitude,”
Physiological Measurement, vol. 28, no. 8, pp. 803–812, 2007. [11] X. J. Huang, X. Wu, and F. Li, “Application of syntactic pattern
recognition in research on pulse wave’s characteristic infor-mation,”Chinese Journal of Medical Instrumentation, vol. 29, no. 5, 2005 (Chinese).
[12] I. Daubechies,Ten Lectures on Wavelets, SIAM, Philadelphia, Pa, USA, 1992.
[13] S. Mallat and W. L. Hwang, “Singularity detection and pro-cessing with wavelets,”IEEE Transactions on Information The-ory, vol. 38, no. 2, pp. 617–643, 1992.
[14] L. J. Yang, Z. C. Song, S. P. Wang, and L. Chen, “Pulse signal identification based on wavelet transform and the fractal the-ory,”Techniques of Automation and Applications, vol. 25, no. 7, pp. 9–12, 2006.
[15] L. Q. Zhang, Y. Li, and X. J. Zhang, “A method to extract the feature of the pulse signal based on the wavelet packet,”Beijing Biomedical Engineering, vol. 24, no. 3, pp. 214–217, 2005. [16] Y. Wang, T. Bai, and J. L. Kang, “Acquisition of pulse
charac-teritics based on wavelet modulus maximum principle,”Space Medicine & Medical Engineering, vol. 19, no. 1, pp. 41–46, 2006.
[17] P. P. Yue and X. M. Li, “Pulse signal feature extraction and analysis based on wavelet transform,”Chinese Medical Equip-ment Journal, vol. 27, no. 1, pp. 23–25, 2006.
[18] Y. W. Li, Y. P. Jing, T. Zheng, and Z. K. Yan, “Pulse wave sig-nal denoisng based on the wavelet transform,”Journal of Hebei University of Technology, vol. 34, no. 4, 2005 (Chinese). [19] L. Xu, D. Zhang, and K. Wang, “Wavelet-based cascaded
adap-tive filter for removing baseline drift in pulse waveforms,”IEEE Transactions on Biomedical Engineering, vol. 52, no. 11, pp. 1973–1975, 2005.
[20] L. Xu, D. Zhang, K. Wang, N. Li, and X. Wang, “Baseline wander correction in pulse waveforms using wavelet-based cascaded adaptive filter,”Computers in Biology and Medicine, vol. 37, no. 5, pp. 716–731, 2007.
[21] K. C. Charles,An introduction to wavelets, vol. 1 ofWavelet Analysis and its Applications, Academic Press, New York, USA, 1992.
[22] Z. Nenadic and J. W. Burdick, “Spike detection using the con-tinuous wavelet transform,”IEEE Transactions on Biomedical Engineering, vol. 52, no. 1, pp. 74–87, 2005.
[23] G. Heidemann, “The long-range saliency of edge- and corner-based salient points,”IEEE Transactions on Image Processing, vol. 14, no. 11, pp. 1701–1706, 2005.
[24] A. Quddus and M. M. Fahmy, “Improved wavelet-based cor-ner detection technique,” in Proceedings of IEEE Interna-tional Conference on Acoustics, Speech and Signal Processing (ICASSP ’99), vol. 6, pp. 3213–3216, Phoenix, Ariz, USA, March 1999.
[25] F. A. Cheikh, A. Quddus, and M. Gabbouj, “Multi-level shape recognition based on wavelet-transform modulus maxima,” inProceedings of the 4th IEEE Southwest Symposium on Image Analysis and Interpretation (SSIAI ’00), pp. 8–12, Austin, Tex, USA, April 2000.
[26] C.-L. Tu, W.-L. Hwang, and J. Ho, “Analysis of singularities from modulus maxima of complex wavelets,”IEEE
Transac-tions on Information Theory, vol. 51, no. 3, pp. 1049–1062, 2005.