Volume 2010, Article ID 983581,15pages doi:10.1155/2010/983581
Research Article
Multiclient Identification System Using
Adaptive Probabilistic Model
Chin-Teng Lin,
1Linda Siana,
1Yu-Wen Shou,
2and Chien-Ting Yang
1 1Department of Electrical and Control Engineering, National Chiao Tung University, Hsinchu 300, Taiwan 2Department of Computer and Communication Engineering, China University of Technology, Hsinchu 303, TaiwanCorrespondence should be addressed to Yu-Wen Shou,[email protected]
Received 1 December 2009; Revised 26 February 2010; Accepted 14 April 2010
Academic Editor: Yingzi Du
Copyright © 2010 Chin-Teng Lin et al. This is an open access article distributed under the Creative Commons Attribution License, which permits unrestricted use, distribution, and reproduction in any medium, provided the original work is properly cited.
This paper aims at integrating detection and identification of human faces in a more practical and real-time face recognition system. The proposed face detection system is based on the cascade Adaboost method to improve the precision and robustness toward unstable surrounding lightings. Our Adaboost method innovates to adjust the environmental lighting conditions by histogram lighting normalization and to accurately locate the face regions by a region-based-clustering process as well. We also address on the problem of multi-scale faces in this paper by using 12 different scales of searching windows and 5 different orientations for each client in pursuit of the multi-view independent face identification. There are majorly two methodological parts in our face identification system, including PCA (principal component analysis) facial feature extraction and adaptive probabilistic model (APM). The structure of our implemented APM with a weighted combination of simple probabilistic functions constructs the likelihood functions by the probabilistic constraint in the similarity measures. In addition, our proposed method can online add a new client and update the information of registered clients due to the constructed APM. The experimental results eventually show the superior performance of our proposed system for both offline and real-time online testing.
1. Introduction
Biometrics has been an emerging technology for identifying
people by their physical and behavioral characteristics [1,2],
and its applications have attracted more and more atten-tions of researchers recently. Some physical characteristics of an individual could be used in biometric identifica-tion/verification system, such as fingerprint, palm print, face, and ear. Similarly, the behavioral characteristics included signature, speech, gesture, and gait. Among all biometric identification fields, face recognition has always been consid-ered much more popular and significant. Face detection and recognition were also used in video surveillance and human computer interface. Furthermore, face recognition with the passive and nonintrusive benefits would be more appropriate for personal identifications.
A typical face recognition system was composed of two parts, face detection and face identification. It would be quite
challenging for face detection to localize the faces in an image because the detected results might highly depend on the surrounding conditions such as environments, movements, lighting, orientations, and even the expressions of faces. These variant factors may lead to the changes of colors, luminance, shadows, and contours of images. For this reason, it is impractical to detect faces by using a single feature.
Papageorgiou et al. [3] proposed a 2-D Haar feature to
detect objects by using SVM (Support Vector Machine) in the training multiple Haar features. Li et al. [4] proposed a “Floatboost” algorithm to delete the worse face features to improve the detection rate and speed. Liehhart and Maydt [5] proposed the extensive set of Haar-like features for the rapid object detection, which gave the versatile uses of Haar features and improved the precisions of object detection. Then Viola and Jones [6] proposed three important methods
to detect objects efficiently. First, they applied integral images
Camera
Mutiscale searching window
Lighting normalization
Face detector based on Adaboost
Face regions candidate
Region based clustering
Facial feature extraction (eigenfaces) Face identifier
based on APM Client/impostor
Client database Decision
Face database
Face region
Updating Training
Training
Figure1: Architecture of the proposed face recognition system.
a simple and efficient classifier based on the Adaboost
learning algorithm [7] was used to select a small number of features from a very large range of potential features. Third, they presented a cascaded-combined-classifier method to speed up the processing time.
Face identification was to identify faces in the registered database. While many approaches of face identification have aimed at identifying faces under slight changes of lighting, facial expressions, and poses, reliable techniques for identification under drastic variations have proven elusive. The major issue in the view-independent face identification
was how to identify a registered face from different
view-ing directions. There were different kinds of methods for
handling posed variations in face identification, including the invariant-feature method, 3D model-based method, and multiview method. The invariant-feature method attempted to extract features of faces from novel views, and uses these features to identify the faces [8–10]. One major disadvantage
of this method was the unfeasibility of finding the sufficient
invariant features for identification. The 3D model-based method focuses on constructing a prototypical view from a 3D model. As what [11] has mentioned, the 3D model-based method can work well for faces with small angles of rotations. However, this kind of methods might fail for faces with larger rotations due to the invisibility of some important features [12]. The multiview method could
be more significant since the sufficient number of faces
in different views would be taken into consideration to
deal with the pose problems [13]. Beymer [14] modeled
faces from 15 views, and sampled different poses from the
viewing sphere. The way of face identification consisted of two main stages, the geometrical alignment and correlation for matching. There have been also other works presented and proven to be robust to changes of viewpoints. One of them was the well-known single-view eigenspace approach, and its concept was based on the principal component analysis (PCA) [15–20]. Many related works were proposed to improve either the performance of face detection or face identification. However, a complete face recognition system including face detector and identifier was rarely proposed in the recent researches. Moreover, most of presented works were lack of flexibility to add new clients and to update
the clients’ information automatically. For more real-time applications, we in this paper tended to propose a practical system by integrating both face detection and identification systematically. Our proposed system used the cascaded Adaboost learning algorithm in face detection, and achieved the multiclient identification mechanism by using adaptive probabilistic model (APM). This paper would be organized in the following sections. First, our presented face detection system included histogram lighting normalization, feature selection, the cascaded Adaboost classifier, and the region-based clustering algorithm. After that, the identification process including similarity measurement and the parameter adjustment by APM would be introduced. Finally, the experimental results and conclusions would be given to be summarized.
2. Face Recognition System
The architecture of face recognition system in our work was
shown in Figure 1. The system consists of face detection
system localizing the face regions in a captured image, and face identifier identifying “who” may belong to the extracted face. We presented a novel idea, the searching windows with
various sizes, which would be used to find different face
candidates in multiscales. The face candidates in different
scales truly reflect various distances of clients from cameras. We totally define 12 searching windows in various sizes
from the smallest block size of 24 × 24 to the biggest
one by a multiplier of 1.25. While a camera acquires an
image, the camera would produce the images in different
illuminating intensities depending on the light surrounding clients. Therefore, it would be necessary for an accurate recognition process to normalize the changes of light with respect to the surrounding environments.
2.1. Lighting Normalization. The lighting normalization is based on a histogram fitting method. The primary task of histogram fitting is to transform the candidate histogram
H(l) to the target oneG(l) for l = 0,. . .,L−1 where L
represents the number of discrete gray levels. Our target
histogramG(l) was chosen as the histogram of image closest
0 10 20 30 40 50 60
MG→U(l)= l
j=0G(j)
L−1
j=0G(j)
MG→U(l)
l 0
0 −50 0 50 100 150 200 250 300
(a)
0 5 10 15 20 25 30
MH→U(l)= l
j=0H(j)
L−1
j=0H(j)
MH→U(l)
l 0
0
MH→U(hi)
hi −50 0 50 100 150 200 250 300
(b)
Figure2: The candidate and target histograms, and their corresponding distributions.
MU→G(MH→U(l))
MH→U(hi) MH→U(l)
0 0
Figure3: The distribution ofMH→G(l).
and target histogramG(l) would be mapped to the uniform
distributionsMH→U(l) andMG→U(l)
MH→U(l)=
l j=0H
j L−1
j=0H
j, MG→U(l)= l
j=0G
j L−1
j=0G
j, (1)
whereMH→U(l) andMG→U(l) are monotonically increasing.
The histogramsH(l) can be mapped toG(l) byMH→G(l) in
the following equation:
MH→G(l)=MU→G(MH→U(l)). (2)
MU→G(l) denotes the inverse mapping ofMG→U(l). For each
pixel in the original image, if the value of some pixel ishi,
we will firstly maphito its corresponding valueMH→U(l) as
shown inFigure 2. After that,MH→U(l) will be mapped to
MH→G(l) by using the iterative scheme, which can be also
illustrated inFigure 3. To demonstrate the practical changes
after the lighting normalization, we showed the chosen target
imageG(l) and the images before and after normalization
in Figures 4(a), 4(b), and 4(c), respectively. The images
with over-dark or over-light intensities would be normalized to the target one. Therefore, the histograms after lighting normalization would be similar to the histograms of targets.
2.2. Feature Selection. The intensity based features employed in this paper were based on Haar features. We selected four
types of rectangle features as illustrated inFigure 5, including
the vertical edge, horizontal edge, vertical line, and diagonal edge proposed by Papageorgiou [3]. In fact, it is feasible
to use the composition of different brightness rectangles
to represent the light and dark regions in the image. The features are defined in the following equation:
valvesubtracted= fx,y,w,h, Type, (3)
where (x,y) indicate the origin of the relative coordinate of
rectangle features in the searching window. The significance
ofwandhdenote the relative weight and height of rectangle
features, respectively. Type presents the type of rectangle
features, and valvesubtractedis the sum of the pixels in the white
rectangle subtracted from those in the black ones.
A single rectangle feature which best separates the face and nonface samples can be considered as a weak classifier
h(x,f,p,θ) as shown in the following equation:
hx,f,p,θ= ⎧ ⎨ ⎩
1, if p f(x)< pθ,
0, otherwise. (4)
The weak classifierh(x,f,p,θ) used to determine if the
x-block image is a face or a nonface depends on the feature
0 10 20 30 40 50 60
G(l)
Target image
−50 0 50 100 150 200 250 300 (a)
0 5 10 15 20 25 30
H(l)
−50 0 50 100 150 200 250 300 −050 0 50 100 150 200 250 300 10
20 30 40 50 60 70 80
H(l)
0 10 20 30 40 50 60
−50 0 50 100 150 200 250 300 H(l)
(b)
0 10 20 30 40 50 60
MH→G(l)
−50 0 50 100 150 200 250 300 −050 0 50 100 150 200 250 300 10
20 30 40 50 60 70
MH→G(l)
0 10 20 30 40 50
−50 0 50 100 150 200 250 300 MH→G(l)
(c)
Figure4: Lighting normalization. (a) Target image, (b) Input images, (c) Lighting normalized images.
w
h (x,y)
Type 1 (a)
w
h (x,y)
Type 2 (b)
w
h (x,y)
Type 3 (c)
w
h (x,y)
Type 4 (d) Figure5: Four types of rectangle features.
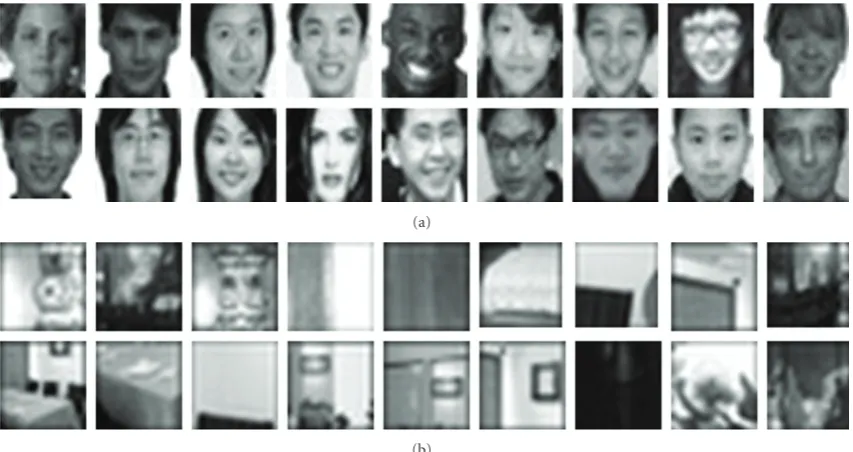
indicating the signs of inequality. For each weak classifier, an optimal threshold is chosen to minimize the possibilities of misclassifications. The selected threshold for each rectangle feature is acquired through the training process by our database which consists of 4000 face images and 59000
nonface images. Figures 6(a) and 6(b) present some face
and nonface examples in our database. In this procedure, we
could collect the distributions of f(x,y,w, andhtype) for
each image in the database, and then a threshold with higher distinguishability in clustering would be chosen. Although each rectangle feature can be obtained easily, computing the complete set of all features is extremely costing. Take the
smallest searching window of 24×24 block size, for example,
the entire number of rectangle features will be 160,000. The Adaboost method combines a collection of weak classifiers to form a stronger classifier. Since the stronger classifier is rather time consuming, the structure of cascaded classifiers by Viola and Jones [6] will be preferred to improving the detection performance and reducing the computational time. As a result, our cascaded Adaboost classification based on the stronger classifier will classify each extracted face image step by step. In each step, only the image-block classified as a face may be essential to go to the
(a)
(b)
Figure6: Database of face detection system. (a) Face images, (b) Non-face images.
an excellent detection rate and the minimized computational loading. For example, a detection rate of 0.9 can be achieved by 10-step classifier for the detection rate of 0.99 in each
step (0.9 ≈ 0.9910). The procedure of our implemented
Adaboost process can be simply described as the following
equations. Ifm andlare the number of nonface and face
samples, respectively, andjis the sum of nonface and face
samples, the initial weightwi,jfor theith-stage can be defined
aswi,j=1/2m, (1/2l) foryj=0, 1. The normalized weighted
error with respect to the weak classifier can be expressed in the following equation:
εi=min f,p,θ
j
wi,j h
xj,f,p,θ
−yj . (5)
The updating weights for each iteration are defined in (6)
whereej equals to 0 if the object is classified correctly and
vice versa:
wi,j=wi,jβ1− ej
i . (6)
Also, the final classifier for the ith-stage is defined in the
following equation:
Cxj
=
⎧ ⎪ ⎨ ⎪ ⎩
1, αih
xj,f,p,θ
≥1
2αi,
0, otherwise,
(7)
whereαi=log(1/βi) andβi=εi/(1−εi)
2.3. Region Based Clustering. The face detector usually finds more than one face candidate even though only one single
face appears in an image, which is illustrated in Figure 8,
and a region-based clustering method is used to solve this kind of problems. The proposed region-based clustering
method consists of two levels of clustering, local and global scale clustering. The local scale clustering is used to cluster the blocks in the same scale and design a simple filter to determine the number of blocks within clusters. While the number of blocks in some cluster is more than one, that cluster will be reserved as the possible candidate of faces, otherwise it will be discarded. The local scale clustering judges if the blocks meet the decision rule in (8). In (8), the
overlap rate (x,y) is the percentage overlapped between two
detected regions,xandy, and distance (x,y) is the distance
of centers in these two regions. The equality,cluster (x,y)=1
means the block x andy are in the same cluster and the
regions are completely overlapped
clusterx,y=
⎧ ⎪ ⎪ ⎪ ⎪ ⎨ ⎪ ⎪ ⎪ ⎪ ⎩
1, if overlap ratex,y≥THoverlap rate
and distancex,y≤THdistance,
0, otherwise.
(8)
Figure 9shows several cases of the clustering process. In Figure 9(a), the two blocks are processed as the same cluster,
and inFigure 9(b)the two blocks are processed as different
clusters because the distance of the centers does not satisfy
distance (x,y) ≤ THdistance. For the special case as shown
inFigure 9(c), they are all considered as face candidates but most of them are false accept blocks. Therefore in this paper for practical applications, we only choose one block that
satisfies overlap rate(x,y)≥ THoverlap rate rather than select
Database Lighting normalization
Non-face
Face
Fr
am
es
Subtracted value
Each feature’s threshold value
Figure7: The process in selecting the threshold value for features in each rectangle.
(a) (b)
Figure8: Some results in face detector.
(a) (b) (c)
Figure9: Examples of overlapped regions and the distance of centers of two blocks, (a) the same cluster, (b) two different clusters, (c) a special case, more than two blocks overlapping.
(a) (b)
20 30 40 50 60 70 80 90
Su
m
o
f
ei
ge
n
va
lu
e
0 10 20 30 40 50 60 70 80 90 100 Number of principle component
(a)
20 30 40 50 60 70 80 90 100
Det
ection
rat
e
0 20 40 60 80 100 120 140 160 180 200 Number of principle component
(b)
Figure11: The pattern information for the specific dimensions of image subspace (a) the sum of eigenvalues and (b) the detection rate with respect to the number of eigenvectors.
Figure12: Five different head orientations of a client.
one block will be precisely clustered as a face region after applying our local and global clustering processes even though more than five face candidates are obtained for an image with only five faces.
3. Face Identification
We have two major parts of face identification in this work, facial feature extraction and adaptive probabilistic model (APM). The facial feature extractor is constructed by
principle component analysis (PCA) [17] which effectively
reduces the number of dimensions by maximizing the projections of scatters of all samples. To begin with, we have
a training set of N images and each image consists of n
elements. In our case,Nequals to 4000 which indicates the
total number of images in the database. Each image has n
elements with the size equaling to 24×24 or a 576-element
vector.
The process of obtaining a single space consists of finding
the covariance matrixCof the training set and computing
the eigenvectorsvk fork = 1, 2,. . .,n. The eigenvectors vk
corresponding to the largest eigenvaluesλkspan the base of
searching subspaces. Each original image can be projected into the subspace as in the following equation:
ηk=vTk ·Φs k=1, 2,. . .,m, (9)
where m(m < n) is the chosen dimensionality of the
image subspace, and Φs = Γs −Ψ represents the relation
ofΓs, a set of projected training images, andΨ,the average
image of the training set. If m is closer to n, the results
of face identification will be more precise. But the face identification takes more computational time to project the original images into the corresponding subspaces. Hence, we have to choose the appropriate dimensionality of image
subspaces. Figure 11shows one instance of how we
deter-mine the number of image subspaces.Figure 11(a)indicates
that the pattern information about representative facial features will gain when the number of principle components
increases. But the detection rate in Figure 11(b) will be
noises involved. Therefore, how to determine the optimal number of eigenvectors will be much more significant, and this idea contributes to one of the major points in this paper. We can easily observe that the performance of the
detection rate descends by the effect of noises. From the
observations in simulations, we can determine the number of eigenvectors in our face identification system by the pattern information and detection rate in about 81% and 93%, respectively.
3.1. Similarity Measure. The APM method is proposed to achieve the faster and functional goals for face identification. It can online register new clients and update the clients’ information. This capability can enhance the practicability and heighten the identification rate of the proposed system for more other applications. The primary concept of APM architecture is based on the view-independent face identifi-cation. The view-independent model of face identification is more robust than the single-view one because the head orientations of a person may be changeable in the real conditions. In our proposed system, the view-independent
model of face identification system is built with five different
head orientations for each client as shown in Figure 12.
The APM method follows the probabilistic constraint in the similarity measures to design a model of likelihood functions, since the judgment rules of classifications depend
on the degree of likelihoods. We denote a testing samplex,
and the similarity betweenxand each registered client can
be computed by the likelihood function of each client. The
testing samplexwill be classified as the client by the largest
similarity. The likelihood function APMc(x) for class c is
a mixture of probabilistic functions which is shown in the following equation:
APMc(x)=
5
j=1
wc,j,tpc,j(x), (10)
wherepc,j(x) for j=1, 2,. . ., 5 is defined as the probabilistic
function in (11) andwc,j,tis the weighting value which can
be expressed in the following equation:
pc,j(x)=
1
(2π)d/2
1 σc,j,td
×exp −1 2
x−μc,j,t
T
[Σ]−1x−μc,j,t
, (11) 5 j=1
wc,j,1=1. (12)
With the assumptions in (13), the probabilistic function (11)
can be simplified to (14). And our initial weightwc,j,1is set
0 10 20 30 40 50 60 70 80 90 100 Det ection rat e
5 10 15 20 25 30 35 40 45 50
Parameter
Figure 13: The detection rate with respect to different j of the covariance matrix.
to be 0.2 for eachj-head orientation:
|Σ| =σc2,dj,t−→ |Σ|1/2=σcd,j,t,
[Σ]=σc2,j,t·I−→[Σ]−1=σc−2,j,t·I,
(13)
pc,j(x)=
1
(2π)d/2
1 σc,j,td
exp ⎛ ⎜ ⎝− x−μc,j,t
T
x−μc,j,t
2σc,j,t2
⎞ ⎟ ⎠.
(14)
The other parameters in (10)–(14) such ast,d,μc,j,t,σc,j,t
represent the time for updating each client’s information, the dimension of input vectors, the mean vector, and the covariance matrix, respectively.
3.2. Parameter Tuning and Adaptive Updating. The
covari-ance matrixσc,j,tmay affect the performance of APM, so we
are inspired to optimize the covariance matrixσc,j,t. We have
the face database which contains the images of 10 persons in
our simulations, and initialize the covariance matrixσc,j,0by
the variance of training data. We can then obtain the updated
covariance matrixσc,j,1by the following equation:
σc,j,1= 1
j×σc,j,0. (15)
The detection rate with respect to differentjof the covariance
matrix σc,j,1 is shown inFigure 13. The detection rate will
be obviously improved for 4< j < 43. We can thus choose
the parameterjto be 5 and obtain an optimized covariance
matrix σc,j,1 in parameter tuning of APM throughout this
paper.
The adaptive updating process focuses on the parameter updating of APM. The design of adaptive updating for APM can improve the detection rate of face identification. As the number of updating iterations increases, APM will become more robust and can be simulated to identify the heads in
20 30 40 50 60 70 80 90 100
Det
ection
rat
e
0 0.1 0.2 0.3 0.4 0.5 0.6 0.7 0.8 0.9 1 Parameterα
(a)
20 30 40 50 60 70 80 90 100
Det
ection
rat
e
0 0.1 0.2 0.3 0.4 0.5 0.6 0.7 0.8 0.9 1 Parameterρ
(b) Figure14: Detection rate, for (a) the parameterαand (b) the parameterρ.
(a) (b)
Figure15: Face detection results for (a) a single face and (b) multifaces in an image.
While a client is identified correctly, the functional APM will be updated immediately by using the following equation:
wc,j,t=(1−α)wc,j,t−1+α
Mc,j,t
,
Mc,j,t=
⎧ ⎨ ⎩
1, if mapped,
0, otherwise,
μc,j,t=
1−ρμc,j,t−1+ρx
σc2,j,t=
1−ρσc2,j,t−1+ρ
x−μc,j,t
T
x−μc,j,t
,
(16)
whereαandρare the learning rates for the weights, mean
and covariance matrix. The parameter μc,j,t and σc,j,t for
unmatched distributions remains the same. The magnitude
of learning rates may have influences on the efficiency of
APM updating, and a large learning rate will make the likelihood functions of APM over-fitted while the small learning rate results in the worse detection rate. We use the ORL database which contains 40 persons to select the
parameterαandρ. Also, we have ten images for each person;
five of them are used in the training data, two of them are for the testing data, and the others are for the updating data.
Figures14(a)and14(b)show the detection rates regarding
to the parameter α andρ, respectively. To obtain the best
detection rates in the experimental results, we can choose
0.05 for the parameterαand 0.2 for the parameterρ.
4. Experimental Results
The experimental results could be divided into two sections, face detection and face identification. We also compared our face detection results with OpenCV (Open Source Com-puter Vision Library Community). For experiment in face identification, both of face detection and face identification had to work together. Our proposed system could work
well for both offline and online testing. Our online testing
mechanism could automatically capture images frame by frame from a fixed camera in order to achieve the real-time purposes, and update parameters of APM or add new clients.
4.1. Face Detection. Figures 15(a)and15(b) presented the results of face detection for an image with a single face or
multiple faces. In the case of multipersons with different
50 55 60 65 70 75 80 85 90 95 100
Det
ection
rat
e
0.53 0.535 0.54 0.545 0.55 0.555 0.56 0.565 Threshold
With lighting Without lighting
(a)
0 10 20 30 40 50 60 70 80 90 100
Er
ro
r
rat
e
0.53 0.535 0.54 0.545 0.55 0.555 0.56 0.565 Threshold
With lighting Without lighting
(b)
0 10 20 30 40 50 60 70 80 90 100
Fa
ls
e
acce
p
t
im
ag
es
0.53 0.535 0.54 0.545 0.55 0.555 0.56 0.565 Threshold
With lighting Without lighting
(c)
Figure16: The performance of face detectors in different thresholds for (a) the detection rates, (b) The error rates, (c) The numbers of false accept images.
Figure17: Face detection results of the proposed system and OpenCV.
pictures with 434 labeled frontal faces, which were collected randomly from BaoDataBase, Carnegie Mellon Test Images,
and the collected pictures of our own. Table 1 displayed
the comparison results of face detectors between with and
without lighting normalization. Figures16(a)–16(c)showed
the detection rates, error rates, and the numbers of false
accept images in different thresholds. We tested 7 different
thresholds for our face detector, and calculated the accuracy, error, and the numbers of false accept images correspond-ingly. In our results, the performance of face detectors with lighting normalization would be better than that without lighting normalization. We also compared our face detection system with OpenCV for the same testing set. The testing results of OpenCV were the detection rate 81.36%, error rate 26%, and the number of false-accept images 5. Although the
number of false-accept images by OpenCV’s was smaller than that by our method in some special case, the detection rate by our method would be better than that by OpenCV’s for the
threshold value smaller than 0.56. Figure 17demonstrated
the results of face detection where the images in the top and bottom row images indicated the detected results of our proposed face detector system and OpenCV’s, respectively. It could be observed that our face detector could localize most of face regions precisely except the images shown in the second row. Most of the erroneous results occurred because the face images in the used database were most from Westerns but not from Asians.
Table1: The comparisons of face detectors between with and without lighting normalization.
Threshold Detected rate (%) Error rate (%) Numbers of false accept images
without with without with without with
0.5600 72.02 78.60 40 13 13 20
0.5550 73.12 82.80 30 7 21 31
0.5525 74.53 85.11 26 6 23 34
0.5500 74.55 85.57 26 5 29 39
0.5450 76.92 86.70 20 4 38 43
0.5400 80.24 87.29 13 4 51 58
0.5350 82.86 88.29 8 2 54 66
Table2: The comparison of characteristics for the proposed method and others.
Comparison parameters Eigenfaces [17] PCA+CN [19] SOM+CN [20] PCA+APM
Method Feature Eigenfaces Eigenfaces Self-organizing map Eigenfaces Classification K-nearest neighbor Neural Network Neural Network Adaptive Probabilistic Model
Characteristic
Training time Quick Slow Slow Quick
Update ability No No No Yes
Add client Yes No No Yes
Practicability Better Worse Worse Better
other methods. The compared methods included Eigenfaces, PCA+CN (Principal Component Analysis and Convolu-tional Neural Network), and SOM+CN (Self Organizing Map and Convolutional Neural Network). Our arguments in comparisons were based on the training computational time, the updating ability, and the ability to add the client’s database in practicability. Because our system was developed
under the considerations of efficiency and performances in
real-time environments, the practicability would be the most important one of all the factors. Our system could register new clients and update the client’s information online in the real-time cases to achieve practicability.
4.2.1. Offline Testing . Table 3presented the comparisons of detection rates, in which the testing set used ORL database including 40 persons with ten images of each. We selected 3-images, 4-images, and 5-images of each person to be
the training data, and the remained for testing. Table 3
showed that the more images of each person used in the training process led to the higher detection rates. The lighting normalization also had a great impact on the detection rate. The detection rate without using lighting normalization was slightly below SOM+CN and the methods with lighting normalization, and the detection rate would be higher by about 0.3%–3%. In order to test the tolerable degrees of our system, we designed an experiment to measure the accuracy
for different numbers of clients in particular. Figure 18
indicated the performance of face identifier with different
numbers of clients. The detection rate would achieve 100% for the number of clients lower than 10, and decrease when the number of clients exceeded 10. The detection rate would be reduced to 86% until the number of clients achieved 63. It
0 10 20 30 40 50 60 70 80 90 100
De
te
ct
io
n
ra
te
86%
0 10 20 30 40 50 60
Client number
Figure18: The performance of face identifier with respect to the number of clients.
could be acceptable if the detection rate of face identifier was still higher than 80%. In such cases, our system would still be in a tolerable range, and our proposed approach could accept more than 63 clients. For measuring the performances of the adaptive updating process, we used in the ORL database five images of each person for the training data, three for testing, and two for updating. We used the cross validation to estimate the performances of adaptive updating. The
upper-and lower- lines inFigure 19illustrated the detection rates
Table3: The comparison of detection rates of the proposed method and others.
Eigenfaces PCA+CN SOM+CN PCA+APM
without With
Training images for each person
3 81.8 86.8 88.2 86.8 89.3
4 84.6 87.9 92.9 92.5 92.9
5 89.5 92.5 96.2 95.0 98.0
30 40 50 60 70 80 90 100 110 120
Det
ection
rat
e
1 2
After updating Before updating
3 4 5 6 7 8 9 10
Cross-valiation
Figure19: The performance of adaptive updating.
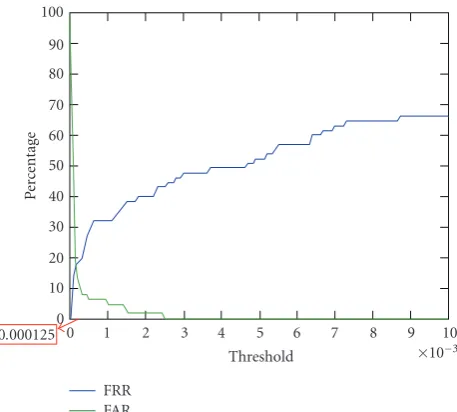
Table4: The summarized threshold for distinguishing the clients and impostors.
Threshold FRR FAR
0 4.5 89.9
0.000125 18.5 18.5
0.001 32.8 5.1
0.002 40.5 1.3
0.003 48.9 0
0.004 50.7 0
We had the total of 26 persons to find the threshold for telling clients from imposters in the proposed system. For 13 out of all clients, five images for each would be used in the training data and the remained were taken for the testing data. We additionally selected five images from the remained
13 impostors to be the testing images.Figure 20 presented
the results of selected thresholds for telling the clients from impostors and the tested results would be summarized in Table 4for some threshold values. The values of thresholds
indicated the similarity measures of APM. InFigure 20, FRR/
FAR represented the false reject/accept rate. We made use of the intersection of FAR and FRR to determine the similarity threshold. Based on the experimental result, the value of
0 10 20 30 40 50 60 70 80 90 100
Pe
rc
en
ta
ge
0.000125 0 1 2 3 4 5 6 7 8 9 10
×10−3
Threshold FRR
FAR
Figure20: The threshold distinguishing the clients and impostors.
threshold for telling the clients from impostors could be set to be 0.000125.
4.2.2. Online Testing. The experimental results in the online testing were obtained by using the system with the Intel P4 2.60 GHz CPU and 1 GB RAM. The development tool was Borland C++ Builder 6.0 on Window XP OS. The
input images were captured from cameras in the 320×240
resolution.Figure 21showed some examples of clients in our
database. The process to identify a new coming face as a client or an impostor started with capturing an image and extracting the face detector to localize the face regions. The face identifier module then would recognize the faces as the registered clients or impostors. Some results were shown in Figure 22. The registering process for new clients required
the images with five different head orientations including the
Figure21: Examples of clients in the database.
1. Linda 1. Whei
2. Whei Impostor
ImpostorImpostoImr postor
Figure22: The testing results generated from the proposed face identifier.
(a)
(b)
(c)
(a) (b)
Figure24: Examples of detection failures in (a) false detection, and (b) missed face regions.
(a) (b)
Figure25: The example of false acceptance for (a) an impostor and (b) a client.
fourth to a half of the total runtime in a complete process of multiclient detection and identification.
5. Discussions and Conclusions
The integration of face detection and face identification for real-time face recognition application has been proposed in this paper. The design of this system focuses on robustness and practicability. We demonstrate our proposed approach to accurately detect the face regions in an image. Besides, the system provides an identification mechanism to identify whom the extracted face of clients belongs to in the database, and a judgment way to regard the detected client as an impostor or a new client. In the face detection, the lighting normalization can actually improve the detection rate and a region-based clustering method is able to deal with the problems of multiple candidates around our target face. However, some nonface images with face-like shapes as
shown inFigure 24(a), or partially occluded faces in an image
as shown inFigure 24(b)may result in the detection errors.
For some special case as shown inFigure 25where the two
clients are too similar to be distinguished from, the false acceptance may occur inevitably. For face identification, an adaptive probabilistic model (APM) is introduced to model the characteristics of clients. According to the design of APM, the system can register a new client and update the
information of clients online. By the process of adaptive
updating, the weights for different poses and the matched
probabilistic functions are adjusted to satisfy the latest information of registered clients. The experimental finally results show that the proposed APM-based technique indeed has a good performance for both the face detection and identification in most cases. And we will consider more exceptional cases which may not be processed by our proposed system in the near future.
Acknowledgments
This work was supported in part by the Aiming for the Top University Plan of National Chiao Tung University, the Ministry of Education, Taiwan, under Contract 99W962, and supported in part by the National Science Council, Taiwan, under Contracts NSC 99-3114-E-009-167 and NSC 98-2221-E-009-167.
References
[1] A. K. Jain, R. Bolle, and S. Pankanti,Biometrics: Personal Iden-tification in Networked Society, Kluwer Academic Publishers, Dordrecht, The Netherlands, 1999.
[3] C. P. Papageorgiou, M. Oren, and T. Poggio, “A general framework for object detection,” inProceedings of the 6th IEEE International Conference on Computer Vision, pp. 555–562, January 1998.
[4] S. Z. Li, Q. Zhang, H. Shum, and H. J. Zhang, “FloatBoost learning for classification,” inProceedings of the Neural Infor-mation Processing Systems, December 2002.
[5] R. Lienhart and J. Maydt, “An extended set of Haar-like features for rapid object detection,” in Proceedings of the International Conference on Image Processing (ICIP ’02), vol. 1, pp. 900–903, September 2002.
[6] P. Viola and M. J. Jones, “Robust real-time face detection,”
International Journal of Computer Vision, vol. 57, no. 2, pp. 137–154, 2004.
[7] Y. Freund and R. E. Schapire, “A decision-theoretic general-ization of on-line learning and an application to boosting,” in
Proceedings of the 2nd European Conference on Computational Learning Theory (EuroCOLT ’95), pp. 23–57, Springer, 1995. [8] P. N. Belhumeur, J. P. Hespanha, and D. J. Kriegman,
“Eigenfaces vs. fisherfaces: recognition using class specific linear projection,”IEEE Transactions on Pattern Analysis and Machine Intelligence, vol. 19, no. 7, pp. 711–720, 1997. [9] T. F. Cooles, G. J. Edwards, and C. J. Taylor, “Active appearance
models,”IEEE Transactions on Pattern Analysis and Machine Intelligence, vol. 23, no. 6, pp. 681–685, 2001.
[10] L. Wiskott, J.-M. Fellous, N. Kr¨uger, and C. D. Von Malsburg, “Face recognition by elastic bunch graph matching,” IEEE Transactions on Pattern Analysis and Machine Intelligence, vol. 19, no. 7, pp. 775–779, 1997.
[11] K. W. Bowyer, K. Chang, and P. Flynn, “A survey of approaches and challenges in 3D and multi-modal 3D + 2D face recognition,”Computer Vision and Image Understanding, vol. 101, no. 1, pp. 1–15, 2006.
[12] W. Zhao, R. Chellappa, P. J. Phillips, and A. Rosenfeld, “Face recognition: a literature survey,”ACM Computing Surveys, vol. 35, no. 4, pp. 399–458, 2003.
[13] S. Du and R. Ward, “Face recognition under pose variations,”
Journal of the Franklin Institute, vol. 343, no. 6, pp. 596–613, 2006.
[14] D. J. Beymer, “Face recognition under varying pose,” Tech. Rep. 1461, MIT AI Lab, Massachusetts Institute of Technology, Cambridge, Mass, USA, 1993.
[15] M. Kirby and L. Sirovich, “Application of the Karhunen-Loeve procedure for the characterization of human faces,” IEEE Transactions on Pattern Analysis and Machine Intelligence, vol. 12, no. 1, pp. 103–108, 1990.
[16] L. Sirovich and M. Kirby, “Low-dimensional procedure for the characterization of human faces,”Journal of the Optical Society of America A, vol. 4, no. 3, pp. 519–524, 1987.
[17] M. Turk and A. Pentland, “Eigenfaces for recognition,”Journal of Cognitive Neuroscience, vol. 3, no. 1, pp. 71–86, 1991. [18] A. Sehad, H. Hocini, A. Hadid, M. Djeddi, and S. Ameur, “Face
recognition under varying views,” inProceedings of the 1st IEEE International Workshop on Biologically Motivated Computer Vision, pp. 258–267, May 2000.
[19] R. Ebrahimpour, E. Kabir, and M. R. Yousefi, “Teacher-directed learning in view-independent face recognition with mixture of experts using single-view eigenspaces,”Journal of the Franklin Institute, vol. 345, no. 2, pp. 87–101, 2008. [20] S. Lawrence, C. L. Giles, A. C. Tsoi, and A. D. Back, “Face