Volume 2009, Article ID 735283,8pages doi:10.1155/2009/735283
Research Article
Detecting Network Intrusions Using Signal Processing with
Query-Based Sampling Filter
Liang-Bin Lai, Ray-I Chang, and Jen-Shiang Kouh
Department of Engineering Science and Ocean Engineering, National Taiwan University, Taipei 10617, Taiwan
Correspondence should be addressed to Ray-I Chang,[email protected]
Received 2 September 2007; Accepted 16 September 2008
Recommended by Polly Huang
This paper presents a novel approach for training a network intrusion detection system based on a query-based sampling (QBS) filter. The proposed QBS filter applies the concepts of data quantization to signal processing in order to develop a novel classification system. Through interaction with a partially trained classifier, the QBS filter can use an oracle to produce high-quality training data. We tested the method with a benchmark intrusion dataset to verify its performance and effectiveness. Results show that selecting qualified training data will have an impact not only on the performance but also on overall execution (to reduce distortion). This method can significantly increase the accuracy of the detection rate for suspicious activity and can recognize rare attacks. Additionally, the method can improve the efficiency of real-time intrusion detection models.
Copyright © 2009 Liang-Bin Lai et al. This is an open access article distributed under the Creative Commons Attribution License, which permits unrestricted use, distribution, and reproduction in any medium, provided the original work is properly cited.
1. Introduction
The Internet has become an important resource for infor-mation access and a battlefield for business competition. A critical issue arising from the rapid advance of the Internet is information and communication security. Users, particularly high volume users, are exposed to a wide range of security threats through software or design vulnerabilities. Network attacks can cause serious performance problems throughout the network. These include common network attacks such as denial of service (DoS), which either jam a network pathway or exhaust available computer resources, thus disrupting related network services.
In order to respond to this increasing threat, information security technology provides a range of tools known as intrusion detection systems (IDSs), and in its latest devel-opment, IDS attempts to stop these attacks by scanning network traffic for signatures, for policy anomalies, such as variations in traffic or network protocol that can signal impending illegal activity, and also for signs of unwarranted activity that could point to attacks from inside or outside the network.Figure 1illustrates the intrusion detection system and external/internal network intrusion attacks.
The main goal of an intrusion detection system is to accurately detect anomalous network behavior or misuse of
resources, to differentiate true attacks from false alarms, and subsequently to notify network administrators of the activity. The intrusion detector learning task is to build a predictive model (i.e., a classifier) capable of distinguishing between malicious intrusions and normal connections. In typical applications of machine learning algorithms (e.g., artificial neural networks) to intrusion detection, detection models are produced offline because the learning of algorithms involves processing tremendous amounts of archived audit data. These models can naturally be applied to offline intru-sion detection (to analyze audit data offline after intrusions have run their course). Effective intrusion detection should happen in real time, as intrusions take place, to minimize compromises of security. Therefore, their success usually depends on the quality of the training data. If the data contain extraneous and irrelevant information, machine-learning algorithms may produce less accurate and less understandable results. To address this shortcoming, we classify extraneous and irrelevant data as noisy data and utilize the concepts of signal processing techniques to filter them out.
Engineering
Corporate network
Administrator
Marketing Internal firewall
Web server Alert!
IDS sensor Email server
IDS sensor Router
External firewall
Corporate network
R&D Finance Alert!
Internet
Figure1: The intrusion detection system and external/internal network intrusion attacks.
samples for better training. In this study, we explore the con-cepts of data quantization for signal processing to develop a novel classification system. Through interaction with a partially trained classifier, the QBS filter can use an oracle to produce high quality training data and then construct backpropagation neural networks to predict attacks. By using QBS for attack detection, the prediction model develops the generalization capability from training data. The approach is evaluated against the KDD Cup 1999 intrusion detection evaluation data [3].
In addition to the introduction, there are four other sections to this paper. Section 2 reviews related literature and establishes the foundation of current knowledge. Topics related to intrusion detection and neural networks are introduced. Section 3 introduces a query-based method that combines neural networks into one composite back-propagation neural network. Section 4 discusses how to increase the accuracy detection rate and how to improve the efficiency of the intrusion detection models. We compare the prediction performance of the developed QBS and conventional stratified sampling. Section 5 summarizes all findings in this study with suggestions for future study.
2. Related Works
An intrusion is a set of actions that threaten the integrity, availability, or confidentiality of a network resource. Intru-sion detection generally refers to the process of monitoring and analyzing the events occurring in a computer and/or network system in order to detect signs of security problems. Consequently, intrusion detection systems consist of soft-ware that monitors, detects, identifies, assesses, and responds to unauthorized or abnormal activities on a target system. The major functions performed by intrusion detection systems are as follows: (1) monitoring and analyzing user and system activities, (2) assessing the integrity of critical
system and data files, (3) recognizing activity patterns reflecting known attacks, (4) responding automatically to detected activities, and (5) reporting the outcome of the detection process [4]. Intrusion detection techniques can be categorized into misuse detection and anomaly detection. Misuse detection uses patterns of well-known attacks or vulnerabilities to identify intrusions. For example, three con-secutive login failures may be stored and used as the signature of a password-guessing attack. However, only known attacks that leave characteristic traces can be detected this way. Anomaly detection to identify intrusions, attempts to deter-mine whether deviations from normal usage patterns are attacks. Any significant deviations from expected behavior are reported as possible attacks. Although misuse detection can achieve a low false-positive rate, minor variations of a known attack are not always detected [5]. Anomaly detection can detect novel attacks, yet it suffers a higher false-positive rate.
A wide variety of techniques have been proposed for anomaly detection. Further analyze different kinds of data streams, such as data mining for network traffic [6], sequence analysis for operating system calls [7], information retrieval for audit trails [8], and inductive learning for sequential patterns [9]. Statistical methods have been developed for network anomaly detection [10,11] and have been analyzed for audit records [12]. Signal processing techniques have been successfully applied to analyze network traffic logs and to filter out noise instances for network intrusion detection. In [13], a signal processing technique was shown to provide a useful detection criterion by an adaptation of mutual information when no other signature of the attack was available. Reference [14] has proposed a statistical signal processing technique based on abrupt change detection to solve the problem of anomaly detection.
[15–17]. The goal in using ANNs for intrusion detection is to be able to generalize from incomplete data and to be able to classify online data as being normal or intrusive. An ANN consists of a collection of processing elements that are highly interconnected. Given a set of inputs and a set of desired outputs, the transformation from input to output is determined by the weights associated with the interconnections among processing elements. By modifying these interconnections, the network is able to adapt to desired outputs. The ability of high tolerance for learning-by-example makes neural networks flexible and powerful in IDS. In [18], a statistical neural network classifier for anomaly detection is developed. It can identify UDP flood attacks. Comparing different neural network classifiers, the backpropagation neural network has been shown to be more efficient in developing IDS. However, a long time is required to induce models from large datasets.
Pulse code modulation (PCM) is a digital technique that involves sampling an analog signal at regular intervals and coding the measured amplitude into a series of binary values, which are transmitted by modulation of a pulsed, or intermittent, carrier. It essentially consists of three stages, namely, sampling of the analog signal, quantization, and binary encoding. During sampling, the continuously varying amplitude of the analog signal is approximated by digital values; this introduces a quantization error, the difference between the actual amplitude and the digital approximation. A quantization error is apparent when the signal is reconverted to analog form as distortion, a loss in audio quality, and it can be reduced by increasing the sample size; as allowing more bits per sample will improve the accuracy of the approximation. The approximation introduced by quantization manifests itself as a noise. Often, for the analysis of sound-processing circuits, such noise is assumed to be white and decorrelated with the signal, but in reality it is perceptually tied to the signal itself, to such an extent that quantization can be perceived as an effect. Gold and Ur [18] reported an efficient error feedback scheme for compensating the amplification of the noise generated in the comb part of complex frequency sampling FIR filters [19]. In this study, we apply the concept of signal processing to develop a training samples filter for neural networks.
3. Method
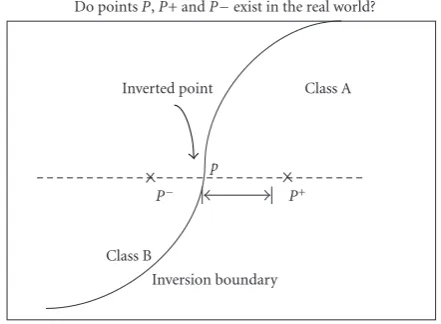
A learning machine consists of a learning protocol to specify manner of achieving accumulation of information, and a deduction procedure to learn the correct concept [17]. For a learning protocol, the input information can be examples that exemplify the concept to be learned, or oracles that, when presented with data, tell whether or not the data exemplify the concept. Therefore, we can apply not only the samples present at hand, but also extra samples produced by the oracle to train a system. When the point of query is set as y, the oracle would respond with a(y). The pair (y,a(y)) is called the queried sample. The sample query [20] method is an incremental approach, which adaptively changes the sample size taken from each class. Particularly
Inverted point Class A
Class B
P− p
P+
Inversion boundary
Do pointsP,P+ andP−exist in the real world?
Figure2: Conjugate data pairs.
in machine learning (i.e., ANNs) applications, the source of the training data can be modeled as an oracle. An oracle has the ability, when presented with an example, to give a correct classification [21]. The explanation capability of ANNs not only serves for justification but also can be useful in data theory induction, such as adding data to cover weakly represented areas by using active learning techniques, such as query-based learning [22].
In the classical problem of learning pattern classification, training samples are drawn randomly from the pattern classes according to a priori probabilities. Suppose that the learner has the freedom to query training samples according to some arbitrary rule instead of randomly drawing them, as above. According to [21,23,24], training samples from the decision boundary produce the best training results. We want to decide the points y to let a(y) = 0.5. Notably, conventional approaches have assumed that, for each input or output point, the oracle knows its input-output pattern. Random selection of a boundary pointP; then conjugation of its data pair (pointsP+ and P−) can then be extracted
along the reverse boundary (Figure 2). Here, samples with P,P+, andP−are arbitrary input-output patterns. However,
without experts or simulators, or the oracle for specifying the correct output, this may be very expensive. To resolve this drawback, we divide the training samples into one training set and one query set. Then, an oracle is designed to follow the self-regulation rule [23] to select samples (environment-focus) that are close to the conjugate data pair (self-(environment-focus). It provides the system with the ability to interact with the environment to train the system by queried samples. As [25] has reported, the system uses some particular samples in the dataset to learn almost completely what the full dataset is taught.
Datasets
y
Queried samples
Input Partial samples
Training algorithm
Oracle Learner
Quantization
Sampling filter Neural network
Output
Sub-datasets
{y,a(y)} {x,a(x)}
w wnew
Figure3: The framework of a QBS filter.
nontrained samples to detect whether they are put in the right class. As the output also indicates the probability of making a correct prediction to the samples, we can easily store these correct samples in a priority queue (max-heap). Then, the stored points that are the most correct predictions are picked as the extra training samples.Figure 3shows the framework of a QBS filter.
A step-by-step description of the proposed algorithm is shown as follows. The learning process is finished when either the number of iterations is over the given thresholdN or the root of mean squared error obtained is under the given thresholdRMSE.
Step 1. Initialize all weights in the neural networks randomly. Give the iteration thresholdNand the error thresholdRMSE. Step 2. The dataset isS= {ai ∈Rn}wherenis the number
of selected attributes. Get the partial training samplesSS⊂S by stratified random sampling.
Step 3. Train the neural networks by SS. IF (the errorE< RMSE) or (the iteration number>N), thenEXIT.
Step 4. Analyze the nontrained samples (S−SS).
Step 5. Add some samples of the most correct prediction to SS.
The goal of learning intrusion detection is not to obtain an exact representation of the training data but rather to extract a “model” of attack function and how it can effectively avoid those caused by noise. The ability to generalize is very important in making good predictions about unseen attacks. As in the real world, a passive learner will simply learn the samples. However, an active learner will explore the unknown portion of the environment to learn extra information. The proposed method with an ability to generalize is highly suitable for learning network intrusion. Even though the data is largely redundant and noisy. The selection of concise subsets of training data can reduce the training time.
4. Results
In this paper, we used the dataset applied in the KDD Cup 1999 intrusion detection contest to evaluate the performance
Dos 391458 79.239%
Normal 97278 19.691%
Probe 4107 0.831%
U2R 52 0.011%
R2L 1126 0.228%
Figure4: Distribution for the DARPA training set.
of our approach. This dataset is a version of the DARPA intrusion detection evaluation dataset prepared and man-aged by MIT’s Lincoln Laboratory. Researchers set up an environment to acquire 9 weeks of raw TCP dump data for a local-area network (LAN) simulating a typical U.S. Air Force LAN. They operated the LAN as if it were a true Air Force environment but peppered it with multiple attacks. A standard set of data to be audited, which includes a wide variety of intrusions simulated in a military network environment, was provided. Its objective was to survey and evaluate research in intrusion detection. These intrusions fall into four main categories: denial of service (DoS), probe, remote to user (R2L), and user to root (U2R). In order to compare various sampling techniques, our experiment is conducted using Weka’s implementation, a popular machine learning environment [26].
In the KDD dataset, the training set contains 494021 samples, and the test set contains 311029 samples.Figure 4 shows the data distribution of the DARPA data attack category breakdown of the training set. Nearly 80% of the samples are DoS attacks. Samples of normal connection are about 20%. Other types of attack samples, including U2R (0.011%), R2L (0.228%), and Probe (0.831%), are quite rare. It is important to note that the test data are not from the same probability distribution as the training data. The test data includes 17 specific attack types that are not in the training set. This makes the dataset more realistic.Figure 5shows the data distribution of every attack type breakdown of the test set.
mscan. 0.339%
xsnoop. 0.001% ftp_write. 0.001%
loadmodule. 0.001% perl. 0.001%
phf. 0.001% sqlattack. 0.001%
udpstorm. 0.001% xlock. 0.003% land. 0.003% teardrop. 0.004% xterm. 0.004%
worm. 0.001% imap. 0.000% spy. 0.000%
warezclient. 0.000% snmpguess. 0.774%
others 3.613%
saint. 0.237% portsweep. 0.114%
ipsweep. 0.098% httptunnel. 0.051%
pod. 0.028%
named. 0.005%
nmap. 0.027%
buffer_overflow. 0.007%
multihop. 0.006%
sendmail. 0.005%
rootkit. 0.004% apache2. 0.255%
processtable. 0.244%
ps. 0.005% normal.
19.481%
neptune. 18.648%
smurf. 52.757%
snmpgetattack. 2.489%
mailbomb. 1.608%
back. 0.353% guess_passwd.
1.404%
warezmaster. 0.515%
satan. 0.525%
Figure5: The data distribution of every attack type breakdown in the test set.
Table1: Summary of results.
Training dataset Test dataset
QBS StRS QBS StRS
Accuracy rate ∗98.98% 98.57% ∗91.55% 91.40%
Correctly classified instances 488 964 486 941 284 735 284 286
Incorrectly classified instances 5057 7080 26 294 26 743
Kappa statistic ∗0.9695 0.958 ∗0.797 0.793
Mean absolute error ∗0.0062 0.007 ∗0.036 0.042
Root mean squared error ∗0.0595 0.071 ∗0.178 0.186
Table2: The confusion matrix of the training dataset.
Predicted Actual Normal Probe DoS R2L U2R
QBS StRS QBS StRS QBS StRS QBS StRS QBS StRS
Normal 93339 94000 87 683 398 96 2308 1801 846 698
Probe 42 36 4001 4056 18 1 15 9 31 5
DoS 284 2505 167 1148 390483 387763 262 34 262 8
R2L 9 15 0 0 1 0 1093 1073 23 38
U2R 0 0 0 0 0 0 4 3 48 49
Table3: Detailed accuracy by class of the training dataset.
Class TP rate FP rate Precision Recall F-measure ROC area
QBS StRS QBS StRS QBS StRS QBS StRS QBS StRS QBS StRS
Table4: The confusion matrix of the test dataset.
Predicted Actual Normal Probe DoS R2L U2R
QBS StRS QBS StRS QBS StRS QBS StRS QBS StRS
Normal 58464 58903 992 518 256 693 546 203 335 276
Probe 471 546 3283 3284 14 84 182 171 216 81
DoS 5964 7571 30 122 222725 221899 2047 1791 689 72
R2L 13377 14219 6 0 2 0 172 140 1030 228
U2R 33 55 0 14 0 0 104 99 91 60
Table5: Detailed accuracy by class of the test dataset.
TP rate FP rate Precision Recall F-measure ROC area
QBS StRS QBS StRS QBS StRS QBS StRS QBS StRS QBS StRS
Normal 0.965 0.972 0.079 0.089 0.747 0.725 0.965 0.972 0.842 0.830 0.973 0.978 Probe 0.788 0.788 0.003 0.002 0.762 0.834 0.788 0.788 0.775 0.810 0.916 0.968 DoS 0.962 0.959 0.003 0.010 0.999 0.997 0.962 0.959 0.980 0.977 0.969 0.982 R2L 0.012 0.010 0.010 0.008 0.056 0.058 0.012 0.010 0.020 0.016 0.293 0.372 U2R 0.399 0.263 0.007 0.002 0.039 0.084 0.399 0.263 0.070 0.127 0.623 0.957
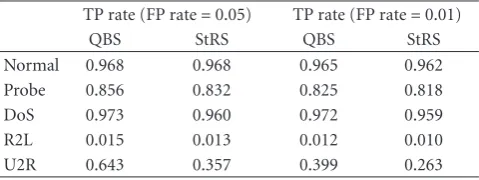
Table6: Keeping FP rate constant to demonstrate QBS outperforms StRS.
TP rate (FP rate=0.05) TP rate (FP rate=0.01)
QBS StRS QBS StRS
Normal 0.968 0.968 0.965 0.962 Probe 0.856 0.832 0.825 0.818 DoS 0.973 0.960 0.972 0.959 R2L 0.015 0.013 0.012 0.010 U2R 0.643 0.357 0.399 0.263
in a real-world system, the effect of incorrectly detecting abnormal network behavior (false negative) is different from that of incorrectly predicting normal classification outcome (false positive). These two kinds of errors will generally have different costs; likewise, the two types of correct classification will have different benefits.
The major objectives performed by detecting network intrusion are as follows: (1) recognizing rare attack types such as U2R and R2L, (2) increasing the accuracy detection rate for suspicious activity, and (3) improving the efficiency of real-time intrusion detection models.
Extracting a model of attack from a large dataset of daily security logs is computationally inefficient. Using a sample from the original data can speed up the modeling process, but this is only acceptable if it does not reduce the quality of the information. Nevertheless, using a simple random sample may not obtain satisfactory results because such a sample may not adequately represent the large and noisy dataset due to its blind approach in selecting samples. However, we can divide a stratified sample by sampling frames into nonoverlapping groups. That is, a sample is taken from each stratum, and when this sample is a simple random sample, it is referred to as stratified random sampling. It ensures better coverage of the population than simple random sampling.
In this paper, we apply the concepts of quantization of signal processing techniques to develop a QBS filter and explore backpropagation neural networks to predict attacks. The prediction model of using QBS for neural networks is to develop a generalization capability from training data. In order to assess the predictive ability of the different models, we compared stratified random sampling (StRS) for neural networks, and we chose 500 instances as training samples from the KDD training dataset. In the first place, we examined the predicted accuracy of both estimated models by calculating the accuracy rate, Kappa statistic, mean absolute error (MAE), and root of mean squared error (RMSE).Table 1summarizes the average classification accuracy achieved by these algorithms using 10-fold cross-validation as well as the best parameters for each algorithm. The QBS achieves a significantly better accuracy rate than the StRS approach in the training and test dataset, respectively. Moreover, as a result, the QBS is still considered to be a good fit due to the very low MAE and RMSE values.
A confusion matrix for a training dataset describes the pattern of mistakes made by the classifier (Table 2). The top-left element of the confusion matrix shows that 93339 of the QBS actual “normal” test examples were predicted to be normal. In Table 3, the precision column indicates that in total 99.6% of the actual “normal” examples were recognized correctly. The recall column shows that 96.0% of the test examples said to be “normal” were indeed “normal” in reality. Clearly, both QBS and StRS approaches produce predictive capabilities that are very close to the actual values. Note, however, that the StRS seems to perform poorly when it comes to the test cases.
column shows that 96.2% of the test examples said to be “DoS” were indeed “DoS.” Thus, QBS correctly recognized 284735 out of 311029 test examples (91.55%), and StRS correctly recognized 284286 out of 311029 test examples (91.40%). A comparison of the true-positives (TP) rate is the ratio of low weight cases predicted correctly to the total of positive cases [26] between the two models; the QBS is slightly better than the StRS. However, in this dataset, U2R and R2L are rare classes so they are major indicators to see whether and how much the QBS method and the StRS method help classifiers reduce the number of false positives and false negatives in these classes. An analysis of rare classes shows that the majoritybelongs to the infrequent attack types that were not in the training data. QBS achieves significantly higher correct “hits” than StRS in recognizing the U2R and R2L, respectively. InTable 6, we try to keep FP rate constant to demonstrate that QBS outperforms StRS. Experiments show that, under the same FP rate, QBS is better than StRS in TP rate for all test classes.
5. Conclusion
In this paper, we proposed that a QBS filter can apply the concepts of data quantization to signal processing to develop a novel classification system. Through interaction with a partially trained classifier, the QBS filter can efficiently use an oracle to produce high quality training data. We test the proposed method through a benchmark intrusion dataset to verify its performance and effectiveness. Results show that selecting qualified training data will have an impact on not only the performance but also the overall execution efficiency (to reduce the distortion). The proposed method can significantly increase the accuracy detection rate for suspicious activity and recognize rare attack types. Additionally, it can improve the efficiency of real-time intrusion detection models. Experiments show that the proposed method could gain effective classification. It is flexible and powerful. Intrusion detection systems must be capable of distinguishing between normal (not security critical) and abnormal user activities, to discover malicious attempts in time. However, translating user behavior (or a complete user-system session) in a consistent security-related decision is often not that simple—many behavior patterns are indistinguishable and unclear. If uncertain behavior is not considered anomalous, intrusion activity may not be detected. If uncertain behavior is considered anomalous, system administrators may be alerted by false alarms. Our future work is to extend this concept to develop more learning methods for more real-world applications.
References
[1] L.-B. Lai, R.-I. Chang, and J.-S. Kouh, “Mining data by query-based error-propagation,” in Proceedings of the 1st International Conference on Natural Computation (ICNC ’05), vol. 3610 ofLecture Notes in Computer Science, pp. 1224–1233, Changsha, China, August 2005.
[2] R.-I. Chang, L.-B. Lai, W. D. Su, J. C. Wang, and J.-S. Kouh, “Intrusion detection by backpropagation neural networks
with sample-query and attribute-query,”International Journal of Computational Intelligence Research, vol. 3, no. 1, pp. 6–10, 2007.
[3] A. Asuncion and D. J. Newman, “UCI Machine Learn-ing Repository,” School of Information and Computer Sci-ence, University of California, Irvine, Calif, USA, 2007,
http://archive.ics.uci.edu/ml.
[4] A. K. Ghosh, A. Schwartzbard, and M. Schatz, “Learning pro-gram behavior profiles for intrusion detection,” inProceedings of the 1st Conference on Workshop on Intrusion Detection and Network Monitoring (ID ’99), vol. 1, p. 6, Santa Clara, Calif, USA, 1999.
[5] W. Lee and S. Stolfo, “A framework for constructing features and models for intrusion detection systems,”ACM Transac-tions on Information and System Security, vol. 3, no. 4, pp. 227– 261, 2000.
[6] S. Forrest, S. A. Hofmeyr, A. Somayaji, and T. A. Longstaff, “A sense of self for Unix processes,” inProceedings of IEEE Symposium on Security and Privacy (SECPRI ’96), pp. 120–128, Oakland, Calif, USA, May 1996.
[7] R. Anderson and A. Khattak, “The use of information retrieval techniques for intrusion detection,” inProceedings of the 1st International Workshop on the Recent Advances in Intrusion Detection (RAID ’98), Louvain-la-Neuve, Belgium, September 1998.
[8] H. S. Teng, K. Chen, and S. C. Lu, “Adaptive real-time anomaly detection using inductively generated sequential patterns,” in
Proceedings of IEEE Computer Society Symposium on Security and Privacy (RISP ’90), pp. 278–284, Oakland, Calif, USA, May 1990.
[9] T. Lunt, A. Tamaru, F. Gilham, et al., “A real-time intrusion detection expert system (IDES),” Tech. Rep., Computer Sci-ence Laboratory, SRI International, Menlo Park, Calif, USA, 1992.
[10] S. Staniford, J. A. Hoagland, and J. M. McAlerney, “Practical automated detection of stealthy portscans,”Journal of Com-puter Security, vol. 10, no. 1-2, pp. 105–136, 2002.
[11] H. S. Javitz and A. Valdes, “The SRI IDES statistical anomaly detector,” inProceedings of IEEE Computer Society Symposium on Research in Security and Privacy (RISP ’91), pp. 316–326, Oakland, Calif, USA, May 1991.
[12] M. Thottan and C. Ji, “Anomaly detection in IP networks,”
IEEE Transactions on Signal Processing, vol. 51, no. 8, pp. 2191– 2204, 2003.
[13] K. Shah, E. Jonckheere, and S. Bohacek, “Dynamic modeling of internet traffic for intrusion detection,”EURASIP Journal on Advances in Signal Processing, vol. 2007, Article ID 90312, 14 pages, 2007.
[14] M. Thottan and C. Ji, “Anomaly detection in IP networks,”
IEEE Transactions on Signal Processing, vol. 51, no. 8, pp. 2191– 2204, 2003.
[15] J. Cannady, “Artificial neural networks for misuse detection,” in Proceedings of the National Information Systems Security Conference (NISSC ’98), pp. 443–456, Arlington, Va, USA, October 1998.
[16] C. Zhang, J. Jiang, and M. Kamel, “Intrusion detection using hierarchical neural networks,”Pattern Recognition Letters, vol. 26, no. 6, pp. 779–791, 2005.
[18] D. Gold and H. Ur, “Quantization noise analysis and error feedback implementation in frequency sampling FIR filters,”
Signal Processing, vol. 30, no. 1, pp. 103–113, 1993.
[19] L. G. Valiant, “Theory of the learnable,”Communications of the ACM, vol. 27, no. 11, pp. 1134–1142, 1984.
[20] J. Ratsaby, “Incremental learning with sample queries,”IEEE Transactions on Pattern Analysis and Machine Intelligence, vol. 20, no. 8, pp. 883–888, 1998.
[21] J.-N. Hwang, J. J. Choi, S. Oh, and R. J. Marks II, “Query-based learning applied to partially trained multilayer perceptrons,”
IEEE Transactions on Neural Networks, vol. 2, no. 1, pp. 131– 136, 1991.
[22] E. W. Saad, J. J. Choi, J. L. Vian, and D. C. Wunsch, “Query-based learning for aerospace applications,”IEEE Transactions on Neural Networks, vol. 14, no. 6, pp. 1437–1448, 2003. [23] R.-I. Chang, “Disease diagnosis using query-based neural
networks,” inProceedings of the 2nd International Symposium on Neural Networks (ISNN ’05), vol. 3498 ofLecture Notes in Computer Science, pp. 767–773, Chongqing, China, May-June 2005.
[24] R.-I. Chang and P.-Y. Hsiao, “Unsupervised query-based learning of neural networks using selective-attention and self-regulation,”IEEE Transactions on Neural Networks, vol. 8, no. 2, pp. 205–217, 1997.
[25] T. Oates and D. Jensen, “The effects of training set size on decision tree complexity,” in Proceedings of the 14th International Conference on Machine Learning, pp. 254–262, Nashville, Tenn, USA, July 1997.