Benchmarking Twitter Sentiment Analysis Tools
Ahmed Abbasi, Ammar Hassan, Milan Dhar
University of VirginiaCharlottesville, Virginia, USA
E-mail: [email protected], [email protected], [email protected]
Abstract
Twitter has become one of the quintessential social media platforms for user-generated content. Researchers and industry practitioners are increasingly interested in Twitter sentiments. Consequently, an array of commercial and freely available Twitter sentiment analysis tools have emerged, though it remains unclear how well these tools really work. This study presents the findings of a detailed benchmark analysis of Twitter sentiment analysis tools, incorporating 20 tools applied to 5 different test beds. In addition to presenting detailed performance evaluation results, a thorough error analysis is used to highlight the most prevalent challenges facing Twitter sentiment analysis tools. The results have important implications for various stakeholder groups, including social media analytics researchers, NLP developers, and industry managers and practitioners using social media sentiments as input for decision-making.
Keywords: sentiment analysis, twitter, social media analytics, opinion mining, benchmarking
1.
Introduction
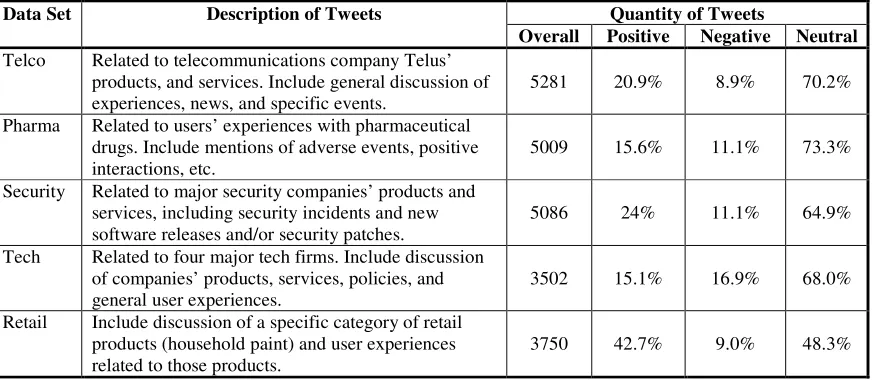
Twitter has emerged as one of the premier social media analytics channels. With over 3 billion tweets and 15 billion API calls generated daily (DuVander, 2012), Twitter has an abundance of both supply and demand. The demand is partially precipitated by the growing body of social media analytics applications involving Twitter. One huge area is Twitter sentiments, which are used for understanding consumer perceptions (Smith et al., 2012), predicting financial performance (Bollen et al., 2011), providing early warnings for adverse medical events (Abbasi et al., 2013; Fu et al., 2012), determining and understanding election outcomes (Skoric et al. 2011), and as input for disaster response surveillance systems (Goodchild & Glennon, 2010). In all of these examples, and many others like them, the key sentiment input is whether a given tweet has positive, negative, or neutral sentiment polarity regarding the target of interest (Abbasi et al., 2008a). These inputs are often aggregated to develop social media sentiment signals or indexes over time, with time series ranging from strong positive to strong negative. The quality of tweet sentiment polarity classifications is hence a critical intermediary step in the information value chain and a big part of emerging real-time analytics applications. Accordingly, numerous commercial and freely available tools have emerged for Twitter sentiment classification. One study estimated the number at over 50 tools, with new commercial start-ups and academic offerings arising on a monthly basis. What remains unclear is how effective the plethora of available tools really is. Extensive benchmarking is warranted for a couple of reasons:
• In order to provide potential users of Twitter sentiment analysis techniques with a “consumer report” of existing tools.
• In order to assess the state-of-the-art for Twitter sentiment analysis and examine possible avenues for improvement.
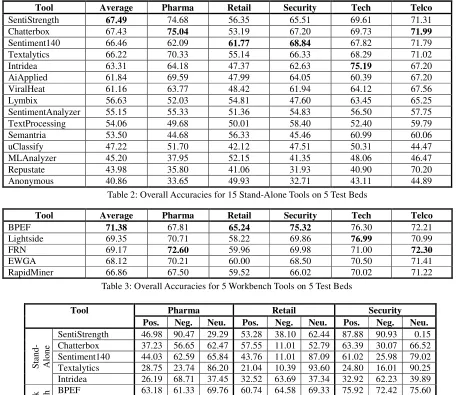
Accordingly, with these objectives in mind, we performed a large-scale benchmark study of Twitter sentiment analysis tools. We examined the sentiment polarity classification performance of 20 tools, including both commercial and freely available offerings, on 5 carefully crafted Twitter test beds annotated using Amazon Mechanical Turk. The results revealed that tool performances varied considerably, with the best-performing tools attaining overall accuracies of between 65% and 71% on average, while many low-performing tools yielded accuracies below 50%. Furthermore, tool results also varied across test beds, suggesting the presence of a domain interaction on tool performance. In order to further investigate tool performances, detailed error analysis was conducted on the most frequently misclassified tweets across the five test beds. We manually examined the most prevalent misclassifications and developed a two-level hierarchical error taxonomy. The taxonomy, and prevalence of certain error types within the taxonomy, were both used to make inferences about the strengths and weaknesses of the 20 tools examined. The results have important implications for several stakeholder groups, including social media analytics researchers, natural language processing (NLP) and text mining researchers and developers, and industry practitioners that utilize Twitter sentiment signals as input for decision-making.
10% of one another, with the exception of the Telco data set, where the positive recall rate was about 17% to 19% lower than the other two classes. Class-level recall rates in general, and balance in particular, both have important implications for social media analytics applications involving sentiment. For instance, Hassan et al. (2013)
showed that tools with lower positive and negative recall rates are susceptible to generating sentiment index time series that are “flatter” and less effective for representing events with extreme positive or negative sentiments. They illustrated this point with a sentiment time series for a major North American telecommunications provider.
Tool Average Pharma Retail Security Tech Telco
SentiStrength 67.49 74.68 56.35 65.51 69.61 71.31
Chatterbox 67.43 75.04 53.19 67.20 69.73 71.99
Sentiment140 66.46 62.09 61.77 68.84 67.82 71.79
Textalytics 66.22 70.33 55.14 66.33 68.29 71.02
Intridea 63.31 64.18 47.37 62.63 75.19 67.20
AiApplied 61.84 69.59 47.99 64.05 60.39 67.20
ViralHeat 61.16 63.77 48.42 61.94 64.12 67.56
Lymbix 56.63 52.03 54.81 47.60 63.45 65.25
SentimentAnalyzer 55.15 55.33 51.36 54.83 56.50 57.75
TextProcessing 54.06 49.68 50.01 58.40 52.40 59.79
Semantria 53.50 44.68 56.33 45.46 60.99 60.06
uClassify 47.22 51.70 42.12 47.51 50.31 44.47
MLAnalyzer 45.20 37.95 52.15 41.35 48.06 46.47
Repustate 43.98 35.80 41.06 31.93 40.90 70.20
Anonymous 40.86 33.65 49.93 32.71 43.11 44.89
Table 2: Overall Accuracies for 15 Stand-Alone Tools on 5 Test Beds
Tool Average Pharma Retail Security Tech Telco
BPEF 71.38 67.81 65.24 75.32 76.30 72.21
Lightside 69.35 70.71 58.22 69.86 76.99 70.99
FRN 69.17 72.60 59.96 69.98 71.00 72.30
EWGA 68.12 70.21 60.00 68.50 70.50 71.41
RapidMiner 66.86 67.50 59.52 66.02 70.02 71.22
Table 3: Overall Accuracies for 5 Workbench Tools on 5 Test Beds
Tool Pharma Retail Security
Pos. Neg. Neu. Pos. Neg. Neu. Pos. Neg. Neu.
S
ta
n
d
-A
lo
n
e
SentiStrength 46.98 90.47 29.29 53.28 38.10 62.44 87.88 90.93 0.15
Chatterbox 37.23 56.65 62.47 57.55 11.01 52.79 63.39 30.07 66.52
Sentiment140 44.03 62.59 65.84 43.76 11.01 87.09 61.02 25.98 79.02
Textalytics 28.75 23.74 86.20 21.04 10.39 93.60 24.80 16.01 90.25
Intridea 26.19 68.71 37.45 32.52 63.69 37.34 32.92 62.23 39.89
W
o
rk
b
en
ch
BPEF 63.18 61.33 69.76 60.74 64.58 69.33 75.92 72.42 75.60
Lightside 44.93 28.06 82.63 57.24 34.23 63.54 56.59 47.33 78.60
FRN 39.15 21.04 84.86 58.99 24.70 67.35 55.20 35.94 81.23
Table 4: Class-level Recalls for Select Stand-Alone and Workbench Tools on Pharma, Retail, and Security Test Beds
Tool Tech Telco
Pos. Neg. Neu. Pos. Neg. Neu.
S
ta
n
d
-A
lo
n
e
SentiStrength 62.00 45.27 61.89 59.67 80.56 42.47 Chatterbox 52.64 45.10 56.51 53.16 33.97 64.39 Sentiment140 55.09 36.82 78.36 46.38 28.42 84.84 Textalytics 26.98 18.04 90.00 25.07 29.06 90.02 Intridea 69.81 81.76 74.75 32.73 68.38 46.32
W
o
rk
b
e
n
ch
BPEF 69.25 78.55 77.31 57.01 74.52 76.47
Lightside 47.92 55.91 84.29 38.70 49.79 83.30 FRN 37.17 42.06 80.92 33.30 37.26 81.10
5.
Error Analysis
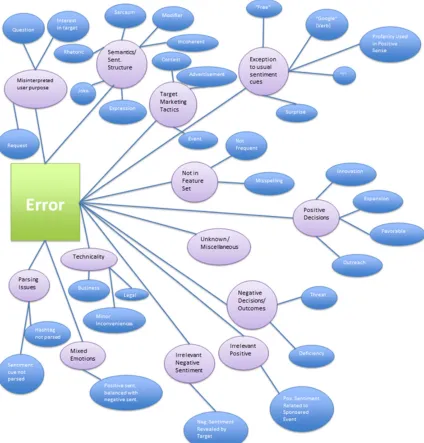
The performance variation between stand-alone tools’ accuracies (over 26% on average), and the generally low performance of tools (mostly below 70%), both underscore the challenges associated with effective Twitter sentiment classification. In order to better understand these challenges, detailed error analysis was performed on the 5 test beds. We examined the 1000 most misclassified tweets in each test bed. Following best practices outlined in prior studies (Wiebe et al. 2005), for each tweet, multiple annotators categorized the errors. More specifically, three annotators classified the erroneous tweets. After multiple rounds of discussion and annotation, the errors were grouped into a two-level hierarchical taxonomy (presented in Figure 1). The taxonomy contains 13 top-level categories.
The misinterpreted user purpose category includes neutral-sentiment questions or requests that are mistaken for complements or criticisms. The semantics/sentence structure category includes jokes, sarcasm, rhetoric, and related literary devices that have been well-documented as being problematic for sentiment analysis tools. Misinterpreted user-purpose includes requests or questions (e.g., “It would be great if we could…”). Parsing issues include sentiments expressed in the hash tags, which are often not properly parsed. The target marketing tactics category includes events, contests, and advertisements, which are generally considered neutral by human annotators. The exception to usual sentiment cues category includes errors attributable to the presence of terms that are used in a connotation that is atypical, such as the use of curse words to indicate a positive outcome.
Other common categories of errors included tweets containing mixed sentiments, where the authors incorporate both positive and negative sentiments about different topics within the 140 characters. Similarly, lack of relevance of the sentiment expressed to the targets was another cause of both positive and negative misclassifications. The positive decisions category of errors was interesting. These were tweets containing subtle positive sentiment cues such as mentions of donations, charities, and other events or activities with a somewhat implied positive connotation. The tools failing to identify such tweets were generally those that presumably lacked a lexicon of positive action terms and/or keywords.
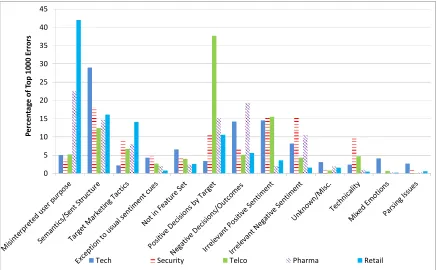
Using this taxonomy, we examined the error frequencies for the 20 tools by category, across the 5 test beds. The results are presented in Figure 2. It is apparent that certain types of errors were most prevalent. Not surprisingly, semantics/sentence structure issues (e.g., sarcasm, modifiers, jokes, rhetoric, etc.) accounted for the largest percentage of highly erroneous tweets for many test beds. This category consistently encompassed 10%-15% of total errors. However, several other categories were also quite pervasive. The positive decisions by target category accounted for over 10% of errors on four out of five data sets. The irrelevant positive and negative sentiment categories (with respect to the targets) were also responsible for between 5% and 15% of errors, each.
Interestingly, errors pertaining to mixed sentiments were very rare, despite constituting a major problem in other social media channels such as web forums and blogs. This finding suggests that the 140-character limit presents some limitations on users’ abilities to articulate complex opinions encompassing multiple opposing sentiments.
Furthermore, there was an interaction between error category and data set, with certain errors being common within select domains. In most situations, the top 2-3 error categories accounted for the majority of errors on that particular data set. For example, misinterpreted user purpose was a significant source of errors on the Pharma and Retail data sets (over 20% and 40%, respectively), where questions about experiences with prescription drugs or quality of paints were misclassified as negative sentiments by several tools. Similarly, many tweets pertaining to charitable activities, fund-raising events, and donation drives in the Telco data set were misclassified by several tools, accounting for over 35% of errors. Even the semantics/sentence structure category, although pervasive across all five data sets, was more prevalent in the Tech and Security data sets. In these two domains, literary devices such as jokes, sarcasm, and rhetoric were far more prevalent (e.g., when referring to security software, smart phone manufacturers, or major technology firms). Overall the results shed light on how sentiment analysis tool errors are manifested across tweets pertaining to different topics.
0 5 10 15 20 25 30 35 40 45
P
e
rc
e
n
ta
g
e
o
f
To
p
1
0
0
0
E
rr
o
rs
Tech Security Telco Pharma Retail