DESIGNING HYDROLOGIC OBSERVATORIES: A PAPER
PROTOTYPE OF THE NEUSE WATERSHED
By
Neuse Prototype Hydrologic Observatory Design Team
A Report to the Consortium of Universities
for the Advancement of Hydrologic Sciences, Inc.
Designing Hydrologic Observatories: A Paper Prototype of the Neuse
Watershed
A Report to the Consortium of Universities
for the Advancement of Hydrologic Sciences, Inc.
by
Neuse Prototype Hydrologic Observatory Design Team
The research on which this report is based was supported by funds provided by the
Consortium of Universities for the Advancement of Hydrologic Sciences, Inc. (CUAHSI). Contents of the publication do not necessarily reflect the views and policies of the CUAHSI, nor does mention of trade names of commercial products constitute their endorsement by the WRRI or the State of North Carolina.
This report fulfills the requirements for a project completion report of the Water Resources Research Institute of The University of North Carolina. The authors are solely responsible for the content and completeness of the report.
WRRI Project 50333
Preface ... vii
Acknowledgments ... viii
1. Introduction ...1
1.1 Motivation for Hydrologic Observatories ...1
1.2 Science Vision ...2
1.3 Goals of this Document and of the Neuse Prototype Design ...4
1.4 References ...7
2. Background and Approach ...8
2.1 Introduction ...8
2.2 Understanding fluxes and stores of water, sediment, and nutrients ...8
2.3 Spatially and temporally integrated measurements ... 10
2.4 Spatially stratified measurements for predictive understanding at the river-basin scale ... 10
2.5 Framework for organization of hydrologic measurements ... 15
2.6 References ... 16
3. Watershed Characteristics ... 18
3.1. Topography ... 18
3.2. Land Use, Land Cover (LULC), LULC change (LULCC) ... 19
3.3. Soils ... 20
3.4. Nested watershed sampling design ... 21
3.5 References ... 23
4. River/Stream Discharge and Overland Flow ... 25
4.1. River/Stream Discharge ... 25
4.1.1. Key Science Questions ... 25
4.2. Overland Flow ... 30
4.2.1. Key Science Questions ... 30
4.2.2. Observing Strategy ... 31
5. Precipitation ... 33
5.1. Key Science Questions ... 33
5.2. Observing Strategy ... 34
5.2.1 Current Rainfall Observations. ... 34
5.2.2 Proposed Rainfall Observing System ... 34
5.3 References ... 38
6. Energy Budgets, Evapotranspiration, and Land Surface-Atmosphere Exchange ... 40
6.1 Land-Atmosphere Exchange ... 40
6.1.1 Key Science Questions ... 40
6.1.2 Observing Strategy... 41
6.2 Soil Moisture and Land Surface Processes ... 43
6.2.1 Key Science Questions ... 43
6.2.2 Observing Strategy... 44
7. Groundwater ... 46
7.1 Key Science Questions ... 46
7.2 Observing Strategy ... 50
7.2.1 Objectives & Goals ... 50
7.2.2 The Subsurface Observing System ... 50
7.3 References ... 51
8. Groundwater Exchange ... 53
8.1 Key Science Questions ... 53
8.2.1 Geochemical Approach ... 54
8.2.2. Physical Approach ... 55
8.2.3 Modeling Approach ... 56
8.3 References ... 57
9. Water Quality ... 58
9.1 Nitrogen Sources: Key Science Questions ... 59
9.2 Nitrogen Stores: Key Science Questions ... 63
9.2.1 Rivers/Streams ... 63
9.2.2 Vadose Zone ... 63
9.2.3 Shallow Groundwater, Deep Groundwater ... 63
9.2.4 Estuary ... 64
9.3 Observing Strategy ... 64
9.3.1 River/Stream Input to the Estuary ... 64
9.3.2 Shallow Groundwater Input to the Estuary ... 64
9.3.3 Shallow Groundwater Input to Rivers/Streams ... 65
9.3.4 Intensive Field Campaigns ... 65
10. Sediment Transport and Geomorphology ... 68
10.1 Key Science Questions... 69
10.2 Observing Strategy ... 70
10.2.1 Lidar Surveys ... 71
10.2.2 Characterization of Channel Form at High Resolution: Bed Morphology, Bedforms, Bed, and Bank Materials ... 71
10.2.3 Real Time Suspended Sediment Sampling ... 71
10.2.4 Bed Load Transport Sampling ... 72
10.2.5 Hillslope and field scale observations of flow, erosion, and deposition ... 72
10.2.7 Specific Instrumentation Needs Unique to Geomorphological Studies ... 73
11. Social Sciences ... 74
11.1 Key Science Questions ... 74
11.2 Observing Strategy ... 76
11.2.1 Data Sources ... 76
11.2.2 Widely Available Data ... 76
11.2.3 Observatory Data ... 76
11.2.4 Survey Data ... 77
11.2.5 Using the Data: A Simple Example ... 78
12. Remote Sensing ... 80
12.1 Key Science Questions ... 81
12.2 Observing Strategy ... 82
13. Modeling ... 84
13.1 Key Science Questions ... 85
13.2 Modeling Strategy ... 86
13.3 References ... 86
14. Data Communications ... 88
15. Operation and Implementation of Hydrologic Observatories ... 90
15.1 Role of the ODT ... 90
15.1.1 Designing Core Data ... 90
15.1.2 Development of Annual Workplan ... 92
15.1.3 Review of Annual Workplan ... 92
15.2 Role of Observatory Professional Staff ... 93
15.3 Role of CUAHSI ... 94
15.5 Implementation of Hydrologic Observatories ... 95
15.5.1 Developing a Network of Hydrologic Observatories ... 95
15.5.2 Schedule for Implementation... 96
15.5.3 CUAHSI Management ... 97
APPENDIX A. CAPITAL EQUIPMENT BUDGET ESTIMATE ... 98
(The section numbers in this section correspond to chapter numbers in the report) ... 98
4. Stream Gauging and Overland Flow ... 98
5. Precipitation ... 99
6. Energy Budgets, Evapotranspiration, and Land-Atmosphere Exchange (single site) ... 100
7. Soil Moisture, Recharge, and Groundwater (single site) ... 102
8. Groundwater Exchange with the Neuse Estuary ... 103
9. Water Quality ... 104
10. Sediment Transport and Geomorphology ... 104
11. Social Sciences Survey Data ... 105
12. Remote Sensing ... 105
13. Modeling ... 105
14. Data Communications ... 105
Total Capital Equipment Cost Estimate ... 106
Preface
The fundamental objective of the Neuse paper prototyping exercise was to provide a proof-of-concept of the scientific and financial feasibility of a hydrologic observatory (HO) on a watershed of at least 10,000 km2. In other words, for a watershed of this scale, is it possible to carry out an observing strategy that would provide the basis for addressing critical science questions identified by the hydrologic sciences community, at a reasonable cost?
The Neuse Prototype Hydrologic Observatory Design Team (NDT) was established in early 2003; it was a national committee composed of senior scientists with expertise in the essential subject areas inherent in the science questions to be addressed by a successful HO. Discussions among Rick Hooper, Larry Band, Marshall Moss, and Ken Reckhow led to the selection and invitation of NDT members. Only a few members of the NDT were familiar with the Neuse Basin, but lack of local knowledge was deemed less important than national involvement and expertise.
The NDT consists of Christopher Duffy (Penn State), Jay Famiglietti (UC Irvine), David Genereux (North Carolina State), John Helly (UC San Diego), Witold Krajewski (Iowa), Diane McKnight (Colorado), Fred Ogden (Connecticut), Kenneth Reckhow (Duke), Bridget Scanlon (Texas), and Leonard Shabman (Resources for the Future).
As originally proposed, the design would focus on a particular “science driver” (e.g., land-surface/atmosphere interactions), and iteratively refine the monitoring design and estimate costs, to address that driver. Once each design and its associated costs were deemed satisfactory, the NDT would sequentially move through the science drivers, refining and augmenting the observation strategy. The final product would be a report on the Neuse HO design that also would include the NDT’s best judgment on the applicability of the design procedures in other hydrologic settings.
The NDT met four times (April, June, August, and November 2003). Prior to and during the first meeting, the NDT was familiarized with the Neuse basin and with previous and ongoing investigations in the hydrologic sciences in the Neuse. Aside from developing an understanding of the Neuse Basin, the purpose of the first meeting was to agree upon a set of general and Neuse-specific science questions that would serve to launch the design effort.
During and following the first meeting, the NDT proposed an extensive list of science questions, and as these were discussed the group realized that a common set of core data and basic catchment properties emerged as essential for virtually all questions. Accordingly, the design strategy evolved toward a focus on characterizing these properties (e.g., flux,
residence time) for water, sediment, nutrients, and other key contaminants.
The design that emerged and is presented in this report begins with a conceptual model. This is followed by a sequence of science questions or hypotheses; an explanation of the observing strategy follows each question/hypothesis, identifying equipment, sites, measurements, and estimating costs. In some cases (e.g., precipitation, stream gauging), the NDT has been able to address critical issues of scaling and explicit linkage of measurements to science questions. In other cases, this is less evident and must therefore be addressed during the initial years of operation of an HO. In either case, benchmarking of progress and the Hydrologic Observatory evaluation criteria necessitates a quantitative and scientifically defensible strategy connecting observations to basic properties of the catchment and to the science questions.
Acknowledgments
1. Introduction
1.1 Motivation for Hydrologic Observatories
Freshwater resources have become the strategic resource that constrains future development in many regions in the US and abroad and influences international relations around the world. As has been emphasized in numerous recent reports, our current predictive scientific understanding of the terrestrial water budget, which determines the availability of freshwater resources, is inadequate to support the management of this strategic resource in a changing world. Among the several critical changes needed to address critical regional/national water science and policy issues in the U.S. now and in the future, we must advance the conceptual framework and the research infrastructure for fundamental studies of the terrestrial water budget. “What is needed for understanding water resources is a more holistic conceptual framework that
encompasses regional scale hydrologic systems, land-atmosphere interactions, and the biogeochemical cycles that control contaminant transport” stated the NRC Water Science and Technology Board in Envisioning the Agenda for Water Resources Research in the Twenty-first Century (NRC 2001). The proposed hydrologic observatories are intended to fill this need.
Other distinguished panels within the hydrologic sciences community have arrived at similar conclusions from different perspectives and scientific agendas. Of recent note, the Water Cycle Study Group of the U.S. Global Change Research Program issued a report in 2001 with the following recommendation:
Establish nested basin studies in three to five river systems with varying land cover and levels of human disturbance and regulation…These studies should employ in situ measurements and remote-sensing technologies to characterize and improve understanding of linked water, carbon, and nitrogen transport and transformation processes. (USGCRP-WCSG; Hornberger et al. 2001)
Why is a large-scale field program of this nature critical? The reductionist approach in hydrology has been successful in developing an understanding of basic hydrologic processes at small spatial scales. However, the hydrologic community is now moving beyond a focused reductionist approach in order to develop the required holistic conceptual framework. A major impediment to this advancement has been the lack of spatially and temporally integrated, comprehensive hydrologic observations, which can serve as a foundation for understanding hydrologic processes at the river basin scale. For that, we propose a network of hydrologic observatories as a response to these critical science needs.
understanding at the river-basin scale. These design requirements for the core set of measurements for each hydrologic observatory will provide the essential framework within which to overlay studies designed to test specific hypotheses. This attribute of the network will result in synergy well beyond that which could be expected from a set of observatories that are networked only by a protocol of data collection that does not incorporate consistent scientific enquiry. In acknowledgment of substantial past and ongoing field programs, hydrologic
observatories must be coordinated with on-going research and monitoring programs to leverage existing investments in hydrologic data. Externally funded grants will support these research studies within the hydrologic observatories. Further, predictive understanding implies an interest in forecasting a response to change, whether it is global change or a local land use decision. Accordingly, each hydrologic observatory, as recommended for the river basin studies proposed by the USGCRP-WCSG, will ensure that its “research program communicate(s) with local watershed management organizations” (Hornberger et al. 2001) and will result in the ability to synthesize understanding of the underlying science questions at scales much greater than those of the individual observatories.
1.2 Science Vision
A network of hydrologic observatories is proposed by CUAHSI as the core of a suite of interdependent programs (see Figure 1) called HydroView; these programs will collectively advance hydrologic science through innovation in observation and synthesis. The goal of HydroView is to enable Hydrologic Science to predict changes in storages and fluxes of terrestrial waters and associated biogeochemical constituents with greater reliability and lead times. Success requires measurements in addition to those that have been routinely measured, as well as refined concepts, and better predictive models. HydroView begins this process by supplementing current observing systems with an observing strategy that focuses on information at interfaces among terrestrial storages where added coverage is judged likely to bring substantial progress.
Hydrologic observatories will provide the science community with well-supported platforms and
infrastructure essential to carry out spatially and temporally nested monitoring and experimental data generation. Each observatory will be a drainage basin of approximately 10,000 sq. km., which is considered the minimum spatial scale at which the structure of mesoscale meteorological systems can be captured. Substantial variations in this design (e.g., the size of river basins, the use of parallel river basins rather than a single basin, the use of groundwater-defined basins, etc.) will be necessary as HOs are implemented over the large variety of landforms in the United States.
The observatory network will be designed to improve predictive understanding in five science topics that were developed through a series of community workshops. These topics are:
1. Linking hydrologic and biogeochemical cycles 2. Sustainability of water resources
3. Hydrologic and ecosystem interactions 4. Hydrologic extremes
5. Fate and transport of chemical and biological contaminants
In addressing these topics, emphasis will be placed on three cross-cutting themes: 1. Forcing, feedbacks, and coupling
2. Scaling
3. Prediction and limits to predictability
In the development of specific hypotheses addressing the five science topics, four basic properties of a catchment repeatedly emerged as important. These properties are:
1. Mass in each “store”
2. Residence time within stores 3. Fluxes between stores, and 4. Flowpaths among stores.
These properties refer not just to water (e.g., water residence time within a store, such as the subsurface), but also to sediment, nutrients, and other contaminants. The data necessary for estimation of these basic properties at a range of scales are an essential part of the “core data.”
To emphasize the importance of the basic properties and scaling, we define “core data” more comprehensively than simply the measurements alone. At a hydrologic observatory, core data refers to the monitoring data, the four basic properties listed above, and the conceptual model for scaling. This broad definition means that the concept of core data includes the inferential
The basic design of each observatory will serve as a foundation upon which additional questions of local or regional interest can be explored in a cost effective manner. Given the design concepts and broad science topics described above, an observatory design team’s role is to pick a set of hypotheses of interest to it and to define a data set that will test those hypotheses. If our contention is correct, these hypotheses will require the estimation of the four fundamental catchment properties described above. The observatory design team must articulate how to delineate the basin into stores (e.g., the number of vertical layers, horizontal compartments, etc.), designate which data are required to estimate these properties, and propose an analytical
approach to convert the data into estimates of these properties. These data become the core data, which are the community product. Presumably, these data alone will not be sufficient to test all hypotheses of interest, and additional data will be collected. These additional data are “first publication” data that the investigator retains the right to publish, although they will be released to the public after a specified period. Only the additional data that are not specific to the basic design would be considered first publication data, and, in all likelihood, these data can be
collected relatively inexpensively because of the infrastructure that will be in place to support the basic design.
In this manner, the observatory design team performs a community service (by defining the core data), and receives an incentive for that service (the ability to advance their own science with first-publication rights to critical data). In this way, we are also assured that the data are sufficient to answer some science questions. The core data, it must be stressed, are made available immediately to all scientists.
The size of a hydrologic observatory should be appropriate for the study of large-scale interactions between the land surface and the atmosphere, as well as for the study of regional recharge of groundwater and other large-scale hydrologic phenomena. Note that these
watersheds will be 2-4 orders of magnitude larger than the size of the current LTER sites and probably will contain a wide range of physiographic, geologic, and land-use conditions. Because the intensive study of a drainage basin of this size would be cost prohibitive, a strategy of nesting studies of varying spatial and temporal scales within the observatory will be employed and will be extended into its air shed as required.
1.3 Goals of this Document and of the Neuse Prototype Design
Because observatories at this spatial scale and degree of complexity have never been
attempted by hydrologic scientists, CUAHSI supported the development of the prototype design of an observatory in the Neuse River drainage basin to serve as a test of the concept and its feasibility in a real world setting. We believe that this conceptual prototype will clarify the basic design and scope of a typical hydrologic observatory, and that it yields reliable estimates of the costs of implementing the network of observatories. The prototypical design has been undertaken by a team of scientists from both within and beyond the chosen basin so that a mix of both local and phenomenological knowledge was brought to bear.
capital to conduct a prototype study was the most effective tactic for initiating the observatory program. Furthermore, the conceptual prototype is intended to clarify the basic design and scope of a typical hydrologic observatory, and it yields the first reliable estimates of the costs of implementing the network of observatories.
CUAHSI chose the Neuse Watershed in North Carolina (the watershed of the Neuse River and its estuary) as the site of the prototype design. This basin is well suited for the conceptual design of a hydrologic observatory because of: (1) the leadership of the North Carolina Water Resources Research Institute (NCWRRI; www.ncsu.edu/WRRI) and the participation of many highly capable scientists from the hydrologic science community in the Research Triangle; (2) the robust suite of both historic and ongoing hydrologic data collection efforts, and (3) the fact that the Neuse Watershed contains a diversity of hydrologic and geographic settings together with a mix of land use that can serve as an adequate test of design feasibility of each of the program drivers.
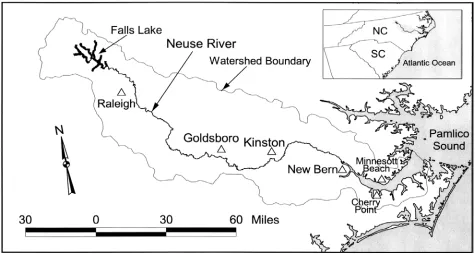
The Neuse River (see Figure 1-2) originates in the Piedmont, where its drainage is
controlled by fractured crystalline rock and flows onto the sandy coastal plain, before reaching its estuary at Pamlico Sound. The drainage area at its mouth (near Piney, NC) is 14,500 sq. km., which exceeds the minimum desirable size (10,000 sq. km) for a hydrologic observatory. The Neuse Watershed is subject to frequent floods and droughts and occasionally is affected by tropical rainfall systems. Groundwater resources are varied because the upper portion of the Neuse in the Piedmont is underlain by crystalline bedrock with locally thick saprolite, while the Coastal Plain is underlain by sedimentary aquifers with a complex stratigraphy derived from the transgressing shoreline.
The Neuse Watershed includes the rapidly expanding urban area of the Research Triangle amid large areas of agricultural and forest land. Although substantial agricultural abandonment during the 20th Century was accompanied by large-scale afforestation, this trend recently has been reversed with expanding urbanization and a reintensified agricultural sector. Rapid urban growth has resulted in a heterogeneous mix of available water supply, with some rapidly developing communities around Raleigh chronically short of water and with frequent water use restrictions, while other communities have planned adequate resources. The water supply in the Piedmont is from a mix of household and community wells, along with several developed surface water supplies.
The upper portion of the Neuse River drains approximately 7500 km2 in the Piedmont and Coastal Plain, including Raleigh and the Research Triangle, one of the most rapidly urbanizing areas of the country. The lower part of the watershed contains major commercial livestock production – largely hog and poultry operations. The shallow groundwater resources of the Coastal Plain are subject to contamination and overuse. Major hydrologic concerns in the basin include: (1) the export of nitrogen into the Neuse estuary and Pamlico Sound leading to
eutrophication and fish kills, (2) the vulnerability of water supply given the mix of development, population growth, and recent drought, (3) hurricane-induced inland flooding, (4) and (5) groundwater contamination—particularly in the coastal plain section. Thus, examples of questions central to the design of the Neuse River hydrologic observatory are:
• What are the primary mechanisms of nitrogen retention in the watershed, and how are these linked to hydrologic processes? How have urbanization in the Piedmont and confined animal feedlot operations in the coastal plain affected nitrogen export, and what has been the effect of this export on aquatic ecosystems?
• Are surface and groundwater supplies sustainable in the Neuse Basin given the mix of population growth, low and medium density urban sprawl, periodic drought, and potential ground and surface water contamination from urban and agricultural sources?
• How do hydroclimatic variability and human modifications of the hydrologic system control the dynamics of regional droughts, and what are their ecological and human consequences?
• What is the space/time distribution of sediment sources within the watershed at multiple scales? How do urbanization and agricultural operations in the piedmont and coastal plain affect soil loss?
sensing and the role of modeling in the Neuse Prototype. We conclude with a discussion of current perspectives on the operation of hydrologic observatories.
1.4 References
Hornberger, G. et al. 2001. A Plan for a New Science Initiative on the Global Water Cycle. Water Cycle Study Group of the U.S. Global Change Research Program (USGCRP-WCSG). Water Science and Technology Board (NRC). 2001. Envisioning the Agenda for Water
2. Background and Approach
2.1 Introduction
The hydrologic community has made important advances in hydrologic science that support the design of the observatories and meet the three general requirements presented in the Introduction, specifically: 1) quantitative assessment of the fluxes and stores of water, sediment, and nutrients, 2) temporally and spatially integrated measurements of these fluxes and stores, and 3) acquisition of measurements in spatially stratified manner that allows for predictive
understanding at the river-basin scale. In this chapter, we review the background understanding for meeting these requirements.
2.2 Understanding fluxes and stores of water, sediment, and nutrients
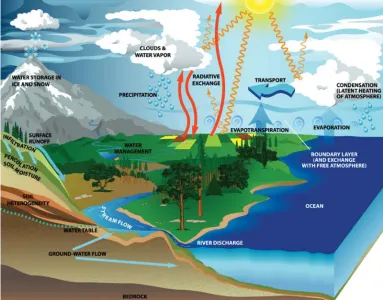
A conceptual model for the storages, flowpaths, and fluxes in the terrestrial hydrological cycle is required to address the scientific topics of the network. A schematic showing the coupled land, atmosphere, and ocean interactions of such a model, which is appropriate for the scale of the Neuse Watershed or any proposed HO, is shown in Figure 2-1.
Figure 2-1. Conceptualization of the terrestrial water cycle and its interactions with all other components of the Earth-climate system. [CCSP, 2003]
Figure 2-1 depicts the spectrum of hydrological processes that are important to
scale. For example, precipitation variability is a driving force behind water availability and extreme events such as flooding and drought. Soil moisture in the unsaturated zone is critical in partitioning rainfall into infiltration versus runoff, and solar radiation into evapotranspiration versus sensible heating of the atmosphere. Soil water is also a key component regulating biogeochemical transformations, and the productivity and distribution of vegetation. Further, soil water is a key determinant of groundwater recharge. Evapotranspiration is an essential aspect of surface-atmosphere heat exchange. It also provides moisture to the atmosphere that can subsequently be returned to its basin of origin through the process of precipitation recycling.
Surface water and groundwater stores and flowpaths are important supplies for municipal water, and both respond to extreme hydrologic events, and play key roles in transporting
sediment and biogeochemical constituents through a basin. Several of these watershed-scale processes impact water quality and related socioeconomic considerations. Clearly then, comprehensive monitoring of the terrestrial hydrology is essential for enhanced understanding and prediction of water cycling on land. Equally important is the development of research infrastructure to develop an understanding of how water mediates the transformation and flux of nutrients, carbon, contaminants and sediments within catchments, across the interfaces between major hydrologic stores (e.g. atmosphere, surface water, vadose and phreatic zones) and into receiving water bodies. An important theme in the design of a sampling strategy is colocated measurements of multi-store and multi-media hydrological processes in order to produce core data to support cross-disciplinary, integrative hydrologic science. At present, no such system currently exists at the basin and cross-network scales proposed by the HOs.
Concomitantly, HO design is confounded by the spatial-temporal scales of variability of the numerous processes and interactions shown in Figure 1, as well as by the varying residence times of the terrestrial water stores. Further, hydrologic processes show considerable
interannual variability, and accumulating evidence points strongly to long-term changes in water balance that will be evident and palpable at the HO basin-scale. The impact of land use and land cover change (LULCC) on basin-scale hydrology adds another dimension to this already
complex network design challenge.
Here we propose an integrated observing system for terrestrial hydrology in which recognition of varying space-time scales of processes and interactions, as well as of
anthropogenic alterations of the water cycle (e.g. through LULCC), is implicit in network design. Important aspects of the design include its measurement of hydrological processes at appropriate space-time scales; integrated sampling of water, chemical and sediment storage, flux and
transformation, a framework for scaling point measurements to larger sub-basin and basin scales based on important land surface heterogeneities; and the ability for cross-network
2.3 Spatially and temporally integrated measurements
Although the scope of the proposed hydrologic observing system is comprehensive, modern IT infrastructure allows a new level of interoperability, data mining of historical resources, and mediation of disparate data types, resolutions, and formats. Without these advances, the scale of this effort might not be possible. Integrating terrestrial hydrologic information across space, time and process will provide a fundamental advance in data accessibility by data analysts, physical modelers, as well as policy and management investigators.
Furthermore, advancements in hydrologic modeling will allow the coupling of diverse processes in a quantitative and predictive manner in the future. These advances in modeling will be greatly facilitated by the existence of complete and well documented datasets against. Firstly, patterns seen in these datasets will stimulate hydrologists to develop new hypotheses on
dominant processes, which can be then incorporated into developing hydrologic models. At the same time, the current models can be evaluated against these detailed datasets and patterns that are not well-represented by the models, and their underlying representation of processes, will be revealed. Finally, the development of new models will inform the evolving design of the HO. In this iterative and synergistic manner, the datasets of the Neuse River HO will stimulate new ideas and development of hydrologic models that can be used in addressing the broad range of water resource challenges that lie ahead in the 21st century.
2.4 Spatially stratified measurements for predictive understanding at
the river-basin scale
Our conceptual framework represents the elements of the hydrologic cycle as a spatially distributed set of stores, fluxes, sources and sinks of water and its constituents, including sediment, nutrients, organic matter and contaminants. The next requirement in the observatory design is to organize measurements in a manner that provides a foundation for predictive understanding at the river-basin scale. The critical hydrologic flowpaths within the Neuse River Basin, and other many river-basins, include:
1. topographically driven surface drainage paths
2. subsurface stores (soil and groundwater) and flowpaths 3. the regional stream and river channel network
4. surface water bodies including lakes and the estuary
5. flux across the interfaces between these stores, and between the stores and the atmosphere
6. the activity of human society in directly adding and abstracting water, carbon and nutrients to these stores and flowpaths
over small catchments, there is considerable uncertainty in scaling a multi-store and pathway response to larger watersheds. An alternative that has been pursued by researchers is to formulate simpler, lower dimensional hydrologic models for “typical” catchment or landscape conditions (e.g. Duffy 1996, Troch et al. 2002, Reggiani and Schellekens 2003). In fact, synthetic unit hydrograph (including the GIUH) methods are simplified runoff response representations for complex surface water responses typical of a given catchment reflecting geomorphic structure, land cover and basin shape and scale. Given the multitude of potential permutations of flowpath networks, land cover and substrate conditions, it is useful to investigate whether a finite set of “typical” landscape conditions or categories could be found to characterize the heterogeneous hydrologic response of nested, multiscale watersheds.
One strategy for the design of a hydrologic observatory is found in the similarity concept of a “hydrologic landscape”, proposed by
many authors, but perhaps best summarized by Winter (2001). This concept provides one example of how an HO network could be designed around a unifying principle that provides guidance for locating measurement sites, scaling up point observations, and a consistent framework for addressing
proposed hypotheses. It is not the intention of this section to advocate the use of any particular concept for network design. Rather, one potentially useful example is provided, of which there are many. However, proposers are encouraged to identify a clear framework for scaling local measurements to larger scales.
The concept of hydrologic landscape is based on the idea of local similarity in hydrologic process, where the hydrologic landscape unit is defined as “…an upland adjacent to a lowland separated by a valley
side” (Winter, 2001). Figure 2-2 illustrates the concept applied to conditions in the Neuse. We can say that the hydrologic system consists of (1) the movement of surface water, which is controlled by the slopes and permeability of the landscape; (2) the movement of ground water, which is controlled by the hydraulic characteristics of the geologic framework (shallow and deep strata); and (3) atmospheric-soil-vegetation water exchange, which is controlled by climate and surface conditions (Winter, 2001). Each application of the template of Figure 2-2 is meant to be representative of a typical geology, climate, soils, etc. over a specified domain.
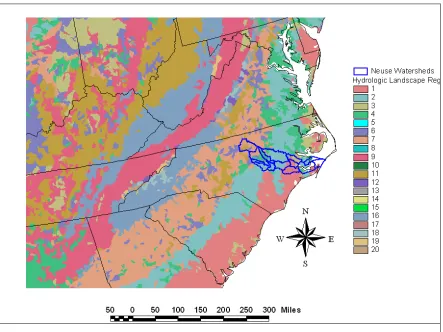
The USGS has delineated Hydrologic Landscape Regions (HLRs) across the United States applying geographic information system (GIS) tools and statistical methods including principal components and cluster analyses. The analyses were applied to land-surface form, physical properties (permeability of soil and bedrock), and climate variables that describe the setting of 43,931 small (roughly 200 square kilometers) watersheds in the United States. The analyses then grouped the watersheds into 20 noncontiguous regions (the HLRs) on the basis of similarities in land-surface form, geologic texture, and climate characteristics as shown in Figure 2-3. The HLR dataset contain the following information for each of the 49,931 watersheds across the nation: (1) watershed identification number, (2) land-surface form, geologic texture, and climate characteristics for each watershed, and (3) hydrologic landscape region number for each watershed. (ref. USGS:<http://water.usgs.gov/lookup/getspatial?hlrus>)
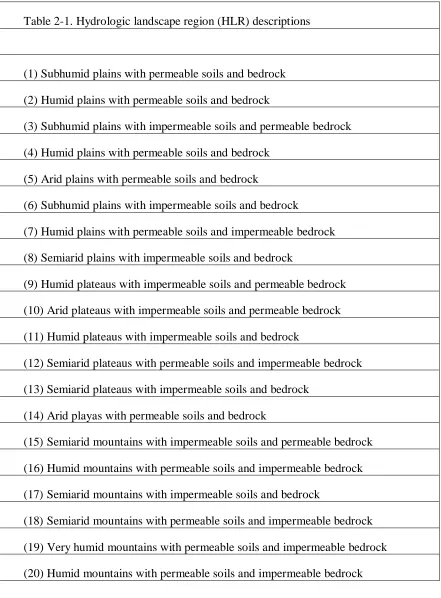
According to Wolock et al. (2004) all hydrologic landscapes can be conceived of as variations and multiples of fundamental hydrologic landscape units, and these were used to define general landscape types. Wolock et al. have divided the US into some 20 HLR’s (hydrologic landscape regions). The original purpose of HLR was to group watersheds in the United States by similarity in landscape and climate characteristics. Table 2-1 illustrates the type of information contained in the USGS website for each HLR and represents an important source of regional hydrologic data necessary for an integrated design of an observatory. Figure 2-4 illustrates the particular similarity regions for the Neuse Watershed. Clearly the HLR data grid can play an important role in observatory design by creating the physiographic/hydroclimatic template for deploying the components of the observing system.
Figure 2-3. Hydrologic Landscapes of the US and USGS
A central role of the HO network will be to develop and explicitly test strategies for scaling across regions of varying hydroclimate characteristics. Certainly, there are other factors which are not explicitly included in the HLR classification, such as landuse, ecology,
Table 2-1. Hydrologic landscape region (HLR) descriptions
(1) Subhumid plains with permeable soils and bedrock (2) Humid plains with permeable soils and bedrock
(3) Subhumid plains with impermeable soils and permeable bedrock (4) Humid plains with permeable soils and bedrock
(5) Arid plains with permeable soils and bedrock
(6) Subhumid plains with impermeable soils and bedrock
(7) Humid plains with permeable soils and impermeable bedrock (8) Semiarid plains with impermeable soils and bedrock
(9) Humid plateaus with impermeable soils and permeable bedrock (10) Arid plateaus with impermeable soils and permeable bedrock (11) Humid plateaus with impermeable soils and bedrock
(12) Semiarid plateaus with permeable soils and impermeable bedrock (13) Semiarid plateaus with impermeable soils and bedrock
(14) Arid playas with permeable soils and bedrock
(15) Semiarid mountains with impermeable soils and permeable bedrock (16) Humid mountains with permeable soils and impermeable bedrock (17) Semiarid mountains with impermeable soils and bedrock
Figure 2-4. Hydrologic Landscapes of the eastern seaboard including the Neuse Watershed (outlined in blue).
2.5 Framework for organization of hydrologic measurements
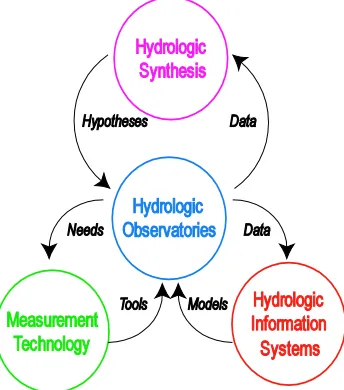
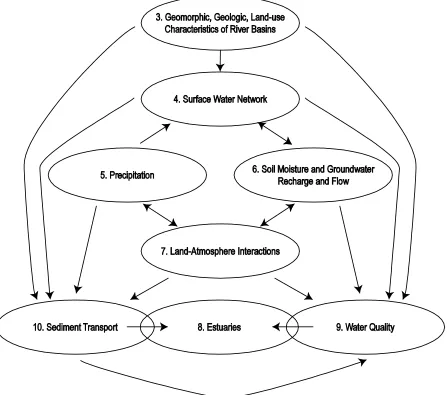
While we have developed an integrated framework for the science goals and the requirements for the hydrologic measurements, the observatory must be constructed and each measurement must be planned in a careful detailed manner, while considering this framework and the inherent cost constraints and tradeoffs. In the following chapters, we present these more detailed designs, plans and instrumentation for the Neuse River basin. The organization of these chapters follows the schematic diagram presented below:
We then present plans for intensive field campaigns, application of remote sensing, and development of hydrologic modeling that will take advantage of the capability of the observatory and present the plans for integrating social sciences within this observatory.
In Chapters 4-9, the dynamic variables of surface water flows, precipitation, groundwater and soil moisture, etc, are discussed in separate chapters. Figure 2-5 illustrates the connections, feedbacks, and demonstrates the static or dynamic linkages among the chapters.
Figure 2-5. Dependencies among succeeding chapters in this report.
2.6 References
Climate Change Science Program (CCSP). 2003. Strategic Plan for the U.S. Climate Change Science Program. 364p. Online at <http://www.climatescience.gov>.
Omernik, J.M. 1987. Ecoregions of the conterminous United States: Annals of the Association of American Geographers. (77):118-125.
Omernik, J.M., and Griffith, G.E. 1991. Ecological regions versus hydrologic units--frameworks for managing water quality: Journal of Soil and Water Conservation. (46):334-340
Reggiani, P. and Schellekens, J. 2003. Modelling of hydrological responses: the representative elementary watershed approach as an alternative blueprint for watershed modeling.
Troch, P, Van Loon, E, and A. Hilberts, 2002. Analytical solutions to a hillslope-storage
kinematic wave equation for subsurface flow. Advances in Water Resources. 25(6):637-649 Winter, T.C. 2001. The concept of hydrologic landscapes: Journal of the American Water
Resources Association. (37):335-349.
Wolock, D.M, Winter, T.C., and G. McMahon. 2004. Delineation and evaluation of hydrologic landscape regions in the United States using geographic information system tools and multivariate statistical analysis: Environmental Management (in press)
3. Watershed Characteristics
Watershed characteristics such as topography, geology, soil properties, and land use are all critical for HO landscape characterization. These types of information may require
measurement or compilation only once, or infrequently after significant changes.
3.1. Topography
Digital Elevation Models (DEMs) provide crucial information for hydrologic modeling. Although the utility of DEMs may be limited due to insufficient vertical resolution, DEM quality and resolution are rapidly improving. USGS accuracy standards for 7.5 minute data call for a vertical accuracy of 15 meters (USGS Data Users Guide 5) and much of the data (approximately 90%) is accurate to 7-8 m. This accuracy may be inadequate to model water flow, particularly in relatively flat areas with significant agricultural drainage such as the NC coastal plain area of the Neuse Watershed.
To better meet the needs of data users, the USGS has produced and is continually maintaining the National Elevation Dataset or NED. The process of creating this seamless data set removes data artifacts and performs edge matching, improving the quality of the original quad sheet data. The data are continually updated with “best available data.” As such, the 10m source DEMs are being actively integrated in the NED data. A 3m product is also being
incorporated into the NED. A detailed overview on the NED is presented by Gesch et. al. (2002). Other sources of DEMs are also being examined for integration in the NED, including LIDAR and IFSAR data (Gesch et al. 2002).
In North Carolina, the NC LIDAR (Light Detection and Ranging) program has provided a generational improvement in available DEMs for the Neuse Watershed. This program
addresses concerns of inadequate vertical resolution, particularly with respect to flood plain mapping in the hurricane and flood prone coastal plane. The data have an accuracy of 20 cm in the coastal plain and 25 cm in the inland counties. The data sensor was flown in 2001 between January and March (leaf off) and the Neuse River watershed has been completed, with elevation
data on line at
300 ft.
Figure 3.1. BE LIDAR points in forest and agricultural areas in eastern NC.
Additional DEM sources are available, such as the Shuttle Radar Topography Mission (SRTM) data product at 30 m (1 Arc Second) and 90 m (3 Arc Second). The SRTM mission mapped nearly the entire land surface between 60 degrees north and 60 degrees south latitude. The 30 m data will be available only for the United States. The 30 m SRTM product is also available as seamless data, with the same restrictions as the 30 m NED data – free for a 30-degree square area in 100 MB sized files. The elevation accuracy of these data, however, is not readily available.
Other topographic related products are being developed. Hydrologic products developed from the NED are being generated by an effort parallel to NED, the USGS Elevation Derivatives for National Applications (EDNA) project (Verdin 2000; Kost and Kelly 2001). Similar testing and development with the NC LIDAR 20 and 50 ft DEM products by the USGS for the Neuse is underway (Verdin, personal communication).
3.2. Land Use, Land Cover (LULC), LULC change (LULCC)
There are a variety of Land Use Land Cover (LULC) data sets that cover the state of North Carolina. The National Land Cover Data set (NLCD) has produced a LULC for the entire United States at a spatial resolution of 30 m. This is based on TM imagery centered around 1992, including scenes from 1990-1993. The NLCD LULC and related documentation are
freely available on-line:
started for a follow-up LULC based on imagery centered on the year 2000.
The State of North Carolina has also produced a LULC. This LULC is at a spatial resolution of 28.5 m and is based on TM imagery collected from 1993 –1995. This data set is distributed through the North Carolina Center for Geographic Information
(http://cgia.cgia.state.nc.us/cgia/) on a cost recovery basis. Documentation and accuracy
assessment is available at:
Nature Conservancy’s NC GAP data, however these data have no accuracy assessment or metadata at this time.
Other LULC data sets are available for portions of North Carolina. The US EPA Landscape Characterization Branch in Research Triangle Park, NC, has produced an excellent LULC map for the Neuse Watershed (Lunetta et al. 2000). This LULC is based on both TM and Spot imagery from 1997 and 1998. This data set includes extensive accuracy information. The EPA Neuse LULC has a spatial resolution of 15 m with a 0.1 hectare minimum mapping unit (MMU) in riparian zone (within 30 meters of streams, river shorelines, etc.) and a 0.4 hectare MMU outside the riparian zone, making this useful to address finer scale issues in this
watershed. These data are freely available to the public. There are no current plans for this LULC to be repeated in the Neuse or duplicated in additional watersheds. A moderate resolution (250m cell) LULC is being prepared for the Albemarle-Pamlico watershed by the same group.
3.3. Soils
Application of models for estimation of fluxes and residence times may be constrained by insufficient knowledge of soil hydraulic properties. Soils data from online databases including STATSGO and SSURGO databases (USDA 2004) are available for the Neuse Watershed (Figure 3.2) and can be used with pedotransfer functions to estimate hydraulic parameters. Pedotransfer functions such as implemented by the Rosetta pedotransfer software (Schaap et al. 2001), transform available soil data into hydraulic parameters including water retention and hydraulic conductivity that are difficult or expensive to measure directly. A hierarchical
approach is used to estimate hydraulic parameters based on varying levels of soil data from State Soil Geographic (STATSGO) database that is at a 1:250,000 scale and Soil Survey Geographic (SSURGO) database at a scale of 1:24,000:
1. Soil texture classification 2. Sand, silt, and clay percentages 3. Values in (b) plus bulk density
4. Values in (c) plus water retention at -3 m head 5. Values in (d) plus water retention at -150 m head
Increased knowledge of soils data (i.e., (5) vs. (1) above) results in greater accuracy in the estimated retention function parameters and saturated hydraulic conductivity values. The STATSGO database includes the following attributes: clay content, organic material, soil water capacity, permeability, infiltration, drainage, and slope. There are two versions of the SSURGO database. The SSURGO version 2 database provides more detailed soil texture data than either the SSURGO version 1 or the STATSGO database. In addition to the basic soil data, the SSURGO version 2 database provides soil water retention data at -3.3 and –150 m matric potential head, which neither the SSURGO version 1 nor the STATSGO database provide.
These determinations will include field and/or laboratory measurement of saturated hydraulic conductivity and laboratory measurement of water retention for the different soil textures encountered at the site. Collocated in-situ measurements of water content and matric potential will be used to establish in-situ water retention functions.
Soil clay content (%) 0 - 10
10 - 20 20 - 30 30 - 40 40 - 55
Figure 3.2. Distribution of clay content in the Neuse Watershed based on STATSGO data.
3.4. Nested watershed sampling design
In order to generate core data useful for estimating stores, fluxes, residence time and flowpaths at multiple scales, the full Neuse Watershed needs to be partitioned into a nested set of subwatersheds that will span distinct assemblages of hydrologic landscapes and several orders of magnitude in drainage area. We propose to gauge catchments ranging from 10-1 km2, which is approximately the area at which surface flow becomes channelized in the Neuse Watershed, through the full watershed at 104 km2. This includes five orders of magnitude in drainage area, sufficient to characterize scaling behavior in the core properties of the watershed. More detailed measurement and characterization of smaller, focal catchments will be embedded within
progressively larger watersheds, allowing critical evaluation and development of hydrologic scaling strategies. The sampling design needs to address upland sources of runoff, solutes and sediment, land-atmosphere exchange, stream water flow and quantity, as well as interface behavior within the nested subwatershed structure.
Therefore, the sampling scheme adopted by the Neuse Watershed HO is centered around measurements co-located at or near the set of stream gauges, a set of terrestrial sampling sites within the drainage areas of the gauges, and a comprehensive nested design for precipitation measurement. The backbone of our sampling design includes these three domains of
1. the stream network structure of discharge, solute flux and transformations, and sediment mobilization and routing,
2. land surface sources and sinks of water, energy, nutrients and sediment, measured at a set of land-atmosphere instrumented sites along flowpaths representative of the drainage areas contributing to the stream gauges, and
3. multi-resolution precipitation measurements with high resolution precipitation available for smaller, focal catchments.
Significant design questions in the design of this hierarchical measurement system then include:
1. How many catchments at each drainage area order of magnitude need to be gauged? 2. What range of characteristics, including hydrologic landscape category, land cover and
human activity, should be sampled?
3. What range of core measurements and datasets need to be generated, and at what spatial and temporal frequency? This includes measurements of in-stream, terrestrial, and atmospheric stores, fluxes, residence times, and flowpaths of water and its major constituents.
4. How should this design be adapted over time to new information?
The terrestrial instrumentation sites will measure the space-time distribution of those processes and stores determining land-atmosphere exchange of water, energy and
biogeochemical constituents, extending into surface/groundwater exchange, storage, and flux. In the following chapters we begin by outlining the set of stream discharge gauges that will be installed, the rationale for new gauges over and above what currently exists in the Neuse, and the set of surface, subsurface, and meteorological measurements that will be co-located to
characterize storage, flux, residence time, and flowpaths within the set of nested catchments. For the most part, these chapters follow a standard template that first outlines key science questions and/or hypotheses that instrumentation and sampling are designed to address for each of the major hydrologic cycle components. This presentation of questions/hypotheses is
followed by description of the instrumentation and sampling density within the nested catchment design established in the surface water (stream discharge) sampling scheme. In all cases,
terrestrial (surface and subsurface) instrumentation are implemented along representative flowpaths or hydrologic landscape positions within the drainage areas delimited by the stream gauge network.
Positions given in the design are approximate and will depend on site permissions and the suitability of a reach as a gauge site.
As mentioned above, stream gauging will sample discharge and water quality parameters over five orders of magnitude in terms of drainage area. The lower end of this range of scales would be the small headwater catchment, at the up-stream limit of perennial streams (~10 ha). Progressing downstream, generations of additional sites at different scales along the Neuse River will produce core data to investigate how streamflow discharge and its constituents “accumulate” along the course of our major river. Measurement along the mainstream will be complemented by discharge sampling in tributaries to the Neuse River (and, in a few cases, tributaries directly to the estuary, as the estuary is the water body that defines the overall boundary of the HO).
Dropping down one “step” in spatial scale from the full Neuse River, most of the area of the HO is contained in 17 intermediate-size watersheds (11 drain to the Neuse River, 2 drain directly to the Neuse estuary, and the remaining 4 drain to another of the 11 that drain to the Neuse River). This intermediate scale can be covered completely (no subsampling is necessary), as 17 is a relatively modest number of gauging sites. Below this scale (for smaller watersheds), it is not feasible to “exhaustively” gauge the HO (to cover every site in the HO, for several smaller scales); therefore, at smaller scales, subsampling is necessary.
The design recognizes 4 broad zones of the watershed (from inland to the coast) defined by different combinations of topography, geology, and land use. These zones helped guide the choice of stream gauging sites for smaller watersheds. There are intermediate-size watersheds in each of the 4 zones. The design calls for picking 6 intermediate-size watersheds for in-depth study at smaller scales: 1 from each of the 4 zones, plus an additional watershed in each of 2 zones having significant urban areas (so that intermediate-size watersheds with and without significant urban influence will be studied in these 2 zones).
In each of the 6 intermediate-size watersheds chosen for in-depth study, stream discharge will be measured at 6-8 sites across a range of scales, from headwater catchments with one dominant land use to the mouth of the watershed. This design allows analysis of scale effects within each and comparison of these effects among the 6 (i.e., across 4 different “hydrologic zones” or landscapes, including comparison of watersheds with and without significant urban area in 2 of the 4 zones).
Finally, given that the Neuse estuary defines the boundaries of the HO and quantifying inputs to the estuary from its watershed is a central goal, discharge measurements will be made on 5 of the larger tidal tributaries that drain directly to the estuary from it north and south shores.
3.5 References
Gesch, D.B., Oimoen, M.J., Greenlee, S.K., Nelson, C.A., Steuck, M., and D.J. Tyler. 2002. The National Elevation Dataset. Photogrammetric Engineering and Remote Sensing, vol. 63, No.1.
San Diego, California, July 9-13, 2001, Proceedings: Redlands, California, Environmental Systems Research Institute, Inc. (CD-ROM).
Lunetta, R. et al. 2000. Mid-Atlantic Stressor Profile Atlas. available at:
Schaap M.G. 2001. 'ROSETTA.' Version 1.2, US Salinity Laboratory ARS-USDA, Riverside CA.
USDA. 2004. Soils data from online databases STATSGO and SSURGO.
4. River/Stream Discharge and Overland Flow
4.1. River/Stream Discharge
4.1.1. Key Science Questions
What are the surface water inputs to the Neuse estuary from its watershed, and how do they compare with the groundwater, rainfall, and evaporative fluxes to/from the estuary?
Needed: Discharge measurements on rivers and streams flowing into the estuary, and estimates of the other water fluxes mentioned above for comparison.
How does river discharge per unit contributing area (Q/A) vary with spatial scale along the Neuse River, from headwaters to coast? What are the main controls on this variation (rainfall, soils, topography, point sources, land use and land cover) and do they change with location/scale?
Needed: River/stream discharge measurements at different scales (small watershed to full Neuse River), together with data on the possible controls listed above, and a spatial analysis relating the controls to the discharge.
Are there major differences in Q/A from intermediate-size watersheds in the four different hydrologic zones (landscapes) of the Neuse Watershed (Upper and Lower Piedmont, Upper and Lower Coastal Plain)? Are there different relations between Q/A and watershed scale in the different zones, and if so why?
Needed: River/stream discharge data on the 17 intermediate-size watersheds (150-2600 km2 in area) that make up >70% of the Neuse estuary watershed, at the outlets of the watersheds and also at different spatial scales within them; also, data on the possible controls listed in the previous question, and a spatial analysis relating the controls to the discharge.
How can information on water discharge from small watersheds with one dominant land use be used to estimate discharge from much larger watersheds of mixed land use?
Needed: Data on stream discharge from the small watersheds, understanding of controls on discharge, and a modeling framework/analysis for scaling up.
Do existing watershed models adequately predict hydrologic fluxes (especially river discharge) and stores? If not, why not, and what improvements are needed?
Needed: Data on river/stream discharge, precipitation, ET, and other hydrologic fluxes and stores, and modeling exercises that make use of the data in calibration and post-calibration prediction and sensitivity analyses.
Is the water budget of the Neuse watershed and/or its sub-watersheds changing, and if so, where (the Piedmont? Coastal Plain? sub-areas of these zones? everywhere?) and by how much? What are the implications for future flooding and low flow under likely climate change scenarios?
and model-based water budget calculations; also, predictions of flood frequency and extent under future climate and land use scenarios.
What are the rates of groundwater input to (or loss from) rivers/streams, and how do they vary with scale and other factors (geology, land use)?
Needed: Rates of shallow groundwater exchange with rivers/streams at different scales (small stream to Neuse River) together with spatial analysis of relationships between groundwater discharge and possible controls (geology, land use, etc.).
Are there strong seasonal variations (linked to temperature, hydrologic status, natural plant cycles, or agricultural operations) in the answers to the questions above, and are these variations well represented in and predicted by existing models?
Needed: For the measurements and modeling analyses discussed above, temporal coverage that spans all seasons and samples the variability within seasons (which for some fluxes may be large on time scales of several hours), together with data on the seasonal variations in temperature and the other potential influences listed in the question.
What is the improvement in predictive performance (outside the calibration period) of watershed hydrologic/nutrient models when new data on river/stream discharge at different scales across the Neuse watershed are used in calibration?
Needed: Predictions (outside the calibration period(s)) of river/stream discharge using appropriate models calibrated both with and without the new data.
4.1.2. Observing Strategy
Fifty-four new river/stream gauging sites are proposed to collect data that will be used to address the research questions above and others. The 54 new sites will complement existing USGS gauging sites (some of which date back to the 1920s). All sites would have continuous discharge data collection and at least flow-weighted composite sampling for water quality, with a program of additional high-frequency discrete-sample event sampling that will also reach many of the sites. Collection of water quality and sedimentary data at these sites is discussed in Chapters 9 and 10, respectively.
Neuse River: 5 new sites. The discharge gauging design for the Neuse River itself includes 4 new sites and 4 existing USGS gauging sites (the latter, from upstream to
downstream, are the Falls Lake Dam, Goldsboro, Kinston, and Fort Barnwell). The additional spatial coverage from the 4 new sites will give an improved quantitative spatial picture of how discharge varies along the length of the Neuse River. The new sites, from upstream to
downstream, are (1) just upstream of the Crabtree Creek confluence, (2) just downstream of the Black Creek confluence, (3) just upstream of the Mill Creek confluence, (4) just upstream of the Bear Creek confluence, and (5) at the mouth of the Neuse River, near New Bern.
the estuary and 3 on south shore). Discharge from the remaining smaller ungauged streams along the estuary will be estimated based on discharge results from the 5 gauged streams.
Intermediate-Size Watersheds: 17 new sites. Over 70% of the Neuse estuary watershed is made up of 17 intermediate-size watersheds (150-2600 ha in area). Knowing river/stream discharge at different spatial scales is relevant to a number of research questions, and gauging all 17 of these intermediate-size watersheds is a feasible task that seems the logical first-step downward in scale from gauging the full watershed inputs to the estuary. Land not in these 17 watersheds is either in small areas adjacent to the Neuse River or in the low-relief areas immediately adjacent to the estuary. Of the 17, 11 directly to the Neuse River or Falls Lake (the only reservoir on the Neuse River), 2 drain directly to Neuse estuary, and 4 are tributaries to 2 of the 11 that drain directly to the Neuse River (3 drain to Contentnia Creek and 1 to the Little River). Though 10 of the 17 currently have a USGS gauging site somewhat near the watershed outlet, the HO will investigate the feasibility of establishing new gauging sites closer to the watershed outlets (e.g., closer to the confluence with the Neuse River or to the mouth at the Neuse estuary), so these are currently counted as new sites. If use of these “ideal” sites is financially or logistically infeasible the HO would rely on continuation of the nearby USGS gauges.
Name
Area,
km2 Zone
Urban
% Farm %
Forest
% Wetland % Water %
Other %
Flat River 454 4 12.46 26.32 59.53 0.85 0.73 0.14
Little River (West) 272 4 12.79 24.38 60.17 1.55 0.94 0.18
Eno River 402 4 22.94 16.74 58.19 1.13 0.7 0.33
Little River (East) 816 3 18.25 33.52 36.93 9.77 0.98 0.56
Black Creek 274 3 23.88 32.33 34.79 6.81 1.6 0.61
Buffalo Creek 151 3 18.61 29.58 39.37 10.91 1.04 0.48
Middle Creek 341 3 27.01 23.52 41.01 7.03 0.98 0.47
Crabtree Creek 376 3 59.14 1.17 36.32 1.67 1.04 0.71
Swift Creek (West) 400 3 32.91 17.23 42.95 4.9 1.73 0.28
Mill Creek 451 3
Bear Creek 173 2 11.05 60.38 22.17 5.52 0.73 0.15
Nahunta Swamp 253 2 9.24 51.08 30.82 8.15 0.34 0.36
L. Contentnea Creek 470 2 5.99 50.43 31.23 11.88 0.42 0.15
Contentnea Creek 2608 2 12.48 43.49 31.48 11.47 0.83 0.29
Swift Creek (East) 859 1 6.09 31.16 35.7 25.57 0.4 1.14
Trent River 1153 1 4.04 28.97 42.91 23.43 0.38 0.3
TOTAL 9780
Table 4.1. 17 intermediate-size watersheds in the Neuse watershed HO. Zones are explained below. “Other” includes minor categories (grassland, barren land, unclassified land). Bold font indicates 6 watersheds proposed for intensive gauging.
Intensively-Gauged Intermediate-Size Watersheds: 27 new sites. Discharge measurements at a range of watershed scales (down to roughly 10 ha) are needed to address many of the important research questions related to spatial scale. Given that it is clearly not practical to gauge all watersheds within the Neuse HO down to this scale, choices must be made regarding which will be gauged. The approach taken was to choose a subset of the 17
intermediate-size watersheds mentioned above for discharge measurement across a range of scales. These intermediate-size watersheds were chosen from the 17 to span the full range of physiographic and land use features in the Neuse estuary watershed. The first step was
identifying where each intermediate-size watershed falls with respect to 4 zones distinguished on basis of geology, topography, and land use within the Neuse estuary watershed. The zones are based on inspection of topographic, geologic, and land use maps; from east to west they are:
• Zone 1, lower Coastal Plain: very flat, some ditching, significant agriculture but less than in Zone 2, more forest and wetland than in Zone 2, no large urban areas in the intermediate-size watersheds (New Bern is right on the estuary), clastic sedimentary geology similar to most of Zone 2
• Zone 2, upper Coastal Plain: more agriculture and less wetland and forest than Zone 1, some ditching, little urban area in most intermediate-size watersheds (the largest, Kinston and Goldsboro, are right on the Neuse River), small city of Wilson is in the Contentnia Creek watershed, mainly clastic sedimentary geology (upper part reaches metamorphic rocks)
• Zone 3, lower Piedmont: more forest, lower agriculture and wetland than Zones 1 or 2, some watersheds with great urban influence (in the Raleigh area) and others with very little urban influence, higher relief than Zones 1 and 2, granitic and metamorphic rocks with clayey saprolite
• Zone 4, upper Piedmont: mainly forest, minor agriculture, all drainage is to Falls Lake (the only reservoir on the Neuse River), some urban influence near Durham, higher relief than Zones 1 and 2, granitic and metamorphic rocks with clayey saprolite.
River/stream discharge measurements across a range of spatial scales are proposed for 6 intermediate-size watersheds: One from each zone plus one additional watershed in each of Zones 2 and 3 because of significant urban areas in these zones (allowing for selection of watersheds with and without significant urban effects in Zones 2 and 3). Discharge
watershed outlet is not included in the description below of new sites needed (because it is counted above under “Intermediate-Size Watersheds”):
• Zone 1 – Trent River: no significant urban area (except right at the mouth of the river, on the estuary), 2 existing USGS discharge gauging sites. Three more sites are needed for a total of 5 in the design, the new sites being 1 to define a mainly-agricultural small watershed, 1 to define a mainly-forested small watershed, and 1 other on the main channel of the river.
• Zone 2 – Little Contentnea Creek: no significant urban area, current discharge gauging at USGS sites S6 (below the confluence with Middle Swamp), S5 (Middle Swamp), and S2/S3 (Lizzie small agricultural watershed research site). Three more sites are needed for total of 6 in the design, the new sites being 2 more on the main channel and 1 to define a mainly-forested small watershed.
• Zone 2 – Toisnot Swamp: similar to Little Contentnea but with significant urban influence near Wilson. This watershed has no existing discharge gauging sites, 6 new sites are needed: 3 on the main channel (2 upstream of Wilson, 1 downstream of Wilson) and 3 others to define small watersheds (mainly-agricultural, mainly-forested, and mainly-urban).
• Zone 3 – Swift Creek: significant urban influence (between Raleigh and Cary) plus 2 reservoirs (Lake Benson and Lake Wheeler) and 1 existing USGS discharge gauging site. Six new sites are needed for a total of 7 in the design, the new sites being upstream and downstream of each reservoir (1 of these already exists and is considered part of the design), 1 in the lower part of watershed, 1 to define small watershed in the urban/suburban
headwaters, 1 to define a mainly-forested small watershed.
• Zone 3 – Buffalo Creek: no existing discharge gauging, no significant urban influence. The design for this watershed is similar to that for Toisnot Swamp except for the lack of a small urban watershed. Five new discharge gauging sites are needed.
• Zone 4 – Eno River: 2 existing USGS discharge gauging sites and 1 Duke Forest site are considered part of the design. Four new discharge gauging sites are needed for a total of 7, 1 on the main channel of the West Fork Eno River just upstream of its confluence with the East Fork, 1 to define a small mainly-forested watershed downstream of the Duke Forest site, 1 to define a small urban watershed near Durham, and 1 to define a small
mainly-agricultural watershed in the headwaters of the West Fork Eno River. This design leads to 14 small watersheds with single dominant land uses:
Dominan t land use
Neuse watershed Zone
TOTAL
Zone 1 Zone 2 Zone 3 Zone 4
forest 1 2 2 1 6
agricultur e
1 2 1 1 5
urban 0 1 1 1 3