ABSTRACT
Vaswani, Sudeep. Development of Models for Calculating the Life Cycle Inventory of Methanol by Liquid Phase and Conventional Production Processes. (Under the direction of Drs. Morton A. Barlaz and H. Christopher Frey).
This study deals with the development of an ASPEN PLUS process model for the liquid phase methanol (LPMEOH) process, which is in the demonstration phase at Eastman Chemical Company, TN. The model will ultimately be integrated with MSW gasification model being modeled separately and used in an integrated gasification combined cycle (IGCC) system to co-produce methanol and power from syngas obtained from MSW gasification. The LPMEOH process uses syngas as a starting material for methanol production. Model results for an example case are presented and the life cycle inventory (LCI) of methanol has been calculated starting from syngas.
When methanol is produced from the LPMEOH process, its production by conventional processes is avoided. Thus, an EXCEL spreadsheet model of methanol production using conventional process has also been developed. This model calculates the LCI of methanol from conventional process which is used to calculate the emissions avoided per kg of methanol produced by the LPMEOH process.
to fresh syngas feed, and H2/CO molar ratio in syngas feed. The syngas composition mainly depends on the source from which it is obtained (e.g. coal gasification, MSW gasification). LPMEOH process model has the capability to process syngas of varying compositions.
Sensitivity analysis of LPMEOH process model has been presented. Based on the sensitivity analysis, it is shown that for syngas compositions limited in hydrogen content, the reactor pressure of or higher than 750 psig must be used. Further it is shown that recycling the unreacted gases has an advantage of more methanol production compared to the case with no recycle. It is also shown that the syngas feed with low H2/CO ratio has lower methanol production than syngas with higher H2/CO ratio. It therefore recommended that the syngas with low H2/CO ratio be adjusted via water-gas shift reaction such that the H2/CO ratio increases thereby resulting in a higher methanol production. It is also learnt that net steam demand in the LPMEOH process increases as the syngas becomes limited in its hydrogen content. This is expected to have some implications when the LPMEOH process is combined with an IGCC system.
the changes in syngas composition, reactor pressure, syngas space velocity and the recycle ratio.
The sensitivity analysis of conventional methanol production has also been discussed. It is found that the LCI of conventional process is not very sensitive to changes in natural gas composition, which is used as a raw material for methanol production. The change in syngas conversion in methanol reactor also does not cause the overall LCI of methanol to change significantly.
DEVELOPMENT OF MODELS FOR CALCULATING THE LIFE CYCLE INVENTORY OF METHANOL BY LIQUID PHASE AND CONVENTIONAL
PRODUCTION PROCESSES
by
SUDEEP VASWANI
A thesis submitted to the Graduate Faculty of North Carolina State University
in partial fulfillment of the requirements for the Degree of
Master of Science
DEPARTMENT OF CIVIL ENGINEERING Environmental Engineering and Water Resources
Raleigh, NC 2000
BIOGRAPHY
Sudeep Vaswani was born on 31st August 1975 in Mumbai (Bombay), India. He earned a Bachelor of Engineering degree in Chemical Engineering from University of Roorkee (UOR), India in November 1998. His areas of interest upon graduation included Process Modeling and Simulation of Chemical Processes, Air Pollution Control, Air Quality and Process Thermodynamics.
ACKNOWLEDGEMENTS
I would like to express my deepest appreciation to my advisors, Drs. Morton Barlaz and Christopher Frey, for their invaluable guidance, support, and sincere help throughout my graduate study at North Carolina State University. Special thanks to the United States Environmental Protection Agency (U.S. EPA) and National Science Foundation (NSF) for funding the project. I would like to thank Dr. Michael Overcash, who provided help in this research project. I would like to thank my roommates, Ravindra, Madhur, and Manoj for being ever supportive and understanding on every front. I would also like to thank my project partner, Matt, who helped me learn ASPEN PLUS fast and was always ready to help solve the project related problems that I had. Thanks are also due to my officemate and friend, Dan, for being very nice to me and extending his help whenever I needed it. I would like to thank my friend and officemate, Sachin, who was always helpful in every regard. I spent really nice “take it EZ” time with him in my office and out.
TABLE OF CONTENTS
LIST OF FIGURES……….xi
LIST OF TABLES………...xv
1.0 INTRODUCTION AND BACKGROUND INFORMATION ...1
1.1 MOTIVATING QUESTIONS...3
1.2 OVERVIEW OF MSW MANAGEMENT...4
1.3 GASIFICATION SYSTEMS AND MSW GASIFICATION TECHNOLOGY...6
1.4 METHANOL PRODUCTION...7
1.5 LIFE CYCLE INVENTORY ANALYSIS OF CHEMICALS...8
1.6 OBJECTIVES...9
2.0 LIFE CYCLE INVENTORY OF STEAM ...11
2.1 BACKGROUND...12
2.2 SYSTEM BOUNDARIES AND DESIGN BASIS...15
2.3 CALCULATION OF THE LCI OF STEAM...21
2.3.1 Pre-combustion Emissions from the Fuels Fired...21
2.3.2 Combustion of Coal to Generate Steam ...27
2.3.3 Combustion of Fuel Oil for the Generation of Steam ... 30
2.3.4 Combustion of Natural Gas for Generation of Steam... 33
2.3.6 LCI of Lime consumed for the Removal of SO2 in a Spray Dryer ...38
2.3.7 LCI Associated with Boiler Feed Water (BFW) Pretreatment ...41
2.3.8 Overall LCI of Steam production...45
3.0 LIFE CYCLE INVENTORY OF ELECTRICITY ...51
3.1 DESIGN BASIS AND SYSTEM BOUNDARIES...52
3.2 ELECTRIC GRID DEFINITION...53
3.3 GENERATION EFFICIENCIES OF ELECTRICITY GENERATION...54
3.4 FUEL HEATING VALUES...54
3.5 FUEL PRE-COMBUSTION ENERGY... 55
3.6 TOTAL FUEL EMISSIONS AND LCI CALCULATION...56
4.0 LIQUID PHASE METHANOL PROCESS...59
4.1 OVERVIEW OF METHANOL PRODUCTION...60
4.1.1 The ICI Low-Pressure Methanol Synthesis Process ... 65
4.1.2 The Lurgi Low-Pressure Methanol Synthesis Process... 69
4.1.3 The MGC Low-Pressure Process...72
4.1.4 Liquid Phase Methanol Process ... 73
4.1.5 Water-gas Shift Reaction...78
4.2 COMMERCIAL STATUS OF LIQUID PHASE METHANOL (LPMEOHTM) TECHNOLOGY... 80
PROCESS...89
4.4.1 LPMEOHTM Process Description ...89
4.4.2 Process Chemistry of Methanol Synthesis...94
4.4.3 Catalyst Activity ...95
4.4.4 Major Process Equipment ...96
4.5 MAJOR PROCESS SECTIONS IN THE LPMEOHTMPROCESS MODEL IN ASPENPLUS... 104
4.5.1 Guard Bed... 104
4.5.2 Feed-Recycle Mixer ... 104
4.5.3 Economizer ... 109
4.5.4 LPMEOHTM Reactor ... 109
4.5.5 Cyclone Separator... 118
4.5.6 Oil Separator ... 118
4.5.7 Pre-Methanol Separator Condensers... 119
4.5.8 Pre-Methanol Separator Flash Valve ... 119
4.5.9 Methanol Separator ... 120
4.5.10 Recycle and Purge Gas Splitter ... 120
4.5.11 Pre-Distillation Pressure Relief Valve ... 121
4.5.12 Methanol Distillation and Purification Section... 121
4.5.13 Distillation Column Reboiler... 122
4.5.14 Recycle Gas Compressor... 123
4.5.16 Fresh and Recycle Syngas Mixer ... 124
4.5.17 Purge Mixer ... 124
4.6 DESIGN SPECIFICATION AND FORTRAN BLOCKS USED IN LPMEOH PROCESS MODEL... 127
4.7 CONVERGENCE SEQUENCE OF LPMEOH PROCESS MODEL... 128
4.8 LPMEOH PROCESS MODEL VERIFICATION AND VALIDATION... 134
4.8.1 Comparison of the Model Results with the Actual Plant Results ... 134
4.8.2 Sensitivity Analysis on the LPMEOH Process Model... 135
4.9 APPLICATION OF THE LIQUID PHASE METHANOL (LPMEOH) PROCESS MODEL TO A BASE CASE. ... 135
4.9.1 Input Assumptions ... 136
4.9.2 Running the Model and Model Results ... 137
4.10 LIFE CYCLE INVENTORY OF LPMEOH PROCESS... 144
4.10.1 System Boundaries and Design Basis ... 144
4.10.2 Calculation of LPMEOH Process LCI... 146
4.11 SENSITIVITY ANALYSIS OF LPMEOH PROCESS MODEL IN ASPEN PLUS ... 164
4.11.1 Syngases Considered in the Sensitivity Analysis ... 165
4.11.2 Sensitivity Analysis on Texaco Syngas used at LPMEOH Process Demonstration Facility at Kingsport ... 167
Fired British Gas and Lurgi (BGL) Gasifier... 190
4.11.5 Comparison of Sensitivity Results Among Various Syngas Compositions Considered... 198
4.11.6 Sensitivity Analysis of the LCI of Methanol... 203
5.0 LIFE CYCLE INVENTORY OF METHANOL PRODUCED BY CONVENTIONAL PROCESS... 217
5.1 OVERVIEW OF METHANOL PRODUCTION BY CONVENTIONAL PROCESS... 218
5.1.1 Natural Gas Compression and Steam Supply... 222
5.1.2 Syngas Generation ... 222
5.1.3 Waste Heat Boiler (WHB) ... 223
5.1.4 Water Removal and Knock-out Drum ... 224
5.1.5 Syngas Compressor... 224
5.1.6 Methanol Reactor... 224
5.1.7 Syngas Feed/Methanol Product Heat Exchanger (Feed-Preheater) ... 226
5.1.8 Methanol Condenser ... 227
5.1.9 Pre-Flash Drum Pressure Relief Valve... 227
5.1.10 Flash Drum for Removal of Uncondensed Gases... 227
5.1.11 DME Distillation... 228
5.1.12 Pre-Methanol Distillation Pressure Relief Valve ... 228
5.1.13 Methanol Distillation ... 229
5.2.1 Mass Balance Sub-Model ... 231
5.2.2 Energy Balance Sub-Model ... 231
5.2.3 Physical Property Sub-Model... 231
5.2.4 Purge Emissions Sub-Model... 234
5.2.5 Fugitive Emissions Sub-Model ... 234
5.2.6 LCI of Steam Sub-Model ... 234
5.2.7 LCI of Electricity Sub-Model... 235
5.2.8 Pre-Combustion Sub-Model ... 235
5.2.9 Overall LCI of Methanol Model ... 236
5.3 LCI OF METHANOL PRODUCTION... 236
5.3.1 Mass Balance across the Conventional Methanol Process... 237
5.3.2 Energy Balance Across the Conventional Methanol Process ... 253
5.3.3 Calculation of the LCI of Methanol Production from a Conventional Process ... 276
5.4 SENSITIVITY ANALYSIS OF THE CONVENTIONAL METHANOL PROCESS MODEL ... 294
5.4.1 Sensitivity of Methanol LCI to Natural Gas Composition ... 294
5.4.2 Sensitivity of Methanol LCI to Methane Conversion in the Steam Reformer.... ... 304
6.0 CONCLUSIONS ... 315
7.0 REFERENCES ... 323
LIST OF FIGURES
Figure 4-1. Methanol Converter Types ...64 Figure 4-2. The ICI Low Pressure Process ... 68 Figure 4-3. The Lurgi Low Pressure Process ...71 Figure 4-4. Simplified Process Flowsheet for Liquid Phase Methanol (LPMEOH™)
Process ...76 Figure 4-5. Simplified Process Diagram (LPMEOH™ Process Demonstration Facility,
Kingsport)... 93 Figure 4-6. LPMEOH™ Reactor and Reaction Schematics...97 Figure 4-7. LPMEOH™ Process Flowsheet as Modeled in ASPEN PLUS ... 108 Figure 4-8. Graph of (H2+CO) Conversion Predicted by Equation 4-13 versus Actual
(H2+CO) Conversion as in Table 4-6 ... 114 Figure 4-9. (H2+CO) Conversion From Actual Plant Data Compared with that Obtained
by Using Equation (4-13) and Equation (4-14) ... 117 Figure 4-10. Convergence Sequence for the LPMEOH™ Process Model in ASPEN
PLUS... 133 Figure 4-11. Results of Sensitivity of Reactor Pressure on Methanol Production, Steam
Used at Kingsport. ... 173 Figure 4-13. Results of Sensitivity of Syngas Space Velocity on Methanol Production,
Steam Production, Steam Consumption, and Net Steam Consumption for Texaco Syngas Being Used at Kingsport... 176 Figure 4-14. Results of Sensitivity of Syngas Space Velocity on Electricity Consumption
in Recycle Gas Compressor and Purge Gas Flowrate for Texaco Syngas Being Used at Kingsport ... 176 Figure 4-15. Results of Sensitivity of Recycle Ratio on Methanol Production, Steam
Production, Steam Consumption, and Net Steam Consumption for Texaco Syngas Being Used at Kingsport ... 179 Figure 4-16. Results of Sensitivity of Recycle Ratio on Electricity Consumption in
Recycle Gas Compressor and Purge Gas Flowrate for Texaco Syngas Being Used at Kingsport ... 179 Figure 4-17. Results of Sensitivity of Reactor Pressure on Methanol Production, Steam
Production, Steam Consumption, and Net Steam Consumption for the Syngas Obtained from Coal Fired BGL Gasifier ... 184 Figure 4-18. Results of Sensitivity of Reactor Pressure on Electricity Consumption in
Recycle Gas Compressor and Purge Gas Flowrate for the Syngas Obtained from Coal Fired BGL Gasifier ... 184 Figure 4-19. Results of Sensitivity of Syngas Space Velocity on Methanol Production,
Figure 4-20. Results of Sensitivity of Syngas Space Velocity on Electricity Consumption in Recycle Gas Compressor and Purge Gas Flowrate for the Syngas Obtained from Coal Fired BGL Gasifier ... 186 Figure 4-21. Results of Sensitivity of Recycle Ratio on Methanol Production, Steam
Production, Steam Consumption, and Net Steam Consumption for the Syngas Obtained from Coal Fired BGL Gasifier ... 189 Figure 4-22. Results of Sensitivity of Syngas Recycle Ratio on Electricity Consumption
in Recycle Gas Compressor and Purge Gas Flowrate for the Syngas Obtained from Coal Fired BGL Gasifier ... 189 Figure 4-23. Results of Sensitivity of Reactor Pressure on Methanol Production, Steam
Production, Steam Consumption, and Net Steam Consumption for the Syngas Obtained from MSW Fired BGL Gasifier ... 193 Figure 4-24. Results of Sensitivity of Reactor Pressure on Electricity Consumption in
Recycle Gas Compressor and Purge Gas Flowrate for the Syngas Obtained from MSW Fired BGL Gasifier... 193 Figure 4-25. Results of Sensitivity of Syngas Space Velocity on Methanol Production,
Steam Production, Steam Consumption, and Net Steam Consumption for the Syngas Obtained from MSW Fired BGL Gasifier ... 195 Figure 4-26. Results of Sensitivity of Reactor Pressure on Electricity Consumption in
Production, Steam Consumption, and Net Steam Consumption for the Syngas Obtained from MSW Fired BGL Gasifier ... 197 Figure 4-28. Results of Sensitivity of Syngas Recycle Ratio on Electricity Consumption
in Recycle Gas Compressor and Purge Gas Flowrate for the Syngas Obtained from MSW Fired BGL Gasifier... 197 Figure 4-29. Comparison of Methanol Production, Stream Production, Steam
Consumption, Net Steam Consumption for: (1) Texaco Syngas (Kingsport); (2) MSW Fired BGL Gasifier Syngas; and (3) Coal Fired BGL Gasifier
Syngas ... 199 Figure 4-30. Comparison of Electricity Consumption and Purge Gas Production for: (1)
Texaco Syngas (Kingsport); (2) MSW Fired BGL Gasifier Syngas; and (3) Coal Fired BGL Gasifier Syngas... 199 Figure 5-1. Simplified Flowsheet for the Production of Methanol by a Conventional
LIST OF TABLES
Table 2-1. Boiler Population Distribution by Heat-transfer Configuration...14 Table 2-2. Relative Distribution by Capacity of the Three Types of Industrial Boilers .. 15 Table 2-3. Percentage of Installed Capacity of Various Fuel Type Watertube Boilers in
2.9 MWt to 29.3 MWt Heat-input Category (U.S. EPA, 1982)...18 Table 2-4. Ultimate Analysis and Heating Values of Fuels Used in Developing the
Emission Factors (Pechtl and Chen, 1992; Perry, 1997; U.S. EPA, 1982).... 18 Table 2-5. Code of Federal Regulations Emissions Limit for Boilers Heat Rate in the
Range of 2.9 MWt to 29 MWt (from 40 CFR Part 60 – As revised on July 1999) ...19 Table 2-6. Pre-Combustion Emissions per 1000 Units of Fuel (Dumas, 1998) ...23 Table 2-7. Pre-Combustion Emissions for 1 MJ of Steam Produced...25 Table 2-8. Emission Factors of Various Pollutants After APC for Different Coal Fired
Boilers Firing Bituminous Coal... 29 Table 2-9. Emission Factors for Various Pollutants After APC Equipment for Distillate
and Residual Oil Fired Industrial Boilers...32 Table 2-10. Emission Factors for Various Pollutants After APC Equipment for Natural
Table 2-13. LCI of Lime Associated with Removal of SO2 for 1MJ Steam Production . 40
Table 2-14. LCI of BFW Treatment for 1 MJ Steam Generation... 43
Table 2-15. LCI of Steam (Units: kg/MJ of steam) ...47
Table 2-16. LCI of Steam (Units: lb/MMBtu of steam)...49
Table 3-1. National Electric Generation by Fuel Type (Dumas, 1998) ...53
Table 3-2. National Grid Generation Efficiencies (Dumas, 1998) ... 54
Table 3-3. National Grid Fuel Heating Values (Dumas, 1998) ...55
Table 3-4. Fuel Pre-Combustion Energy (Dumas, 1998)...56
Table 3-5. Emissions produced per kWh of Electricity generated (LCI of Electricity)a.. 58
Table 4-1. Processes and Feedstocks for Methanol Production ...60
Table 4-2. Chem Systems Inc, Bench-scale Testing of LPMEOH PDU ...82
Table 4-3. LPMEOHTM PDU, LaPorte, Texas ...84
Table 4-4. Commercial Scale Demonstration of LPMEOHTM Process, Kingsport (260 TPD Plant)... 86
Table 4-5 Description of Stream Numbers Used in the Process Flowsheet of LPMEOH Process as Modeled in ASPEN PLUS (Figure 4-7)... 106
Table 4-6. Data Set Used in Regression Analysis to Develop a (H2+CO) Conversion Model (C) for the LPMEOH Reactor as a Function of Pressure, P, Space Velocity, SV, and H2/CO ratio, R... 112
Obtained From Equation 4-13 (before modification) and Equation 4-14 (after
modification). ... 116
Table 4-9. LPMEOHTM Process Unit Operation Block Description for ASPENPLUS Model ... 125
Table 4-10. Convergence Blocks and the Methods used for Convergence... 131
Table 4-11. Summary of Convergence Sequence ... 131
Table 4-12. Temperature, Pressure and Composition of Fresh Syngas Feed Used in the Base Case (Air Products and Chemicals, Inc., 1997) ... 140
Table 4-13. Summary of Selected Base Case Input Values for the LPMEOH Process (Air Products and Chemicals, Inc., 1997) ... 141
Table 4-14. Summary of the Results Produced by LPMEOH Model inASPEN PLUS for the Base Case... 142
Table 4-15. Comparison of Simulation Results of the Same Base Case with Two Different Values of ‘A’ in Equation (4-16)... 143
Table 4-16. LCI Parameters considered in the LCI of LPMEOH Process... 146
Table 4-17. LCI of Steam in LPMEOH Process for the Base Case... 149
Table 4-18. LCI of Electricity for LPMEOH Process Base Case ... 152
Table 4-19. Composition of Purge Gas for the Base Case ... 154
Table 4-20. LCI of Purge Gas for the Base Case... 155
Table 4-21. Fugitive Emissions from LPMEOH Process... 157
Table 4-24. Overall Emissions Due to BOD Removal Including the Emissions from
Electricity Generation (LCI of Electricity) ... 160 Table 4-25. Overall LCI of Methanol (LPMEOH Process Base Case, in kg/kg of
methanol produced) ... 162 Table 4-26. Temperature and Composition of Texaco Gasifier Syngas (Air Products and
Chemicals, Inc., 1997) ... 166 Table 4-27. Results of Sensitivity Analysis for Varying Pressure, Space Velocity, and
Recycle Ratio in LPMEOH Process Operating on Texaco Syngas Being Used at Kingsport ... 169 Table 4-28. Results of Sensitivity Analysis for Varying Pressure, Space Velocity, and
Recycle Ratio in LPMEOH Process Operating on Syngas Obtained from Coal Fired BGL Gasifier ... 181 Table 4-29. Results of Sensitivity Analysis for Varying Pressure, Space Velocity, and
Recycle Ratio in LPMEOH Process Operating on Syngas Obtained from MSW Fired BGL Gasifier ... 191 Table 4-30. Sensitivity Results for Texaco Syngas on per kg of Methanol Produced Basis
for Reactor Pressure of 750 psig and 1000 psig. ... 205 Table 4-31. The LCI of Methanol for Reactor Pressures of 750 psig and 1000 psig in
LPMEOH Process Using Texaco Syngas ... 206 Table 4-32. Sensitivity Results for Texaco Syngas on per kg of Methanol Produced Basis
Table 4-33. The LCI of Methanol for Syngas Space Velocities of 4000 Sl/kg-hr and 8000 Sl/kg-hr in LPMEOH Process Using Texaco Syngas... 209 Table 4-34. Sensitivity Results for Texaco Syngas on per kg of Methanol Produced Basis
for Recycle Ratios of 2 moles recycle/moles fresh feed and 3 moles
recycle/moles fresh feed... 211 Table 4-35. The LCI of Methanol for Recycle Ratios of 2 moles recycle gas/moles fresh
feed and 3 moles recycle gas/moles fresh feed in LPMEOH Process Using Texaco Syngas... 212 Table 4-36. Sensitivity Results for Different Syngas Compositions on per kg of
Methanol Produced Basis for Reactor Pressure of 750 psig, Syngas Space Velocity of 8827 standard liters/kg-hr and Recycle Ratio of 3.22 moles
recycle gas/moles fresh syngas feed ... 214 Table 4-37. The LCI of Methanol for Different Syngas Compositions Using Reactor
Pressure of 750 psig, Syngas Space Velocity of 8827 standard liters/kg-hr and Recycle Ratio of 3.22 moles recycle gas/moles fresh syngas feed ... 215 Table 5-1. Typical Natural Gas Compositions ... 222 Table 5-2. Physical Properties of Compounds used in Physical Property Sub-Model .. 233 Table 5-3. Default Input Values of Process Variables Used for Conventional Methanol
Production ... 249 Table 5-4. Mass Balance Across Methanol Production Process (All flowrates are in
(28,500 kg/hr of Methanol Production) ... 275 Table 5-6. LCI of Steam Used in the Conventional Methanol Synthesis Process... 279 Table 5-7. LCI of Electricity used in the Conventional Methanol Synthesis Process ... 282 Table 5-8. LCI for Fugitive Emissions from Conventional Methanol Synthesis Process
... 283 Table 5-9. Emissions Associated with Purge Gas Combustion ... 285 Table 5-10. Uncontrolled and Controlled Emissions from Fired Heaters FiringNatural
Gas (AP-42, US EPA, 1998) ... 287 Table 5-11. Emissions due to Natural Gas Combustion in Steam Reformer Furnace ... 288 Table 5-12. Pre-Combustion Emissions due to Natural Gas Use in Methanol Process. 290 Table 5-13. Overall LCI of Methanol Using Conventional Process (kg/kg methanol
produced)... 292 Table 5-14. Natural Gas Compositions from Various U.S. Fields (Babcock and Wilcox,
1972) ... 295 Table 5-15. Selected Model Results for Various Natural Gas Compositions Given in
Table 5-14 ... 296 Table 5-16. Selected Model Results for Various Natural Gas Compositions Given in
Table 5-14 on per kg of Methanol Produced Basis ... 296 Table 5-17. LCI of Methanol for the Base Case Natural Gas Composition (Units: kg/kg
of methanol produced) ... 300 Table 5-18. The LCI of Methanol for the Pennsylvania Natural Gas Composition and
methanol produced) ... 301 Table 19. LCI of Methanol based on Various Natural Gas Compositions as in Table
5-14 ... 303 Table 5-20. Model Results for Various CH4 Conversions in the Steam Reformer ... 305 Table 5-21. Model Results for Various CH4 Conversions in the Steam Reformer on per
kg of Methanol Produced Basis... 305 Table 5-22. Overall LCI of Methanol for Different CH4 Conversions and the Percentage
Difference With Respect to the Base Case (Units: kg/kg of methanol) ... 307 Table 5-23. Model Results for Various CO and CO2 Conversions in the Methanol
Reactor ... 309 Table 5-24. Model Results for Various CO and CO2 Conversions in the Methanol
Reactor on per kg of Methanol Produced Basis ... 309 Table 5-25. LCI of Methanol for Various CO and CO2 Percent Conversions in Methanol
Reactor (Units: kg/kg of methanol produced) ... 312 Table 5-26. Comparison of the Overall LCI of Methanol with 99 Percent and 99.99
1.0 INTRODUCTION AND BACKGROUND INFORMATION
Management of municipal solid waste (MSW) continues to be a high priority issue for many communities as we enter the new century. Landfilling has been the most common method of solid waste management in the U.S. (Tchobanoglous, 1993). As the space available for landfilling MSW continues to shrink, alternative methods for its management are being sought. Another popular way of treating MSW is by thermal processing. Thermal processing is used both for volume reduction and energy recovery. The two most focused ways of thermal processing are incineration and gasification of MSW. Due to recently demonstrated benefits of gasification over incineration, as described in the following paragraph, gasification technology is under great attention (Simbeck et al., 1983; Stiegel, 2000).
production of chemicals. Also, gasification technology, when used in an integrated gasification combined cycle (IGCC) system, has higher thermal efficiency and lower pollutant production compared to conventional power generation systems (Frey and Rubin, 1992; Stiegel, 2000).
The work described here is a part of a larger project that will develop novel assessment methodologies for evaluation of the risks and potential pay-offs of new technologies that avoid pollutant production. The methodology will be demonstrated via a detailed case study of one promising new pollution prevention technology – gasification of MSW for the production of syngas to generate power and produce chemicals (e.g., methanol). The approach will utilize process simulation and optimization in ASPEN PLUS to simulate the chosen technology. Life cycle analysis will then be applied leading to the development of a life cycle inventory (LCI) of chemicals produced by MSW gasification technology. A parallel LCI will also be developed to calculate the benefits of chemical production via gasification relative to conventional production process.
While LCI of steam was developed in this project, the LCI of electricity was directly used from the electric energy process model developed by Dumas (1998).
The following subsection presents the motivating questions of this study. An overview of MSW management is presented next followed by the commercial status of gasification systems and MSW gasification technology. Production of methanol is then described. Information on LCI analysis and its need is presented next. Objectives of the study are then presented.
1.1 Motivating Questions
In order to evaluate the risks and potential pay-offs of a new technology, the LPMEOH process, there is a need to develop a systematic approach for its assessment. The performance and emissions of the technology need to be characterized on a basis such that comparison can be made with conventional methanol technology. The current study deals with the development of models for calculating the LCI of methanol production from LPMEOH and conventional process and has following motivating questions:
2. What are the emissions from the alternative conventional process of methanol production for calculation of emission offsets?
3. What are the key design variables that affect the performance of LPMEOH process and the LCI associated with it?
4. What is the sensitivity of LPMEOH process model and conventional process model LCI to changes in key design variables?
5. How does the LCI of methanol obtained from LPMEOH process compare with that obtained from conventional process?
6. What are the main issues/key parameters involved in combining the LPMEOH process with an IGCC system for coproduction of methanol with power?
The following section presents an overview of MSW management.
1.2 Overview of MSW Management
Landfills are the physical facilities used for the disposal of residual solid wastes in the surface soils of the earth. Chief advantages of landfilling are low cost, and production of landfill gas consisting mainly of methane which can be used for energy recovery. Disadvantages of landfills include: (1) the uncontrolled release of landfill gases that might migrate off-site and cause odor and other potentially dangerous conditions; (2) the uncontrolled release of leachate that might migrate down to underlying groundwater or to surface water; and (3) limited availability of space for construction of landfills. As available land continues to decrease, landfilling is becoming a less desirable alternative for waste disposal. Alternatives are being considered and one of the most widely focused methods is thermal conversion of solid waste which results is significant volume reduction prior to burial.
for wide variety of applications and potential to achieve low air pollution emissions with simplified air pollution control devices (Tchobanoglous, 1993). The following section briefly describes gasification technology.
1.3 Gasification Systems and MSW Gasification Technology
Gasification is an energy efficient technique for reducing the volume of solid waste and for recovery of energy. The process involves partial combustion of carbonaceous fuel to generate a combustible gas rich in CO, H2, and some saturated hydrocarbons, principally methane. The combustible fuel gas can then be combusted in an internal combustion engine, gas turbine, or boiler under excess-air conditions. One method of utilizing gasification to produce power is an integrated gasification combined cycle (IGCC) system. Besides the production of electricity, a gasification plant can also produce several chemicals such as methanol, hydrogen, ammonia, sulfuric acid, formaldehyde, and others (Simbeck et al., 1983)
waste and coal. The plant produces 120,000 tons per year of grade AA methanol (>99.85 percent purity by weight) and 75 MW electricity. The following section briefly describes the production of methanol starting from synthesis gas.
1.4 Methanol Production
There are 18 methanol production plants in the United States with a total annual capacity of over 2.6 billion gallons per year (American Methanol Institute, 1998). Worldwide, over 90 methanol plants have the capacity to produce over 11 billion gallons of methanol annually. The typical feedstock used in the production of methanol is natural gas. Methanol also can be made from renewable resources such as wood, municipal solid wastes and sewage. In either case the starting material is syngas. In syngas, CO, CO2 and H2 react over a copper-based catalyst to produce methanol, which is then condensed and finally refined in a distillation column.
The current thrust in the methanol process industry is to produce methanol using a syngas that is obtained from wastes i.e. MSW. The Lurgi Shwarze Pumpe plant described in the previous section is one example, where methanol is being produced using syngas obtained from solid waste. Syngas produced by dirty fuels such as coal and MSW is high in CO content and requires a shift conversion to achieve an H2/CO ratio near two in order for the conventional methanol plant to operate optimally (Cheng and Kung, 1994). A new technology of methanol production, the liquid phase methanol (LPMEOH) process, currently undergoing demonstration at Eastman Chemical Company, TN, is expected to produce methanol from syngas richer in CO without having to perform a shift reaction. This technology is therefore expected to perform well on the syngas produced by MSW gasification. Other advantages of this process over conventional processes (ICI and Lurgi) are described in Chapter 4.
The following section presents a brief description of the need to develop the LCI of chemicals.
1.5 Life Cycle Inventory Analysis of Chemicals
A complete life cycle study consists of three complementary components: (1) inventory analysis, which is a compilation of all material and energy requirements associated with each stage of product manufacture, use and disposal; (2) impact analysis, a process in which the effects of the inventory on the environment are assessed; and (3) improvement analysis, which is aimed at reducing the product impact on the environment (Pistikopulos et al., 1994). LCI can be used in process analysis, material selection, product evaluation, product comparison, and policy making.
1.6 Objectives
The objectives of the current work are:
1. To develop the models for calculating the LCI of methanol from LPMEOH and conventional production technologies.
2. To perform the sensitivity analysis on models developed in (1) to understand the key parameters affecting their performance and the LCI of methanol. 3. To compare the LCI of methanol produced by the LPMEOH and conventional
production technologies.
2.0 LIFE CYCLE INVENTORY OF STEAM
The objective of this chapter is to present a methodology to calculate the life cycle inventory (LCI) of steam. Steam is used in many process industries as a heating medium, in the process itself or for the generation of electricity. Production of nearly all the chemicals in a process industry requires the use of steam in some manner (Babcock and Wilcox, 1972). Thus, in order to develop an overall LCI of a particular chemical, the LCI of steam is typically required as a key component. The methodology described in this section considers emissions that result from fuel combustion in a boiler for the generation of steam. Pre-combustion emissions associated with fuel production such as surface and underground mining, transportation, fugitive emissions and others are also included. Emission factors are calculated for particulate matter (PM), SO2, NOx, CO, hydrocarbons (HC), CH4, HCl, VOCs and trace metals. Water emissions and solid waste generation as a result of boiler feed water pretreatment and use of materials in air pollution control equipment are also considered. Emission factors are calculated in units of kg pollutant per MJ of steam produced and lb pollutant per million Btu (MMBtu) of steam produced.
2.1 Background
Steam is a vapor form of water. It plays a pivotal role in industrial plants because of its availability and advantageous properties for use in heating processes and power cycles. When steam is used for process heating, it provides an excellent rate of heat transfer and control of process temperature. It is a good way of conveying heat released from the combustion of a fuel to the place where heat is needed. Over 45 percent of all the fuel burned by U.S. manufacturers is consumed to produce steam. It costs approximately $18 billion (1997 dollars) annually in fuel costs to feed the boilers generating the steam (U.S. DOE, 1999).
Boilers can be classified by type, fuel, and method of construction. Boiler types are identified by heat transfer method (watertube, firetube, or cast iron), the arrangement of heat transfer surfaces (horizontal, vertical, straight or bent tube), and in the case of coal, the fuel feed system (pulverized or stoker). The major distinguishing characteristic of a boiler is its heat transfer mechanism. Based on this classification, boilers can be divided into 3 major groups (U.S. EPA, 1982): (1) watertube boilers; (2) firetube boilers; and (3) cast iron boilers. Each is described in the following sections.
(1) Watertube boilers: Watertube boilers are used in a variety of applications ranging from supplying large amounts of process steam to providing space heat for industrial facilities. In these types of boilers, water passes through the inside of heat transfer tubes while the outside of the tube is heated by direct contact with hot combustion gases. This process results in generation of high pressure, high temperature steam. Watertube boilers are available, as packaged or field-erected units, in capacities ranging from less than 2.9 MW to over 200 MW (10 x 106 Btu/hr to 700 x 106 Btu/h) thermal input. Industrial watertube boilers can burn coal, residual oil, distillate oil, natural gas, liquefied petroleum gas and other fossil and nonfossil fuels.
outside of the tubes. Firetube boilers are usually limited in size to less than 5.9 MW (20 x 106 Btu/h) thermal input. Most of the installed capacity of firetube units is oil- and gas-fired.
(3) Cast Iron boilers: In cast iron boilers, the hot gas is contained inside the tubes and the water being heated circulates outside the tubes. The units are constructed of cast iron rather than steel. Cast iron boilers are used to produce either low-pressure steam or hot water. Generally, boiler capacity ranges from 0.001 MW to 2.9 MW (0.003 x 10⁶ Btu/h to 10 x 106 Btu/h) thermal input with pressure ratings up to 690 kPa (100 psi) for hot water units and 100 kPa (15 psi) for steam units. Thus, cast iron boilers are most commonly used in domestic or small commercial application.
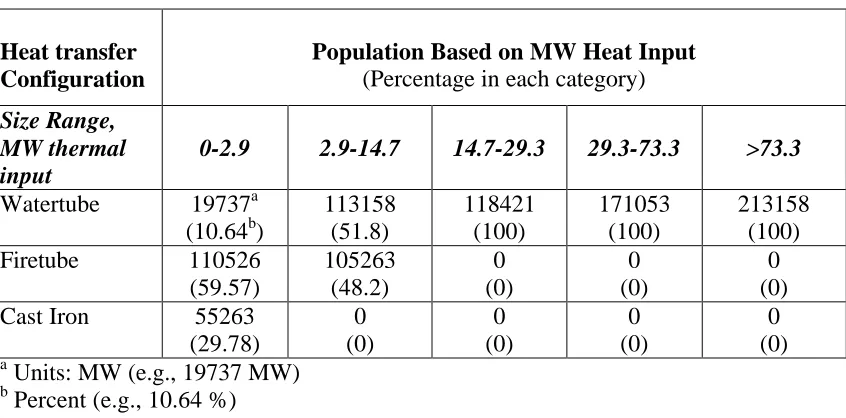
Table 2-1 shows the population distribution for industrial boilers in the U.S. by design type in 1982 (U.S. EPA, 1982). Table 2-2 shows the relative distribution by capacity. As evident from Table 2-2, watertube boilers are available over a larger size range than the other types.
Table 2-1. Boiler Population Distribution by Heat-transfer Configuration
Total Boiler Capacity Heat-transfer
Configuration
MW Thermal Input Percent of Total
Table 2-2. Relative Distribution by Capacity of the Three Types of Industrial Boilers
Heat transfer Configuration
Population Based on MW Heat Input (Percentage in each category)
Size Range, MW thermal input
0-2.9 2.9-14.7 14.7-29.3 29.3-73.3 >73.3
Watertube 19737a (10.64b)
113158 (51.8) 118421 (100) 171053 (100) 213158 (100) Firetube 110526
(59.57) 105263 (48.2) 0 (0) 0 (0) 0 (0) Cast Iron 55263
(29.78) 0 (0) 0 (0) 0 (0) 0 (0) a
Units: MW (e.g., 19737 MW) b
Percent (e.g., 10.64 %)
For low pressure to medium pressure steam generation, the heat-input rate of a process boiler is typically in the range of 2.9 MWt to 29.3 MWt heat input to the boiler (U.S. EPA, 1982). In this range, overall installed capacity (in MWt thermal input) of watertube boilers in US fairly exceeds the installed capacity of firetube or cast iron boilers, which are used for relatively small steam demand (U.S. EPA, 1982). Furthermore watertube boilers are structurally more stable to variations in steam demand than firetube boilers (U.S. EPA, 1998). Thus, watertube boilers are chosen as representative boilers for the generation of an LCI of steam in a process industry.
2.2 System Boundaries and Design Basis
(Gonzalez and Overcash, 1999). LCI parameters associated with removal of other trace impurities and contaminants from BFW are insignificant, and are not considered (Gonzalez and Overcash, 1999).
One Mega-joule (MJ) of steam produced has been used as a basis for the calculation of LCI parameters. It is assumed that saturated steam at 100 psia is generated from water entering the boiler at 50oC. Raw water is typically available at 20 oC. During BFW treatment, the raw water is heated to 50 oC for the removal of dissolved gases to avoid boiler corrosion (Nunn, 1997). The energy used in raising a kg of water from 20 oC to 50 oC is less than five percent of the energy carried by a kg of 100-psia saturated steam produced, therefore, the energy associated with BFW treatment is neglected.
The amount of saturated steam generated at 100-psia is calculated to be 0.392 kg for 1 MJ steam demand using Equation (2-1).
) ( v l
Steam Steam
h h
H m
− ∆
= (2-1)
where: mSteam = Mass of steam produced (kg)
changing pressure, there is almost no effect on the overall LCI of steam. Thus only the enthalpy associated with steam is required to determine the LCI associated with steam use in a process.
The emissions from a fuel-fired boiler depend on fuel type, fuel composition, boiler type, boiler heat rate, and combustion efficiency. As explained in the previous section, a watertube boiler was selected as a model boiler for the development of an LCI for steam.
Table 2-3. Percentage of Installed Capacity of Various Fuel Type Watertube Boilers in 2.9 MWt to 29.3 MWt Heat-input Category (U.S. EPA, 1982)
Fuel Type Percentage of Watertube Boilers
Pulverized coal 0
Spreader-stoker coal 4.2
Underfeed-stoker coal 12.16
COAL
Overfeed-stoker coal 3.07
Residual Oil 32.49
OIL
Distillate Oil 4.87
NATURAL GAS 43.21
Total 100.00
Table 2-4. Ultimate Analysis and Heating Values of Fuels Used in Developing the Emission Factors (Pechtl and Chen, 1992; Perry, 1997; U.S. EPA, 1982)
Fuel Coal
(Bituminous)
Distillate Oil (No. 2)
Residual Oil (No.6, Low sulfur)
Natural Gas
Element Wt% Wt% Wt% Wt%
C 73.21 87.3 87.26 69.28
H 4.94 12.6 10.49 22.67
N 1.38 0.006 0.28 8.05
O 4.85 0.04 0.64 Trace
S 3.3 0.22 0.84 Trace
Ash 12.23 Trace 0.04 0
Cl 0.09 - - -
Heating Value 12350 Btu/lb 19500 Btu/lb 18500 Btu/lb 1020 Btu/ft3
Table 2-5 presents the regulatory emission limits, as reported in Code of Federal Regulations (CFR, 1999), for steam generating units that commenced construction, modification, or reconstruction after June 9, 1989 and have a heat input capacity from fuels combusted in the steam generating unit of 2.9 to 29 MWt (10 to 100 million Btu/hour).
Table 2-5. Code of Federal Regulations Emissions Limit for Boilers Heat Rate in the Range of 2.9 MWt to 29 MWt (from 40 CFR Part 60 – As revised on July 1999)
Fuel Type
SO2
ng/J (lb/106 Btu)
PM ng/J (lb/106 Btu
Overfeed stoker coal 520 (1.2) 22 (0.05)
Spreader stoker coal 520 (1.2) 22 (0.05)
Pulverized coal 520 (1.2) 22 (0.05)
Underfeed stoker coal 520 (1.2) 22 (0.05)
Distillate Oil 215 (0.5) -a
Residual Oil 215 (0.5) -a
Natural Gas - -a
a
Standard applies when gas or oil is fired in combination with coal (40 CFR Part 60, subpart Dc)
fired and distillate oil fired boilers. NOx control technology used for stoker coal fired boilers is low excess air (LEA) technology. Spray dryer is used for the removal of acid gases generated by low and medium sulfur fuels fired in steam generating industrial boilers (U.S. EPA, 1998). Typical control efficiency of SO2 in a spray dryer ranges from 70 to 90 percent. A low NOx burner is a combustion modification technique commonly used for controlling the NOx emissions in steam generating boilers. Low NOx burner has a NOx reduction potential ranging from 35 to 55 percent. LEA technology typically has NOx reduction potential of 25 percent for coal fired stoker boilers (U.S. EPA, 1998). Fabric filters are commonly used for the removal of PM with a typical removal efficiency ranging from 99 to 99.9 percent. After APC, the flue gas is released to the atmosphere.
The LCI parameters considered includes gaseous and liquid releases as well as solid waste. Although it is assumed that there are no water releases or solid waste production other than ash, these parameters are included because such releases are associated with the fuel pre-combustion emissions, LCI of BFW pretreatment and that of materials consumed in APC equipment.
One hundred percent hardness removal efficiency is assumed in calculations. The regenerant for the ion exchange resin is sodium chloride.
2.3 Calculation of the LCI of Steam
The LCI of steam considers the emission associated with generation of steam from various boilers based on fuel types, pre-combustion emissions associated with fuels, the LCI of sodium chloride used in BFW pretreatment, and the LCI of lime used in spray drying for the removal of acid gases. The overall LCI parameters considered include PM, PM-10, SO2, SO3, NOx, CO, CO2, CH4, HCl, VOCs, hydrocarbons, NH3, 12 metals, liquid emissions and solid waste. The methodology used to calculate and allocate emissions is described in this section.
2.3.1 Pre-combustion Emissions from the Fuels Fired
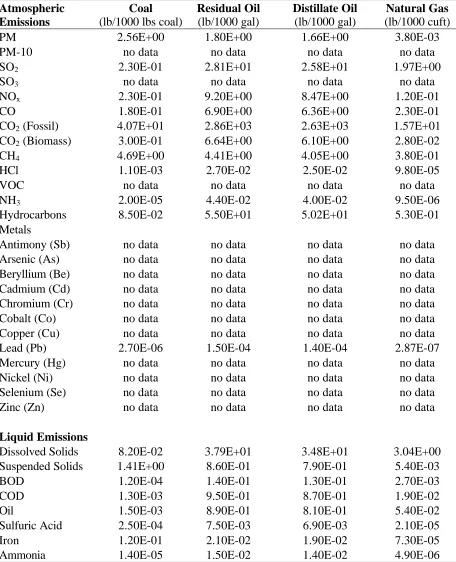
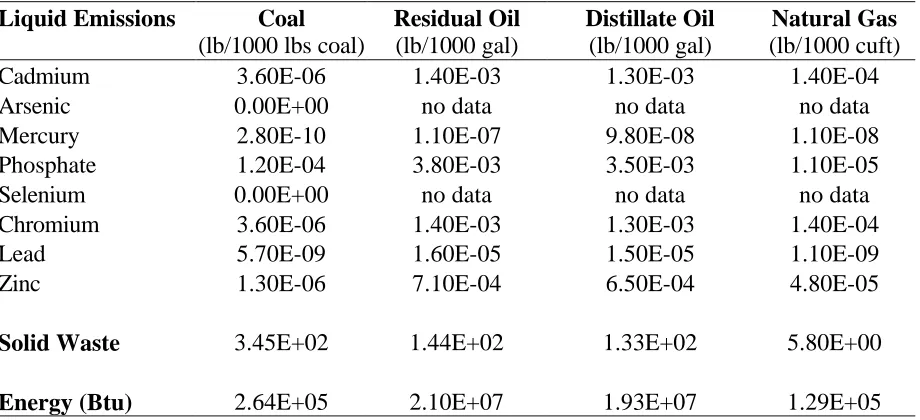
Pre-combustion emissions in the units of lb per 1000 units of fuel (lbs. for coal, gals. for distillate and residual oil, and standard cuft. for natural gas) are presented in Table 2-6 (Dumas, 1998). Knowing these emission factors, heating values of fuels in consideration and total enthalpy of steam produced (1 MJ), the emission factors per MJ of steam can be calculated as follows:
1000 Steam j
i i
H x HV
EF
E ∆
EFi = Emission factor of pollutant ‘i’ (lb/1000 fuel units) HVj = Heating value of the fuel (Btu/fuel unit)
Fuel unit = lb for coal, gal for residual and distillate oil, and standard. cuft. for natural gas
∆HSteam = 1 MJ (in Btu’s)
Table 2-6. Pre-Combustion Emissions per 1000 Units of Fuel (Dumas, 1998)
Atmospheric Emissions
Coal (lb/1000 lbs coal)
Residual Oil (lb/1000 gal) Distillate Oil (lb/1000 gal) Natural Gas (lb/1000 cuft)
PM 2.56E+00 1.80E+00 1.66E+00 3.80E-03
PM-10 no data no data no data no data
SO2 2.30E-01 2.81E+01 2.58E+01 1.97E+00
SO3 no data no data no data no data
NOx 2.30E-01 9.20E+00 8.47E+00 1.20E-01
CO 1.80E-01 6.90E+00 6.36E+00 2.30E-01
CO2 (Fossil) 4.07E+01 2.86E+03 2.63E+03 1.57E+01
CO2 (Biomass) 3.00E-01 6.64E+00 6.10E+00 2.80E-02
CH4 4.69E+00 4.41E+00 4.05E+00 3.80E-01
HCl 1.10E-03 2.70E-02 2.50E-02 9.80E-05
VOC no data no data no data no data
NH3 2.00E-05 4.40E-02 4.00E-02 9.50E-06
Hydrocarbons 8.50E-02 5.50E+01 5.02E+01 5.30E-01
Metals
Antimony (Sb) no data no data no data no data
Arsenic (As) no data no data no data no data
Beryllium (Be) no data no data no data no data
Cadmium (Cd) no data no data no data no data
Chromium (Cr) no data no data no data no data
Cobalt (Co) no data no data no data no data
Copper (Cu) no data no data no data no data
Lead (Pb) 2.70E-06 1.50E-04 1.40E-04 2.87E-07
Mercury (Hg) no data no data no data no data
Nickel (Ni) no data no data no data no data
Selenium (Se) no data no data no data no data
Zinc (Zn) no data no data no data no data
Liquid Emissions
Dissolved Solids 8.20E-02 3.79E+01 3.48E+01 3.04E+00 Suspended Solids 1.41E+00 8.60E-01 7.90E-01 5.40E-03
BOD 1.20E-04 1.40E-01 1.30E-01 2.70E-03
COD 1.30E-03 9.50E-01 8.70E-01 1.90E-02
Oil 1.50E-03 8.90E-01 8.10E-01 5.40E-02
Sulfuric Acid 2.50E-04 7.50E-03 6.90E-03 2.10E-05
Iron 1.20E-01 2.10E-02 1.90E-02 7.30E-05
Table 2-6 continued
Liquid Emissions Coal (lb/1000 lbs coal)
Residual Oil (lb/1000 gal)
Distillate Oil (lb/1000 gal)
Natural Gas (lb/1000 cuft)
Cadmium 3.60E-06 1.40E-03 1.30E-03 1.40E-04
Arsenic 0.00E+00 no data no data no data
Mercury 2.80E-10 1.10E-07 9.80E-08 1.10E-08
Phosphate 1.20E-04 3.80E-03 3.50E-03 1.10E-05
Selenium 0.00E+00 no data no data no data
Chromium 3.60E-06 1.40E-03 1.30E-03 1.40E-04
Lead 5.70E-09 1.60E-05 1.50E-05 1.10E-09
Zinc 1.30E-06 7.10E-04 6.50E-04 4.80E-05
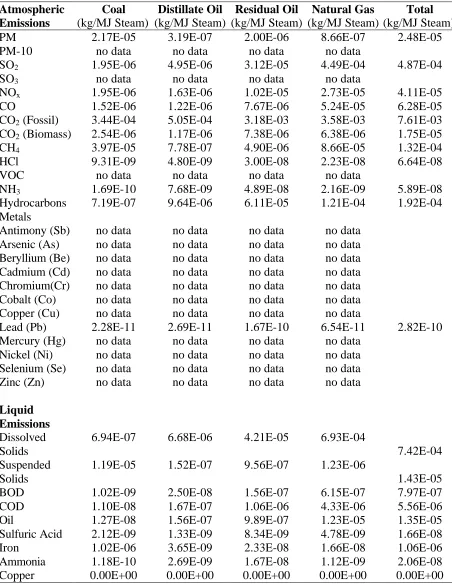
Table 2-7. Pre-Combustion Emissions for 1 MJ of Steam Produceda Atmospheric Emissions Coal (kg/MJ Steam) Distillate Oil (kg/MJ Steam) Residual Oil (kg/MJ Steam) Natural Gas (kg/MJ Steam) Total (kg/MJ Steam)
PM 2.17E-05 3.19E-07 2.00E-06 8.66E-07 2.48E-05
PM-10 no data no data no data no data
SO2 1.95E-06 4.95E-06 3.12E-05 4.49E-04 4.87E-04
SO3 no data no data no data no data
NOx 1.95E-06 1.63E-06 1.02E-05 2.73E-05 4.11E-05
CO 1.52E-06 1.22E-06 7.67E-06 5.24E-05 6.28E-05
CO2 (Fossil) 3.44E-04 5.05E-04 3.18E-03 3.58E-03 7.61E-03 CO2 (Biomass) 2.54E-06 1.17E-06 7.38E-06 6.38E-06 1.75E-05
CH4 3.97E-05 7.78E-07 4.90E-06 8.66E-05 1.32E-04
HCl 9.31E-09 4.80E-09 3.00E-08 2.23E-08 6.64E-08
VOC no data no data no data no data
NH3 1.69E-10 7.68E-09 4.89E-08 2.16E-09 5.89E-08
Hydrocarbons 7.19E-07 9.64E-06 6.11E-05 1.21E-04 1.92E-04 Metals
Antimony (Sb) no data no data no data no data Arsenic (As) no data no data no data no data Beryllium (Be) no data no data no data no data Cadmium (Cd) no data no data no data no data Chromium(Cr) no data no data no data no data Cobalt (Co) no data no data no data no data Copper (Cu) no data no data no data no data
Lead (Pb) 2.28E-11 2.69E-11 1.67E-10 6.54E-11 2.82E-10 Mercury (Hg) no data no data no data no data
Nickel (Ni) no data no data no data no data Selenium (Se) no data no data no data no data
Zinc (Zn) no data no data no data no data
Liquid Emissions Dissolved Solids
6.94E-07 6.68E-06 4.21E-05 6.93E-04
7.42E-04 Suspended
Solids
1.19E-05 1.52E-07 9.56E-07 1.23E-06
1.43E-05
BOD 1.02E-09 2.50E-08 1.56E-07 6.15E-07 7.97E-07
COD 1.10E-08 1.67E-07 1.06E-06 4.33E-06 5.56E-06
Oil 1.27E-08 1.56E-07 9.89E-07 1.23E-05 1.35E-05
Sulfuric Acid 2.12E-09 1.33E-09 8.34E-09 4.78E-09 1.66E-08
Iron 1.02E-06 3.65E-09 2.33E-08 1.66E-08 1.06E-06
Table 2-7 continued Liquid
Emissions
Coal (kg/MJ Steam)
Distillate Oil (kg/MJ Steam)
Residual Oil (kg/MJ Steam)
Natural Gas (kg/MJ Steam)
Total (kg/MJ Steam)
Arsenic 0.00E+00 no data no data no data
Mercury 2.37E-15 1.88E-14 1.22E-13 2.51E-12 2.65E-12 Phosphate 1.02E-09 6.72E-10 4.22E-09 2.51E-09 8.42E-09
Selenium 0.00E+00 no data no data no data
Chromium 3.05E-11 2.50E-10 1.56E-09 3.19E-08 3.37E-08
Lead 4.82E-14 2.88E-12 1.78E-11 2.51E-13 2.10E-11
Zinc 1.10E-11 1.25E-10 7.89E-10 1.09E-08 1.19E-08
Solid Waste 2.92E-03 2.55E-05 1.60E-04 1.32E-03 4.43E-03 Energy (MJ)B 5.19E-03 8.61E-03 5.42E-02 6.83E-02 1.36E-01 a
2.3.2 Combustion of Coal to Generate Steam
This section presents the emission factors of various pollutants associated with the combustion of coal for the generation of steam in various types of boilers. Four types of coal fired boilers, namely pulverized coal wall fired (dry bottom), spreader stoker, overfeed stoker and underfeed stoker boilers are considered. The boilers are assumed to fire bituminous coal (Bituminous high volatile – A), which is mainly used for the generation of steam in industrial boilers (U.S. EPA, 1998). A typical ultimate analysis of Bituminous coal is presented in Table 2-4. Thermal efficiency of these boilers is assumed to be 80 percent, which is typical of coal fired boilers (U.S. EPA, 1982). AP-42 lists the uncontrolled emission factors of PM, SO2, CO, NOx, CO2, CH4 and HCl in the units of lb per ton of coal combusted for various boiler configurations firing bituminous coal. It also lists the controlled emissions for 12 metals.
Emission control factors are applied to uncontrolled SO2, NOx, and PM emission factors. Emission control factors, defined by Equation (2-3), are the factors based on control efficiency of APC by which uncontrolled emission factors are multiplied to get controlled emission factors.
− =
100
1 i
i
ECF η (2-3)
where: ECFi = Emission control factor
ηi = Control Efficiency of APC equipment (e.g., 90 percent removal for SO2)
i. = Pollutant (e.g., SO2, NOx, etc.)
Table 2-8. Emission Factors of Various Pollutants After APC for Different Coal Fired Boilers Firing Bituminous Coal
Air Emissions Pulverized Coal (lb/MMBtu input)
Spreader stoker (lb/MMBtu input)
Overfeed Stoker (lb/MMBtu input)
Underfeed Stoker (lb/MMBtu input)
PM 4.95E-02 2.67E-02 6.48E-03 6.07E-03
PM-10 1.14E-02 5.34E-03 2.43E-03 2.51E-03
SO2 5.08E-01 5.08E-01 5.08E-01 4.14E-01
SO3 no data no data no data no data
NOx 4.45E-01 3.34E-01 2.28E-01 2.88E-01
CO 2.02E-02 2.02E-01 2.43E-01 4.45E-01
CO2 (Fossil) 2.15E+02 2.15E+02 2.15E+02 2.15E+02
CO2 (Biomass) no data no data no data no data
CH4 1.62E-03 2.43E-03 2.43E-03 3.24E-02
HCl 2.43E-03 2.43E-03 2.43E-03 2.43E-03
VOC no data no data no data no data
NH3 no data no data no data no data
Hydrocarbons no data no data no data no data
METALS
Antimony (Sb) 7.29E-07 7.29E-07 7.29E-07 7.29E-07
Arsenic (As) 1.66E-05 1.66E-05 1.66E-05 1.66E-05
Beryllium (Be) 8.50E-07 8.50E-07 8.50E-07 8.50E-07
Cadmium (Cd) 2.06E-06 2.06E-06 2.06E-06 2.06E-06
Chromium (Cr) 1.05E-05 1.05E-05 1.05E-05 1.05E-05
Cobalt (Co) 4.05E-06 4.05E-06 4.05E-06 4.05E-06
Copper (Cu) no data no data no data no data
Lead (Pb) 1.70E-05 1.70E-05 1.70E-05 1.70E-05
Mercury (Hg) 3.36E-06 3.36E-06 3.36E-06 3.36E-06
Nickel (Ni) 1.13E-05 1.13E-05 1.13E-05 1.13E-05
Selenium (Se) 5.26E-05 5.26E-05 5.26E-05 5.26E-05
Zinc (Zn) no data no data no data no data
2.3.3 Combustion of Fuel Oil for the Generation of Steam
This section presents the emission factors of various pollutants associated with the combustion of fuel oil for the generation of steam in a boiler. Two major categories of fuel oils are burned in steam generating boilers: distillate oils and residual oils. These oils are further distinguished by grade numbers, with Numbers 1 and 2 being distillate oils and Numbers 5 and 6 being residual oils. Number 2 oil is chosen to represent the distillate oils and low sulfur Number 6 is chosen to represent the residual oil for LCI purpose since they represent the distillate and residual oils, respectively, most commonly used in industry (U.S. EPA, 1998). Typical ultimate analyses of distillate and residual oils are presented in Table 2-4. Thermal efficiency of distillate oil fired boiler is assumed to be 80 percent for steam generation and that of residual oil fired boiler is assumed to be 85 percent (U.S. EPA, 1982). AP-42 lists the uncontrolled emission factors of PM, SO2, CO, NOx, CO2, CH4, HCl, and 12 metals in units of lb per 1000 gallons of fuel combusted for boilers burning distillate oil and residual oil.
Low NOx burner control technique is assumed to control 50 percent of NOx, both in case of distillate and residual oil (U.S. EPA, 1998). A bag filter with 99 percent PM removal efficiency is assumed as is typical of bag filters (U.S. EPA, 1998).
Table 2-9. Emission Factors for Various Pollutants After APC Equipment for Distillate and Residual Oil Fired Industrial Boilers
Air Emissions Distillate Oil (lb/MMBtu input)
Residual Oil (lb/MMBtu input)
PM 1.47E-04 7.39E-04
PM-10 3.08E-05 6.64E-05
SO2 2.29E-02 8.91E-02
SO3 3.22E-04 1.13E-03
NOx 7.33E-02 1.86E-01
CO 3.66E-02 3.38E-02
CO2 (Fossil) 1.58E+02 1.65E+02
CO2 (Biomass) no data no data
CH4 3.81E-04 6.76E-03
HCl no data no data
VOC no data no data
NH3 no data no data
Hydrocarbons no data no data
METALS
Antimony (Sb) no data 3.55E-07
Arsenic (As) 4.00E-08 8.92E-08
Beryllium (Be) 3.00E-08 1.88E-09
Cadmium (Cd) 3.00E-08 2.69E-08
Chromium (Cr) 3.00E-08 5.71E-08
Cobalt (Co) no data 4.07E-07
Copper (Cu) 6.00E-08 1.19E-07
Lead (Pb) 9.01E-08 1.02E-07
Mercury (Hg) 3.00E-08 7.63E-09
Nickel (Ni) 3.00E-08 5.71E-06
Selenium (Se) 1.50E-07 4.61E-08
Zinc (Zn) 4.00E-08 1.97E-06
Solid waste 0.00E+00a 0.00E+00a
a
2.3.4 Combustion of Natural Gas for Generation of Steam
Table 2-10. Emission Factors for Various Pollutants After APC Equipment for Natural Gas fired Industrial Boilers
Air Emissions Natural Gas (lb/MMBtu input)
PM 7.73E-03
PM-10 no data
SO2 6.10E-04
SO3 no data
NOx 5.09E-02
CO 8.54E-02
CO2 (Fossil) 1.22E+02
CO2 (Biomass) no data
CH4 2.34E-03
HCl no data
VOC 5.59E-03
NH3 no data
Hydrocarbons no data
METALS
Antimony (Sb) no data
Arsenic (As) 2.03E-09
Beryllium (Be) 1.22E-10
Cadmium (Cd) 1.12E-08
Chromium (Cr) 1.42E-08
Cobalt (Co) 8.54E-10
Copper (Cu) 8.65E-09
Lead (Pb) 5.09E-09
Mercury (Hg) 2.64E-09
Nickel (Ni) 2.14E-08
Selenium (Se) 2.44E-10
2.3.5 Overall Weighted Emission Factors from Boilers Generating Steam
As described in Section 2.2, the total enthalpy carried by steam was allocated to various boiler types based on the percentage of installed boiler capacity given in Table 2-3. The respective boiler heat inputs are then calculated by dividing the above-allocated enthalpy by the boiler efficiency as described by Equation (2-4). Table 2-12 presents the heat input to each boiler type.
j Boiler
j Allocated j
Boiler
H H
, , ,
η
= (2-4)
where: HBoiler, j = Heat input to boiler ‘j’ (J/MJ steam)
HAllocated, j = Enthalpy allocated to boiler ‘j’ based on the boiler percentage (J/MJ steam)
ηBoiler, j = Boiler thermal efficiency (fraction)
Finally, a particular emission for respective boiler types is calculated (Equation 2-5) and summed across.
j Boiler i
i EF H
E = ⋅ , (2-5)
where: Ei = Emission of pollutant ‘j’ per MJ steam produced (kg/MJ steam) EFi = Emission factor of pollutant ‘j’ per J heat input (kg/J)
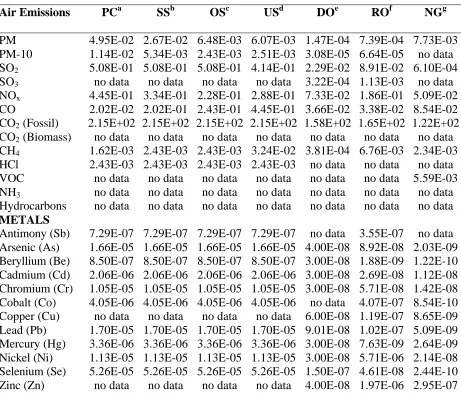
Table 2-11. Emissions from Various Boilers (units: lb/MMBtu heat input).
Air Emissions PCa SSb OSc USd DOe ROf NGg
PM 4.95E-02 2.67E-02 6.48E-03 6.07E-03 1.47E-04 7.39E-04 7.73E-03 PM-10 1.14E-02 5.34E-03 2.43E-03 2.51E-03 3.08E-05 6.64E-05 no data SO2 5.08E-01 5.08E-01 5.08E-01 4.14E-01 2.29E-02 8.91E-02 6.10E-04 SO3 no data no data no data no data 3.22E-04 1.13E-03 no data NOx 4.45E-01 3.34E-01 2.28E-01 2.88E-01 7.33E-02 1.86E-01 5.09E-02 CO 2.02E-02 2.02E-01 2.43E-01 4.45E-01 3.66E-02 3.38E-02 8.54E-02 CO2 (Fossil) 2.15E+02 2.15E+02 2.15E+02 2.15E+02 1.58E+02 1.65E+02 1.22E+02 CO2 (Biomass) no data no data no data no data no data no data no data CH4 1.62E-03 2.43E-03 2.43E-03 3.24E-02 3.81E-04 6.76E-03 2.34E-03 HCl 2.43E-03 2.43E-03 2.43E-03 2.43E-03 no data no data no data VOC no data no data no data no data no data no data 5.59E-03 NH3 no data no data no data no data no data no data no data Hydrocarbons no data no data no data no data no data no data no data METALS
Antimony (Sb) 7.29E-07 7.29E-07 7.29E-07 7.29E-07 no data 3.55E-07 no data Arsenic (As) 1.66E-05 1.66E-05 1.66E-05 1.66E-05 4.00E-08 8.92E-08 2.03E-09 Beryllium (Be) 8.50E-07 8.50E-07 8.50E-07 8.50E-07 3.00E-08 1.88E-09 1.22E-10 Cadmium (Cd) 2.06E-06 2.06E-06 2.06E-06 2.06E-06 3.00E-08 2.69E-08 1.12E-08 Chromium (Cr) 1.05E-05 1.05E-05 1.05E-05 1.05E-05 3.00E-08 5.71E-08 1.42E-08 Cobalt (Co) 4.05E-06 4.05E-06 4.05E-06 4.05E-06 no data 4.07E-07 8.54E-10 Copper (Cu) no data no data no data no data 6.00E-08 1.19E-07 8.65E-09 Lead (Pb) 1.70E-05 1.70E-05 1.70E-05 1.70E-05 9.01E-08 1.02E-07 5.09E-09 Mercury (Hg) 3.36E-06 3.36E-06 3.36E-06 3.36E-06 3.00E-08 7.63E-09 2.64E-09 Nickel (Ni) 1.13E-05 1.13E-05 1.13E-05 1.13E-05 3.00E-08 5.71E-06 2.14E-08 Selenium (Se) 5.26E-05 5.26E-05 5.26E-05 5.26E-05 1.50E-07 4.61E-08 2.44E-10 Zinc (Zn) no data no data no data no data 4.00E-08 1.97E-06 2.95E-07 Solid Waste 9.81E+00 9.81E+00 9.81E+00 9.81E+00 0.00E+00 0.00E+00 0.00E+00 a
PC: Pulverized coal wall fired (dry bottom) boiler b
SS: Spreader stoker coal fired boiler c
OS: Overfeed stoker coal fired boiler d
US: Underfeed stoker coal fired boiler e
DO: Distillate oil fired boiler f
RO: Residual oil fired boiler g
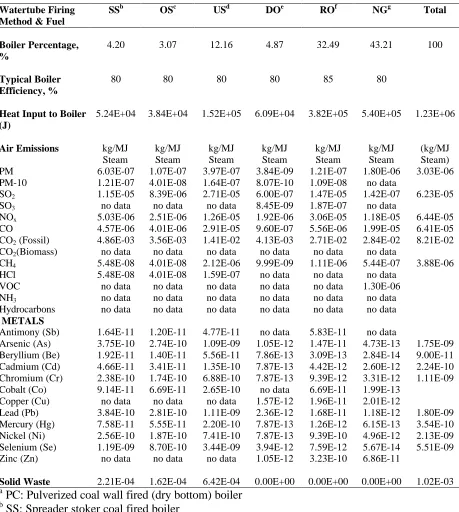
Table 2-12. Emissions From Various Boilers Based on Steam Allocation for the Production of 1 MJ Steam (units: kg/MJ Steam Produced).
a
PC: Pulverized coal wall fired (dry bottom) boiler b
SS: Spreader stoker coal fired boiler c
OS: Overfeed stoker coal fired boiler d
US: Underfeed stoker coal fired boiler e
DO: Distillate oil fired boiler f
Watertube Firing Method & Fuel
SSb OSc USd DOe ROf NGg Total
Boiler Percentage, %
4.20 3.07 12.16 4.87 32.49 43.21 100
Typical Boiler Efficiency, %
80 80 80 80 85 80
Heat Input to Boiler (J)
5.24E+04 3.84E+04 1.52E+05 6.09E+04 3.82E+05 5.40E+05 1.23E+06
Air Emissions kg/MJ
Steam kg/MJ Steam kg/MJ Steam kg/MJ Steam kg/MJ Steam kg/MJ Steam (kg/MJ Steam)
PM 6.03E-07 1.07E-07 3.97E-07 3.84E-09 1.21E-07 1.80E-06 3.03E-06
PM-10 1.21E-07 4.01E-08 1.64E-07 8.07E-10 1.09E-08 no data
SO2 1.15E-05 8.39E-06 2.71E-05 6.00E-07 1.47E-05 1.42E-07 6.23E-05
SO3 no data no data no data 8.45E-09 1.87E-07 no data
NOx 5.03E-06 2.51E-06 1.26E-05 1.92E-06 3.06E-05 1.18E-05 6.44E-05
CO 4.57E-06 4.01E-06 2.91E-05 9.60E-07 5.56E-06 1.99E-05 6.41E-05
CO2 (Fossil) 4.86E-03 3.56E-03 1.41E-02 4.13E-03 2.71E-02 2.84E-02 8.21E-02
CO2(Biomass) no data no data no data no data no data no data
CH4 5.48E-08 4.01E-08 2.12E-06 9.99E-09 1.11E-06 5.44E-07 3.88E-06
HCl 5.48E-08 4.01E-08 1.59E-07 no data no data no data
VOC no data no data no data no data no data 1.30E-06
NH3 no data no data no data no data no data no data
Hydrocarbons no data no data no data no data no data no data
METALS
Antimony (Sb) 1.64E-11 1.20E-11 4.77E-11 no data 5.83E-11 no data
Arsenic (As) 3.75E-10 2.74E-10 1.09E-09 1.05E-12 1.47E-11 4.73E-13 1.75E-09
Beryllium (Be) 1.92E-11 1.40E-11 5.56E-11 7.86E-13 3.09E-13 2.84E-14 9.00E-11
Cadmium (Cd) 4.66E-11 3.41E-11 1.35E-10 7.87E-13 4.42E-12 2.60E-12 2.24E-10
Chromium (Cr) 2.38E-10 1.74E-10 6.88E-10 7.87E-13 9.39E-12 3.31E-12 1.11E-09
Cobalt (Co) 9.14E-11 6.69E-11 2.65E-10 no data 6.69E-11 1.99E-13
Copper (Cu) no data no data no data 1.57E-12 1.96E-11 2.01E-12
Lead (Pb) 3.84E-10 2.81E-10 1.11E-09 2.36E-12 1.68E-11 1.18E-12 1.80E-09
Mercury (Hg) 7.58E-11 5.55E-11 2.20E-10 7.87E-13 1.26E-12 6.15E-13 3.54E-10
Nickel (Ni) 2.56E-10 1.87E-10 7.41E-10 7.87E-13 9.39E-10 4.96E-12 2.13E-09
Selenium (Se) 1.19E-09 8.70E-10 3.44E-09 3.94E-12 7.59E-12 5.67E-14 5.51E-09
Zinc (Zn) no data no data no data 1.05E-12 3.23E-10 6.86E-11
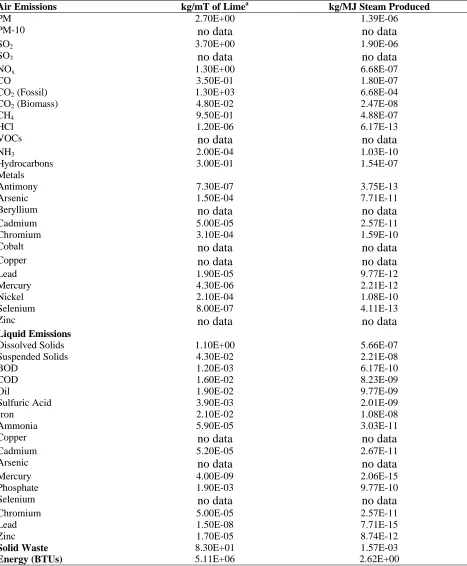
2.3.6 LCI of Lime consumed for the Removal of SO2 in a Spray Dryer
In lime spray drying, a lime slurry is sprayed into the absorption tower, and SO2 is absorbed by the slurry, forming CaSO3/CaSO4. However, the liquid-to-gas ratio is such that the water in the slurry evaporates before the slurry droplets reach the bottom of the tower. The following equations represent the chemistry of lime spray drying process (Cooper and Alley, 1994):
CaO + H2O → Ca (OH)2 (2-6) SO2 + H2O ↔ H2SO3 (2-7) H2SO3 + Ca (OH)2 → CaSO3⋅2H2O (2-8) CaSO3⋅2H2O + ½ O2→ CaSO4⋅2H2O (2-9)
The overall equation therefore is:
CaO + SO2 + ½ O2 + 2H2O → CaSO4⋅2H2O (2-10)
Table 2-13. LCI of Lime Associated with Removal of SO2 for 1MJ Steam
Production
Air Emissions kg/mT of Limea kg/MJ Steam Produced
PM 2.70E+00 1.39E-06
PM-10 no data no data
SO2 3.70E+00 1.90E-06
SO3 no data no data
NOx 1.30E+00 6.68E-07
CO 3.50E-01 1.80E-07
CO2 (Fossil) 1.30E+03 6.68E-04
CO2 (Biomass) 4.80E-02 2.47E-08
CH4 9.50E-01 4.88E-07
HCl 1.20E-06 6.17E-13
VOCs no data no data
NH3 2.00E-04 1.03E-10
Hydrocarbons 3.00E-01 1.54E-07
Metals
Antimony 7.30E-07 3.75E-13
Arsenic 1.50E-04 7.71E-11
Beryllium no data no data
Cadmium 5.00E-05 2.57E-11
Chromium 3.10E-04 1.59E-10
Cobalt no data no data
Copper no data no data
Lead 1.90E-05 9.77E-12
Mercury 4.30E-06 2.21E-12
Nickel 2.10E-04 1.08E-10
Selenium 8.00E-07 4.11E-13
Zinc no data no data
Liquid Emissions
Dissolved Solids 1.10E+00 5.66E-07
Suspended Solids 4.30E-02 2.21E-08
BOD 1.20E-03 6.17E-10
COD 1.60E-02 8.23E-09
Oil 1.90E-02 9.77E-09
Sulfuric Acid 3.90E-03 2.01E-09
Iron 2.10E-02 1.08E-08
Ammonia 5.90E-05 3.03E-11
Copper no data no data
Cadmium 5.20E-05 2.67E-11
Arsenic no data no data
Mercury 4.00E-09 2.06E-15
Phosphate 1.90E-03 9.77E-10
Selenium no data no data
Chromium 5.00E-05 2.57E-11
Lead 1.50E-08 7.71E-15
2.3.7 LCI Associated with Boiler Feed Water (BFW) Pretreatment
For the LCI of BFW conditioning, ionic exchange pretreatment is considered. Calcium and magnesium hardness can be removed by passing the water through a bed of resin mixed with a natural mineral known as zeolite enabling the calcium or aluminum base to be exchanged for sodium (Nunn, 1997):
CaCl2 + Na2Z (zeolite) → CaZ + 2 NaCl (2-11)
As a result of the above reaction, calcium and magnesium ions become bound and the sodium ions are solubilized. The ion exchange reaction is nonselective and will remove any soluble cations, including iron and manganese, and will remove noncarbonate hardness as well as carbonate hardness. When the exchange material becomes depleted of sodium ions, no further exchange of cations can occur until the bound cations are replaced with sodium ions. The exchange material can be regenerated by contact with brine solution according to the following reaction:
CaZ + 2 NaCl → Na2Z (regenerated zeolite) + CaCl2 (2-12)
A total hardness of 100 mg Ca2+/liter and 155 mg Mg2+/ liter was assumed in the water to be pretreated. One hundred percent hardness removal efficiency is assumed in calculations. Because ion exchange resin is regenerated, its replacement is ignored in the life cycle inventory. Based on the above assumptions, 555 mg of NaCl is required per liter of water treated. In addition, 4.92 g of sludge (consisting of 5.6 % w/w of CaCl2 and 4.4 % w/w of MgCl2) are produced per liter of water treated. The LCI of sodium chloride is presented in Table 2-14 (Gonzalez and Overcash, 2000).
It is assumed that saturated steam at 100 psia is generated from water entering the boiler at 50oC. Amount of saturated steam at 100-psia was calculated to be 0.392 kg (Equation 2-1) for the 1 MJ steam, which is the basis of the LCI of steam. Assuming no evaporation losses, the amount of steam generated is equal to the amount of BFW treated and entering the boiler. Since 555 mg of NaCl is required for treating one liter of water, the total NaCl consumption (0.217 gm) can be calculated using Equation 2-13.
1000 '
BFW NaCl NaCl
V m
m = (2-13)
where: mNaCl = Amount of NaCl consumed (gm)
m NaCl = NaCl consumed per liter of BFW treated (= 555 mg/liter)