ABSTRACT
JEONG, KA YEON. Establishment and Stabilization of pH in Container Root Substrate. (Under the direction of Dr. Paul V. Nelson.)
A rapid and accurate method to quantify the acidity of sphagnum peat moss was
developed to establish initial pH of peat-base root substrate within a recommended optimal range. This acid-base titration method can predict the calcite requirements of acidic peat moss for target pH levels ≤ 6.2. To monitor substrate pH during crop production, a
non-destructive system for periodically sampling substrate solution is required. The Rhizon soil moisture sampler (RS) was tested in 1.8L volume pots containing lettuce plants. Significant pH gradients, 6.3 – 5.6 from bottom to top of pot were found. The pH level in a diagonally
oriented RS extract was found to be equivalent to that in the lower 20% of the substrate column. The pH levels of substrate solution extracted by diagonally oriented RS,
pour-though, and saturated media extract methods were found to be 6.2, 6.6, and 5.5, respectively.
The effects of plant species (13 floricultural crops), potential acidity/basicity rating of
fertilizer, and concentration of water soluble fertilizer on substrate pH during crop production were assessed. Petunia, fibrous begonia, and osteospermum were very light acidifier species, pansy, impatiens, New Guinea impatiens, and geranium were light acidifier-species, and
vinca, tomato, and Reiger begonia were medium acidifier-species. These three acidification groups of plants were fertilized at the rate of 100 mg∙L-1
N. Pot mum, sunflower, and
fertilizes tested were acidic and caused a decline in substrate pH whenever plant uptake was low and substrate EC was increasing. Conversely, when a high proportion of the fertilizer
was accumulated by plants, the acidity/basicity rating of the fertilizer was expressed in substrate pH shifts. To establish and stabilize substrate pH, mature dairy cow manure
compost (DMC) was evaluated as a soilless substrate substitute for dolomitic limestone and peat moss. Although pH declined during plant production, the decline was similar for agricultural limestone and the 20 to 30% DMC treatments, indicating that the buffering
capacity was equal for limestone and DMC. All limestone and a portion of peat moss were effectively replaced with DMC. Initial EC levels for DMC substrates were within the
acceptable range for seedlings and bedding plants. End of crop tissue analysis indicated that DMC resulted in higher leaf concentrations of potassium, sulfur, copper, iron, and manganese, lower, but adequate, calcium and magnesium, and similar nitrogen, phosphorus,
boron, and zinc concentrations. The impact of DMC on physical properties of a peat moss-perlite substrate with and without plant growth was evaluated at the beginning and end of a
crop. DMC resulted in increased dry bulk density, but there was no change in dry bulk density between initial and final substrate for each treatment. The total porosity (TP) of all substrates was higher than 84%. Container capacity increased in all substrates over time and
also with DMC addition at the beginning and end of the crop. A significant decrease in air space (AS) was observed with DMC addition in both initial and final substrates. The initial
Establishment and Stabilization of pH in Container Root Substrate
by Ka Yeon Jeong
A dissertation submitted to the Graduate Faculty of North Carolina State University
in partial fulfillment of the requirements for the Degree of
Doctor of Philosophy
Horticultural Science
Raleigh, North Carolina 2010
APPROVED BY:
Dr. Paul V. Nelson Chair of Advisory Committee
Dr. Dean L. Hesterberg Dr. Wei Shi Soil Science Minor Representative
DEDICATION
To my father and mother,
iii
BIOGRAPHY
Although I grew up in Seoul, the biggest city in Korea, I spent my summers in the
beautiful small mountainous town where my grandmother lived. The memories in her flower and vegetable gardens and in nature are still so vivid and beautiful and always make me smile. I believe the power of the beauty of nature and plants can help people have a better
life.
When I was obtaining a Bachelor of Science degree in Biological Resources and
Technology at Yonsei University in Korea, my eyes were opened by the course work related with crop science and soil science. During my junior year, I was selected for an exchange student program at Maryville College in Tennessee. This one year experience encouraged me
to come to the U.S.A. for my graduate study in horticultural science. My education in horticulture started in Ohio where I received my M.S. degree at the Ohio State University
under the direction of Drs. Claudio Pasian and David Tay. My research involved development of cultural recommendations for six begonia species conserved at the
Ornamental Germplasm Center, Columbus, Ohio.
Since 2004, I have worked at the OFA Short Courses as a volunteer in the decoration department and as a monitor during the courses. I met people who are educators, researchers,
growers, and are also working for industries serving horticulture. I experienced a range of aspects of horticulture. That was also the place where I met my advisor, Dr. Paul Nelson for
Nelson at North Carolina State University. The research focused on the development of a system to stabilize substrate pH during crop production and introduction of compost material
as a partial substitute for sphagnum peat moss in soilless substrate for stabilizing pH.
My career goal in horticulture is to connect horticulture and people with my
following motto.
v
ACKNOWLEDGMENTS
I would like to express my gratitude from all my heart to my advisor, Dr. Paul V.
Nelson for his guidance and support. We have done all day- or half day-long meetings for discussions in his office. I could learn what kind of mind and philosophy I should have to be
a good person as well as a successful researcher from him.
I sincerely tank Dr. Dean Hesterberg for his advice and encouragement. I was so much supported and directed by him. Also, his enthusiasm and efforts for teaching and
research are enough to be a role model for my life. I truly appreciate Dr. Brian Whipker and Dr. Wei Shi for all support and vast knowledge to finish this research. I would like to thank Dr. Jonathan Frantz, USDA-ARS Research Horticulturist for funding, advice, and sample
analysis.
I thank for assistance from all horticultural science staff, Diane Mays, Beth Harden,
Ingram McCall, Mark Hardy, Wesley Turner, William Reece for their special help in greenhouses and labs. I would also like to thank Rachel McLaughlin, Kim Eaton, Christie
Gordon, Angela Oldham, and Sandie Wash for their efforts to help me and answer all my questions.
The deepest love and support from my parents and two brothers make it possible to
TABLE OF CONTENTS
LIST OF TABLES ··· viii
LIST OF FIGURES ··· ix
CHAPTER 1. Impact of Composted Dairy Manure on pH management and Physical Properties of Soilless Substrate ··· 1
Abstract ··· 1
Introduction ··· 2
Materials and Methods ··· 3
Results and Discussion ··· 7
Conclusions ··· 10
Literature Cited ··· 12
CHAPTER 2. Predicting Calcite (CaCO3) Requirements of Sphagnum Peat Moss from pH Titration Curves ··· 21
Abstract ··· 21
Introduction ··· 22
Materials and Methods ··· 25
Results and Discussions ··· 31
References ··· 41
CHAPTER 3. Comparison of Rhizon Soil Moisture Sampler, Pour-through, and Saturated Media Extract Extractions of Container Root Substrate ··· 45
Abstract ··· 45
Introduction ··· 46
Materials and Methods ··· 48
Results and Discussion ··· 50
References ··· 60
CHAPTER 4. Impact of 13 Floricultural Crops on Soilless Substrate pH ··· 62
vii
Introduction ··· 63
Materials and Methods ··· 65
Results and Discussions ··· 68
References ··· 75
CHAPTER 5. Fertilizer Acidity/Basicity and Concentration Effect on Substrate pH and EC76 Abstract ··· 76
Introduction ··· 77
Materials and Methods ··· 79
Results and Discussion ··· 80
References ··· 86
CHAPTER 6. Effects of mature dairy manure compost on physical properties in a peat moss:perlite root substrate before and after plant cultivation ··· 88
Abstract ··· 88
Introduction ··· 89
Materials and Methods ··· 91
Results and Discussions ··· 94
LIST OF TABLES
Table 1.1. Total nutrient concentrations in dairy manure compost. ... 14 Table 1.2. Nutrient Concentrations with standard errors (n=5) in chrysanthemum leaves
grown in 0% DMC with lime (Control) and in the substrate with 20% DMC without lime (20% DMC) at the end of Expt. 2 (77days after transplant). ... 15
Table 3. 1 Averaged pH, EC, and solution volume (mean ± standard error, n=5). ... 59
Table 6. 1 Average percentage (± standard error, n=3) of particles size distribution of substrates consisting of 75% of DMC plus peat moss at ratio of 0 to 3, dry weight basis and 25% of perlite at the beginning (initial) and end (final) of plant cultivation.
ix
LIST OF FIGURES
Figure 1.1. Response of initial substrate pH to volumetric quantity of dairy manure compost (DMC) in Expts. 1 and 2. ... 16 Figure 1.2. Substrate pH levels over time in treatments with and without limestone or dairy
cow manure compost (DMC) in Expts. 1 and 2. ... 17 Figure 1.3. Average EC (±standard error, n=5) of substrates containing 0 to 30% dairy cow
manure compost (DMC) in Expt. 1 after transplanting by the pour-through method. .... 18 Figure 1.4. Plant shoot dry weight with increasing dairy cow manure compost (DMC) from 0
to 30% without lime and 0% DMC with lime. ... 19 Figure 1.5. Average substrate physical properties in a 7.6 cm tall column at the beginning and
the end of Expt. 2, including A) dry bulk density (Db), B) total porosity (TP), C)
container capacity (CC), and D) air space (AS). ... 20
Figure 2.1. Acid/base titration curves of sphagnum peat moss from forward- and backward-titrations and the averaged curve. ... 35 Figure 2.2. Predicted CaCO3 requirement based on the acidity of sphagnum peat moss from
the averaged titration curve only. ... 36 Figure 2.3. The pH response curve of sphagnum peat moss as a function of CaCO3 addition.
... 37 Figure 2.4. Comparison between predicted CaCO3 requirement curves based on the acid-base
titration curves of sphagnum peat moss and the effect of added CaCO3 on the pH of sphagnum peat moss. ... 38 Figure 2.5. The pH response of sphagnum peat moss treated with addition of 0, 0.3, 0.6, 0.9,
Figure 3.1. Average substrate pH values with standard error bar (n=15) measured using five horizontally placed Rhizon samplers (H-RS) (-●-) and one diagonally inserted Rhizon sampler (D-RS) (♦) from top to bottom of substrate profile. (a fitting curve equation: y=5.46+exp(-0.23x), R2=0.29) ... 56 Figure 3.2. Average substrate EC values with standard error bar (n=15) measured using five
horizontally placed Rhizon samplers (H-RS) (-●-) and one diagonally inserted Rhizon sampler (D-RS) (♦) from top to bottom of substrate profile. (a fitting curve equation: y=1.09+0.0022exp(0.64x), R2=0.45)... 57 Figure 3.3. Average volume of collected substrate solution with standard error bar (n=15)
measured using five horizontally placed Rhizon samplers (H-RS) (-●-) and one
diagonally inserted Rhizon sampler (D-RS) (♦) from top to bottom of substrate profile. (a fitting curve equation: y=3.63+10.71exp(-0.32x), R2=0.59). ... 58
Figure 4.1. Substrate pH levels measured from 4 to 78 DAT (mean ± standard error, n=5) for 13 species of plants fertilized with neutral reaction fertilizer solution, 17N-2.2P-14.1K. The acidification levels of the thirteen species categorized by the difference (ΔpH) between initial (4 DAT) and final pH (78 DAT) were very light (A, ΔpH<0.50), light (B, ΔpH 0.50-0.99), medium (C, ΔpH 1.00-1.49), and heavy (D, ΔpH 1.5-2.49) acidifier-species. ... 72 Figure 4.2. The averaged substrate pH of four representative species. The ΔpH was
calculated as the difference between initial (3 DAT) and final pH (56 DAT) (mean ± standard error, n=5). Fibrous begonia, New Guinea impatiens, Rieger begonia, and kalanchoe I were fertigated with 100 mg∙L-1 N from neutral water soluble fertilizer solution, 17N-2.2P-14.1K, while kalanchoe II plants were fertigated with the same fertilizer at 200 mg∙L-1
N. ... 73 Figure 4.3. The averaged substrate EC of the four species. Fibrous begonia, New Guinea
impatiens, rieger begonia, and kalanchoe I were fertigated with 100 mg∙L-1
xi
neutral water soluble fertilizer solution, 17N-2.2P-14.1K, while kalanchoe II plants were fertigated with the same fertilizer at 200 mg∙L-1
N. (mean ± standard error, n=5) ... 74
Figure 5.1. Averaged EC of the substrate irrigated with one of the acidic (AF), basic (BF), neutral (NF) fertilizer solutions at either 100 or 200mg∙L-1. (A – 100 mg∙L-1 fertilizer solution of AF (AF100), BF (BF100), and NF (NF100); B – 200mg∙L-1 fertilizer solution of AF (AF200), BF (BF200), and NF (NF200)). (mean ± standard error, n=5) ... 84 Figure 5.2. Averaged pH of root substrate irrigated with one of the acidic (AF), basic (BF), or
neutral (NF) fertilizer solutions at either 100 or 200mg∙L-1
. (A – 100 mg∙L-1 fertilizer solution of AF (AF100), BF (BF100), and NF (NF100); B – 200 mg∙L-1 fertilizer
solution of AF (AF200), BF (BF200), and NF (NF200)). (mean ± standard error, n=5) 85
Figure 6.1. The substrate physical properties in a 7.6 cm tall column at the beginning and the end of plant cultivation, including A) average dry bulk density (Db), B) total porosity (TP), C) container capacity (CC), D) air space (AS), and E) available water (AW) with standard error bar (n=5). ... 98 Figure 6.2. Plant shoot dry weight response to increasing ratio of dairy cow manure compost
CHAPTER 1
Impact of Composted Dairy Manure on pH management and Physical
Properties of Soilless Substrate
Ka Yeon Jeong and Paul Nelson Jonathan Frantz Will Brinton Department of Horticultural Science
Box. 7609
North Carolina State University Raleigh, North Carolina
USA 27695
USDA-ARS-ATRU 2801 W. Bancroft MS 604
Toledo, Ohio USA 43606
Woods End Laboratory 290 Belgrade Road Mt. Vernon, Maine USA 04352
Keywords: bulk density, container capacity, Dendranthema x grandiflora, root media, substrate EC
Abstract
Dairy cow manure compost (DMC) was evaluated as a soilless substrate substitute for dolomitic limestone and peat moss in two experiments. The objectives were 1) to quantify
the impact of DMC on substrate pH establishment and stabilization throughout crop time and 2) to test the effect of DMC on physical properties of substrate peat moss plus DMC (at 5 to
30% by volume) was held constant at 75% volume and perlite at 25% without limestone. Two additional control treatments of 75% sphagnum peat moss and 25% perlite were formulated with and without agricultural dolomitic limestone. Pot chrysanthemum ‘Kory’
2
irrigation with 17N-2.2P-14.1K neutral fertilizer. Additions of 0 to 30% DMC resulted in initial substrate pH levels of 3.1 to 6.5. Although pH declined during plant production, the
decline was similar in the agricultural limestone and the 20 to 30% DMC treatments that had similar initial pH levels. Thus, pH buffering capacity of DMC was similar to the limestone.
The initial EC levels for all substrates were within the acceptable range for seedlings and bedding plants. Magnitude of shrinkage did not relate to addition of DMC and was of little commercial significance. Irrespective of time in the cropping cycle, DMC resulted in
increased dry bulk density (Db), decreased total porosity (TP) and container capacity (CC), and little effect on air space (AS). AS levels were in a good range of 15% and above for the
7.6 cm tall test cylinders. End of crop tissue analysis indicated that DMC resulted in higher leaf concentrations of potassium, sulfur, copper, iron, and manganese, lower, but adequate, calcium and magnesium, and similar nitrogen, phosphorus, boron, and zinc concentrations.
Maximum plant growth (dry weight) occurred with 15% DMC in Expt. 1 and with 10% DMC in Expt. 2. All limestone and a portion of peat moss were effectively replaced with
DMC.
Introduction
Use of dairy manure compost (DMC) has contributed to sustainable agricultural
production through recycling of animal waste and improving chemical and physical
properties of soil (Klausner et al. 1998; Eghball et al. 2004; Butler and Muir, 2006; Butler et
weight, and odor, and can kill weed seeds and pathogens (Rynk et al., 1992). Application of compost to soil significantly increased pH, organic matter content, and soil-water holding
capacity (Murray, 1981; Butler and Muir, 2006; Butler et al., 2008; Butler et al., 2009). The effects of compost residuals lasted up to four years by guarding against soil acidification and
nutrient depletion problems in corn production (Eghball et al., 2004). DMC and similar composted materials such as fiber from digested slurry or composted cattle slurry fiber were shown to serve as a substitute for peat moss in a growing mix for a number of crops (Bradley
el al., 1996; Chen et al 1986; Prasad 2008). Information is lacking on the effects of compost on pH stabilization in container root substrates as well as on the impact compost could have
on the physical properties of these substrates. The objectives of this study were 1) to quantify the impact of DMC on substrate pH establishment and stabilization throughout crop time and
2) to test the effect of DMC on physical properties of substrate.
Materials and Methods
Plant Culture Two experiments were conducted in a glass greenhouse at 35 °N latitude in Raleigh, NC. The experiments were initiated in August 2007 (Expt. 1) and May 2008 (Expt. 2) and were conducted for 12 and 11 weeks, respectively. Five rooted cuttings of pot chrysanthemum ‘Kory’ (Dendranthema x grandiflora (Ramat.) Kitam.) were transplanted into green plastic pots containing 1.4 L of root substrate and measuring 16.5 cm in diameter at the top and 11.2 cm deep. Fertilizer formulated in deionized water was applied to the top
4
17N-2.2P-14.1K neutral water soluble fertilizer (Greencare 17N-5P2O5-17K2O, Kankakee, IL). It was applied at a concentration of 300 mg L-1 N in Expt. 1 and 250 mg L-1 N in Expt. 2. Frequency of irrigation ranged from twice a week at the beginning to daily at the end of the experiments. At 14 days after transplanting (DAT), all plants were pinched to leave an
average of 9 leaves per plant. In Expt. 1, black cloth was applied from 7:00 p.m. to 7:00 a.m. beginning at 14 DAT and was continued for 9 weeks to induce flowers. In Expt. 2, incandescence light was applied at an intensity of 2 µmol m-2 s-1 for the first two weeks. After two weeks, plants were shaded with black cloth from 6:00 p.m. until 7:00 a.m. daily until color was well developed in buds. Plants were sprayed with daminozide plant growth
regulator at a concentration of 2,500 mg L-1 21 DAT in Expt. 1 only.
Compost A stable mature compost of dairy cow manure plus spoiled-silage (DMC) adjusted initially to a C:N of 30, (Woods End Laboratories, Inc, Mt Vernon, Maine) was prepared by
turned-pile method, using a tractor front-end loader to lift and mix a conical-shaped pile (dimensions 4.3m d x 1.8m H) 5 times in the course of 90-days. Temperature in the core of
the pile rose within 7-days of mixing to 57-60°C and remained very warm (49 – 57°C) for 6-weeks. After cooling to less than 30°C piles were stored outdoors by covering with Compostex® compost fabric, a polypropylene spun fabric permeable to air but which sheds
water. Prior to use, a cubic meter sample of DMC was sieved through a 13 mm screen and mixed in a Twister™ II Batch Mixer, (Bouldin and Lawson, McMinnville, TN). Compost
presented in Table 1.1. Other measurements include a cation exchange capacity of 36.7 meq 100 cm-3 determined by summation of cations; a base saturation of 100%; a pH level of 8.0 measured in a 2:1 deionized water filtrate; a saturated paste EC level of 5.1 mS cm-1, a C:N ration of 13.3; and calcium carbonate equivalence 1.67% (dry weight bases).
Treatments Root substrate treatments had fixed volumes of 25% perlite and 75% sphagnum peat moss (Sun Gro Horticulture, Bellevue, WA) plus DMC (at 5, 10, 15, 20, 25, or 30% by volume). No limestone was applied in these treatments. Additionally, two control treatment
of 75% sphagnum peat moss and 25% perlite were formulated with and without agricultural dolomitic limestone (6g L-1). All treatments included wetting agent (AquaGro 2000 G, Aquatrols, Paulsboro, NJ) at the label rate of 0.6 g L-1.Anhydrous calcium sulfate (CaSO4) at 0.9 g L-1 was added into all treatments in Expt 2.
Data Root substrate pH and EC were measured in substrate solution extracted using the pour-through technique (Wright, 1986) in Expt. 1 and the Rhizon Soil Moisture Sampler in Expt. 2
(Soil Moisture Equipment Corp., Santa Barbara, CA, www.soilmoisture.com). Both tests
were designed to sample unaltered bulk solution. The Rhizon sampler consisted of a 10 cm long hollow, hydrophilic polymer PVC tube that was inserted diagonally into the pot from 0.5 cm below the substrate surface to the bottom of the pot. Substrate solution was drawn
through the sampler and into a collection vial under a vacuum of -138 kPa.
Root substrate shrinkage during the crop production period in Expt. 1 was measured
6
the first measurement, plants had been transplanted and watered to settle the substrate. Substrate depth was determined as the average of three measurements of the distance from
the pot rim to the substrate surface.
In Expt. 1 the five plants in each pot were cut at the substrate surface, dried to a constant weight in a forced draft oven at 70ºC, and the combined weight of the five plants
was measured. In Expt. 2, leaves one third of the distance from the terminal end of lateral shoots were harvested. These leaves were washed in 0.2 N HCl for 1 min, rinsed in deionized
water, dried in a forced draft oven at 70ºC, and weighed. Total dry shoot weight was determined as the sum of the weight of sampled leaves plus the weight of the remainder of
the combined five shoot in each pot. The dry leaf samples were ground in a Thomas-Wiley Intermediate Mill (Arthur H. Thomas Co., Swedesboro, NJ 08085) with a stainless steel cutting chamber to pass a 20 mesh sieve (1 mm particle size). A 0.15 g sample was digested
in a microwave digester (MARS; CEM Corp, Matthews, NC) using a modified EPA method (EPA method 3051 with additional peroxide step). Nutrient concentration, except N, was
determined with inductively coupled plasma optical emission spectroscopy (ICP-OES; Model IRIS Intrepid II, Thermo Corp., Waltham, MA). Total nitrogen was determined with a
combustion analyzer (model 2400, Perkin Elmer, Waltham, MA).
Average substrate physical properties in a 7.6 cm tall column were measured in Expt. 2 at the beginning and the end of the experiment. Measurements included dry bulk density
volume), and air space at CC (AS, % substrate volume) using the NCSU porometer method (Fonteno 1996). At the initial date, three 7.6 diameter by 7.6 cm tall cylinders were taped
together end to end. This combination cylinder was filled with substrate and was compacted by dropping it a distance of 15 cm three times. The center cylinder with its substrate was
used for physical properties testing. At the end of the experiment (77 DAT), substrate was removed from the center of pots by coring. Three 7.6 cm diameter cylinders were taped together end to end. The bottom cylinder was 3.8 cm tall and had a beveled cutting edge
while the two cylinders above it were each 7.6 cm tall. This compound cylinder was hammered through the substrate in the pot to the pot bottom. The center cylinder with its
substrate was used for physical properties testing.
Experimental Design & Analysis Both experiments were arranged in a randomized complete block design with five blocks. Each plot consisted of one complete row of three pots across
the 122 cm wide bench. Initial substrate pH and EC values of each substrate were regressed using the PROC REG to determine the best-fit, linear or quadratic model. Terms of the
model were evaluated for significance based on a comparison of F values at α=0.05. Means of plant tissue nutrient concentrations were separated by T-test at P≤0.5.
Results and Discussion
Substrate pH
Initial substrate pH in Expts. 1 and 2, measured after watering newly transplanted
8
DMC and 3.2 and 3.1 in the control treatment without both limestone and DMC, respectively (Fig. 1.1). Initial substrate pH increased with each increase in DMC in a quadratic fashion
(P<0.0001). At 30% DMC initial substrate pH was 6.3 and 6.6 in experiments 1 and 2, respectively. The initial substrate pH declined over time in all treatments with the exception
of the un-limed 0, 5, and 10% DMC treatments in Expt. 1 and 0% DMC in Expt. 2 (Fig. 1.2). Substrate pH in these latter treatments was always below 5.0 and rose slightly by the end of the experiments. Substrate pH in the limestone control treatment over time was between the
20% and 30% DMC treatments in Expt. 1 and between the 20% and 25% treatments in Expt. 2. The declines in substrate pH over time in the limestone control and 20% to 30% DMC
treatments were fairly parallel, indicating that the pH buffering capacity of DMC was of a similar magnitude to the agricultural limestone. A downward shift in pH was anticipated because applied fertilizer was neutral, there was no alkalinity in the irrigation water, and
plant root respiration was expected to have an acidifying effect. The residual component of limestone was inadequate to counteract acidification.
Substrate EC
The EC of DMC, as determined by the saturated media extraction procedure, was 5.1 mS∙cm -1
. The EC of substrate solutions in Expt. 1, obtained through the pour-through extraction
for seedlings and bedding plants as set forth for the pour-through technique by Whipker, et
al. (2000).
Plant Growth
The 15% and 10% DMC treatment in Expt. 1 and Expt. 2, respectively, produced the
largest plant dry weight which is significantly greater growth compared to both control treatments that did not contain DMC (Fig. 1.4). Similarly, the addition of composted
separated fiber from cattle manure improved the growth of tomato seedling (Prasad 2008).
Substrate Physical Properties
Because the procedures for sampling substrate were, out of necessity, different at the
beginning and end of the experiment, comparison of physical properties between the two times would not be valid. Consequently, interpretation of physical properties is limited to the
impact of DMC within each of the initial and final treatment series.
Initial and final substrate dry Db increased from 0.10 to 0.23 g∙cm-3 and from 0.11 to 0.19 g∙cm-3, respectively, with DMC increases from 0 to 30% (Fig. 1.5A).These are in the range found by Chen et al., (1986). Initial TP decreased from 87.5% to 79.6% with DMC increases from 0 to 30% (Fig. 1.5B). Final TP likewise decreased from 91.2% to 85.2% with increased DMC. Substrate CC followed a similar pattern to TP (Fig. 1.5C). Initial CC
10
higher DMC levels (Fig. 1.5D). Final AS was random across DMC treatments without fitting any significant regression line. Irrespective of time in the cropping cycle, DMC resulted in
increased Db, decreased TP and CC, and little effect on AS. AS levels were in a good range of 15% and above for a 7.6 cm tall column of substrate.
Nutrient Uptake
The control substrate with limestone and the substrate with 20% DMC were selected in Expt. 2 for a comparison of leaf nutrient concentrations because the substrate pH levels in
these treatments were similar and in the desired range. Plants grown in the substrate with 20% DMC contained significantly higher concentrations of K, S, Cu, Fe, and Mn and lower concentration of Ca and Mg than plants in the limestone control treatment (Table 1.2).
Higher Ca and Mg concentrations would be expected in the limestone control treatment plants due to the supply of these nutrients in dolomitic limestone. Higher concentrations of
the other nutrients were reasonable given the supply of these in manure compost.
Conclusions
This study demonstrated that DMC can be used in the place of limestone to set initial substrate target pH and buffer it as well as limestone over 77 days of production. Air space at container capacity did not differ and substrate volume shrinkage was insignificant in the
DMC substrates. However, bulk density was higher and container capacity was lower in the DMC substrates. Substrate EC values increased with DMC addition but remained in
ACKNOWLEDGMENTS
Mention of a trademark, proprietary product, or vendor does not constitute a
guarantee or warranty of the product by the U.S. Dept. of Agriculture and does not imply its
approval to the exclusion of other products or vendors that also may be suitable.
12
Literature Cited
Bradley, G.J., Glass, M.H., and Bilderbuch, T.E. 1996. Dairy cow compost as a potting substrate for growing hybrid rhododendrons. HortScience 31:753.
Butler, T.J., Han, K.J., Muir, J.P., Weindorf, D.C., and Lastly, L. 2008. Dairy Manure Compost Effects on Corn Silage Production and Soil Properties. Agronomy Journal 100:1541-1545.
Butler, T.J. and Muir, J.P., 2006. Dairy manure compost improves soil and increases tall wheatgrass yield. Agronomy Journal 98:1090-1096.
Butler, T.J., Weindorf, D.C., Han, K.J., and Muir, J.P. 2009. Dairy Manure Compost Quality Effects on Corn Silage and Soil Properties. Compost Science and Utilization
17(1):18-24
Chen, Y., Inbar, Y., Raviv, M., and Dovrat, A. 1986 The use of slurry produced by
methogenic fermentation of cow manures a peat substitute in horticulture-physical and chemical characteristics. . Acta Horticulturae 150:553-561.
Eghball, B., Ginting, D., and Gilley, J.E. 2004. Residual Effects of Manure and Compost Applications on Corn Production and Soil Properties. Agronomy Journal 96:442-447. Fonteno, W.C. 1996. Growing Media: Types and Physical/Chemical Properties. p.93-122. In:
D.W. Reed (ed.), Water, Media, and Nutrition for Greenhouse Crops, Ball Publishing, Batavia, Illiniois.
Klausner, S.D., Fox, D.G., Rasmussen, C.N., Pitt, R.E., Tylutki, T.P., Wright, P.E., Chase, L.E., and Stone, W.C. 1998. Improving dairy farm sustainability. I. An approach to animal and crop nutrient management planning. American Society of Agronomy 11(2):225-233.
Murray, J.J. 1981. Utilization of Composted Sewage Sludge in Sod Production. p. 544 (abstract). In: R.W. Sheard (ed.). Proceedings of the Fourth International Turfgrass Research Conference, Guelph, Ontario, Canada. The International Turfgrass Society. Prasad, M. 2008. Evaluation of Composted Cattle Slurry Fibre as Peat Diluent. p. 305-306
(abstract). In: Jacques G. Fuchs, Thomas Kupper, Lucius Tamm & Kaarina Schenk (eds.), Proceedings of the international congress, CODIS 2008.
Gouin, F.R., Laliberty, L., Kay, Jr., D., Murphy, D.W., Hoitink, H.A.J., and Brinton, W.F. 1992. On farm composting. Northeast Regional Agricultural Engineering Service, Ithaca, New York.
Whipker, B. E., Fonteno, W. C., Cavins, T. C. and Bailey, D. A. 2000. Pour-Thru Nutritional Monitoring Manual, third ed. North Carolina State Univ. Available on web at
www.floricultureinfo.com
14
Table 1.1. Total nutrient concentrations in dairy manure compost.
N P K Ca Mg S Fe Mn Zn Cu B
(%) (mg∙kg-1)
Mean 1.77 0.42 0.76 1.8 0.56 0.23 3486.33 351.67 134.67 758 24.63 S.E. 1 0.11 0.01 0.01 0.03 0.01 0 147.74 6.69 1.86 9.45 0.37 1
Table 1.2. Nutrient Concentrations with standard errors (n=5) in chrysanthemum leaves
grown in 0% DMC with lime (Control) and in the substrate with 20% DMC without lime (20% DMC) at the end of Expt. 2 (77days after transplant).
Macro Nutrients (% of Dry Weight)
Treatment N P K Ca Mg S
Control 6.40±0.17 0.78±0.11 5.21±0.16 2.15±0.12 0.56±0.02 0.19±0.02 20% DMC 5.81±0.11 0.59±0.01 5.98±0.27 1.77±0.04 0.44±0.01 0.27±0.00
Significance1 NS NS * * ** **
Micro Nutrients (mg kg-1 of Dry Weight)
Treatment B Cu Fe Mn Zn Na
Control 65.3±10.5 9.1±1.5 155.1±18.3 308.8±23.6 38.4±1.7 883.9±21.0 20% DMC 53.4±2.8 15.8±1.3 269.6±42.2 462.4±28.2 58.8±9.9 412.8±51.0
Significance NS * * ** NS ***
1
16
Figure 1.1. Response of initial substrate pH to volumetric quantity of dairy manure compost (DMC) in Expts. 1 and 2.
DMC (%)
0 5 10 15 20 25 30
Ini
tial
S
ub
st
rat
e pH
3 4 5 6 7
Expt 1. Substrate without lime Expt 2. Substrate without lime Expt.1. Substrate with lime Expt 2. Substrate with lime
R2=1.0, y=3.2+0.14x-0.0013x2
Figure 1.2. Substrate pH levels over time in treatments with and without limestone or dairy cow manure compost (DMC) in Expts. 1 and 2.
Days after Transplant
0 20 40 60 80
S u b s tr a te p H 3 4 5 6 7
0% DMC, with lime 0% DMC, no lime 5% DMC, no lime 10% DMC, no lime 15% DMC, no lime 20% DMC, no lime 30% DMC, no lime
Days after Transplant
0 20 40 60 80
S u b s tr a te p H 3 4 5 6 7
0% DMC, with lime 0% DMC, no lime 10% DMC, no lime 15% DMC, no lime 20% DMC, no lime 25% DMC, no lime 30% DMC, no lime
(Expt.1) (Expt. 2)
Days after Transplant
0 20 40 60 80
S u b s tr a te p H 3 4 5 6 7
0% DMC, with lime 0% DMC, no lime 5% DMC, no lime 10% DMC, no lime 15% DMC, no lime 20% DMC, no lime 30% DMC, no lime
Days after Transplant
0 20 40 60 80
S u b s tr a te p H 3 4 5 6 7
0% DMC, with lime 0% DMC, no lime 10% DMC, no lime 15% DMC, no lime 20% DMC, no lime 25% DMC, no lime 30% DMC, no lime
18
Figure 1.3. Average EC (±standard error, n=5) of substrates containing 0 to 30% dairy cow manure compost (DMC) in Expt. 1 after transplanting by the pour-through method.
DMC (%)
0 5 10 15 20 25 30
E
C
(m
S
cm
-1 )
1.5 2.0 2.5 3.0 3.5
R2=0.70
Figure 1.4. Plant shoot dry weight with increasing dairy cow manure compost (DMC) from 0 to 30% without lime and 0% DMC with lime.
DMC (%)
0 5 10 15 20 25 30
Pl
an
t D
ry
Weig
ht
(
g)
25 30 35 40 45 50 55
20
Figure 1.5. Average substrate physical properties in a 7.6 cm tall column at the beginning and the end of Expt. 2, including A) dry bulk density (Db), B) total porosity (TP), C) container capacity (CC), and D) air space (AS).
DMC (%)
0 5 10 15 20 25 30
B ulk De ns ity (g c m -1 ) 0.05 0.10 0.15 0.20 0.25 0.30 DMC (%)
0 5 10 15 20 25 30
Tot a l Poro c ity (% Vol. ) 76 78 80 82 84 86 88 90 92 94 DMC (%)
0 5 10 15 20 25 30
C ont a ine r C a pa c ity (% Vol. ) 60 62 64 66 68 70 72 74 76 78 DMC (%)
0 5 10 15 20 25 30
A ir Spa c e (% Vol. ) 10 12 14 16 18 20 22 DMC (%)
0 5 10 15 20 25 30
B ul k D e ns it y ( g/ c c ) 0.05 0.10 0.15 0.20 0.25 0.30 Final Initial DMC (%)
0 5 10 15 20 25 30
T otal P or oc it y ( % V ol ) 76 78 80 82 84 86 88 90 92 94 DMC (%)
0 5 10 15 20 25 30
C on ta ine r C a pa c it y ( % V ol ) 60 62 64 66 68 70 72 74 76 78 DMC (%)
0 5 10 15 20 25 30
A ir S pa c e ( % ) 10 12 14 16 18 20 22 DMC (%)
0 5 10 15 20 25 30
B ul k D e ns it y ( g/ c c ) 0.05 0.10 0.15 0.20 0.25 0.30 Final Initial DMC (%)
0 5 10 15 20 25 30
T otal P or oc it y ( % V ol ) 76 78 80 82 84 86 88 90 92 94 DMC (%)
0 5 10 15 20 25 30
C on ta ine r C a pa c it y ( % V ol ) 60 62 64 66 68 70 72 74 76 78 DMC (%)
0 5 10 15 20 25 30
A ir S pa c e ( % ) 10 12 14 16 18 20 22
0 DAT (Initial)
77 DAT (Final) A B
CHAPTER 2
Predicting Calcite (CaCO
3) Requirements of Sphagnum Peat Moss from
pH Titration Curves
Ka Yeon Jeong1, Dean Hesterberg2 Paul Nelson1, and Jonathan Frantz3 1
Department of Horticultural Science, North Carolina State University, Raleigh, NC, USA 27695
2
Department of Soil Science, North Carolina State University, Raleigh, NC, USA 27695 3
USDA-ARS-ATRU, 2801 W. Bancroft, MS 604, Toledo, OH, USA 43606
Abstract
Liming materials are required to neutralize acidity in peat moss to make it a suitable substrate
for growing containerized plants. A series of time-consuming incubations of peat:lime mixtures are typically used to determine the liming rate to achieve a desired pH. Our objective was to develop a rapid, acid-base titration method for predicting calcite (CaCO3) requirement of sphagnum peat moss. Peat moss with an initial pH of 3.7 was titrated in aqueous suspension with 0.1 M NaOH or 0.1 M HCl solution from pH 3 to 11 (forward
titration), then from pH 11 to 3 (backward titration). Because of hysteresis, the forward and backward titration curves were averaged to predict calcite requirements. For comparison, peat moss samples were incubated in plastic bags for 13 days after applying calcite at rates
22
a steady-state was established. The pH achieved by calcite incubation could be predicted up to pH 6.2 by the averaged acid-base titration curve. Above pH 6.2, calcite solubility limits
caused a deviation between the two methods as the pH in the incubation experiment reached a plateau with increasing calcite additions. Geochemical speciation calculations showed that
calcite solubility limits imposed by atmospheric CO2 and dissolved Ca2+ activity restricts the maximum pH achievable. Nevertheless, the acid-base titration is a quick method for
accurately predicting calcite requirements of acidic peat moss for target pH levels ≤ 6.2.
Introduction
Sphagnum peat moss has been a key component of container root substrate for the
past 60 years. The acidity of sphagnum peat moss, with pH values in the range 3.0 to 4.0 in water (Bailey, 1996; Bunt, 1976), significantly influences the final pH of peat-base substrate (Bailey, 1996). For most greenhouse crops, the optimal pH recommended for peat-base
soilless substrate is between 5.4 to 6.5 (Bailey, 1996; Handreck, 2002; Nelson, 2003;
Peterson, 1981). Therefore, liming is required for soilless substrates containing acidic organic
components such as peat moss (Bishko, Fisher and Argo, 2002; Elliott, 1996; Rosenbaum and Sartain, 1982).
Since the pH acidity and buffering capacity varies depending on type and origin of
peat moss (Bunt, 1976), the lime requirement for peat-based substrate is often assessed using titration curves. The incubation method – measuring the pH-response of peat or peat-base
pH-response depends on the physical and chemical properties of the liming source as well as the application rate (Bishko et al., 2002; Huang et al., 2007; Rippy and Nelson, 2005;
Rosenbaum and Sartain, 1982). The effect of limestone particle size on peat pH-response has been studied by Huang et al. (2007) and Rippy et al. (2007). With increasing particle
diameter, initial solubility decreased while the residual component increased. Later
dissolution of the residual component resulted in continual neutralization of peat moss acidity for extended periods of time. This residual effect of limestone resulted in under- or
over-estimation of lime requirement and extended by two to three weeks the necessary incubation time (Fisher et al., 2006; Rosenbaum and Sartain, 1982) needed to complete react the lime
and develop and accurate curve (Marshall, Young and Gregson, 1995).
The length of incubation time required for complete dissociation of added base is also affected by the strength of bases added (Rippy and Nelson, 2005). The pH-response to
NaOH (strong base) was immediate, while an incubation period was required when peat moss was treated with Ca(OH)2 (a weak base). The lime requirement should be determined on the basis of the desired increase in pH from the initial pH and on the pH buffering capacity of peat moss. The acidity of sphagnum peat moss consists of active and reserve (exchangeable) acidity, which is indicated by initial pH measurement and by pH buffering
capacity, respectively (Bunt, 1976). The initial pH is related to hydrogen ions (H+) in the peat moss that readily enter solution when the peat is hydrated. The pH buffering capacity is
24
The most abundant and significant acidic functional groups are carboxylic and phenolic groups, which bind proton and other cations (Aitken and Moody, 1994; Christl and
Kretzschmar, 2001; Cooke et al., 2007; Gustafsson, 2005; Kinniburgh et al., 1996; Orsetti et al., 2009; Ramos et al., 1999). The carboxylic groups dissociate between pH 3 and 6, while
the phenolic groups dissociate mainly in the neutral to alkaline pH range (Kam and Gregory, 2001; Swift, 1999).
The lengthy time requirements and inaccurate assessment of actual acidity of peat
moss can be overcome by strong acid/base titration to determine the inherent pH buffering capacity of the peat moss. Several titration techniques and methods to measure the pH
buffering capacity have been developed to determine the lime requirement for soil and organic matter (Aitken and Moody, 1994; Cooke et al., 2007; Follett, 1983; Godsey et al., 2007; Janos et al., 2008; Liu et al., 2005; E. O. McLean et al., 1966; Rippy and Nelson,
2005). Continuous potentiometric titration of organic soils was used to investigate the total buffering capacity (Kuznetsov, 2007). The potentiometric titration with incremental additions
of acid or base has been investigated to test acid-base properties of humic substances (Christl and Kretzschmar, 2001; Cooke et al., 2007; Ritchie and Perdue, 2003; Ritchie and Perdue, 2008), because the acidic functional groups of humic substances in soil play a role in the soil
capacity), and 2) apply the method to determine calcite (CaCO3) requirement for adjusting pH of sphagnum peat moss based on the strong acid/base acidity titration curve.
Materials and Methods
The reserve acidity of sphagnum peat moss was quantified on a dry weight basis instead of a volume basis because the bulk density of sphagnum peat moss can be altered by
handling and its water content. Therefore, the water content (W) of fresh peat moss sampled was measured as [(fresh weight-dry weight)/fresh weight]). Dry weight (g, Pd) and initial water amount (ml, Wi) of the given amount of fresh peat moss sample (g, Pf) was estimated as Pd=Pf - (Pf×W) and Wi=Pf - Pd, respectively.
I. Strong Acid-Base Titration of Peat Moss
Standard acid (0.1 M HCl) and base (0.1 M NaOH) titrant solutions were prepared using de-gased, de-ionized water prepared by bubbling N2(g) through the boiled deionized water. The potentiometric acid-base titration was performed by using an automatic titrator system (TitraLab 856, Radiometer Analytical SAS, Villeurbanne Cedex, France).
Sample preparation. Aqueous suspensions of sphagnum peat moss were prepared by
stirring 1.5 g (dry weight basis) of fresh peat moss in 50 ml of de-gassed, de-ionized water at 500 rpm on a stir plate for 30 minutes in a 200 ml glass beaker covered with paraffin film on
26
peat moss, opening of the aggregated macro and micro structures of peat moss was critical to render the cation exchangeable sites available to react with added titrant solution. It was not
possible to disperse the aggregates by physical methods such as sonification (Milne et al., 1994). According to the random coil model of humic substances, organic polymers are
flocculated at low pH and dispersed at high pH due to the electrostatic repulsion between negatively charged acidic functional groups (McLean et al., 1996). To initially induce the conformational changes to disaggregate and hydrate the peat moss by electrostatic repulsion,
the peat moss suspension sample was increased pH 11 by addition of 0.1M NaOH. The total volume of added NaOH solution (NaOHt) was recorded. Then the pH of the peat moss suspension sample was decreased to pH 3 by addition of 0.1M HCl. The total added 0.1M HCl solution was recorded as HClt.
Forward- and Backward-Titration. After the peat moss suspension cycled through the base-acid treatment to hydrate and disperse, it was forward titrated from pH 3 to 11 with 0.1M NaOH solution while stirring. The automatic titrator added NaOH solution at rate of 1/7 ml
per minute as min./Max speed setting and recorded pH values (pHf) and volume of NaOH added (ml, NaOHadd) after each addition until pH 11 was achieved. The total volume of NaOH solution added was recorded as ΣNaOHadd (ml). Then, the peat moss suspension was
Calculations.
1) The forward titration curve - Added OH- derived from each addition of 0.1M NaOH solution neutralized the acidity of the peat moss. The neutralized active acidity indicated as increase in pH was calculated by subtracting the amount of H+ ions at pHf from that of at pH 3. Then, pH buffering was calculated as following when X (ml)=50+Wi+NaOHt+HClt:
pH buffering (forward, mol H+·kg-1 of dry peat moss)
= The reserve acidity between pH 3 and pHf
= (added NaOH- change in dissolved OH-)/ mass of peat
= [{added NaOH} – {neutralized active acidity}]/Pd×103
= [(0.1× NaOHadd) – {10-3(X) – 10- pHf(X+ NaOHadd)}] /Pd×103
= [(0.1×NaOHadd) – {(10-3 – 10- pHf)(X) – 10- pHf(NaOHadd)}] /Pd×103
= RAf3
2) The backward titration - The peat moss suspension of pH 11 decreased by incremental
additions of H+ derived from HCl solution. When the volume of peat moss suspension was Y(ml)=X+ΣNaOHadd before the backward titration, the pH buffering at pHb was calculated as
following:
pH buffering (backward, mol H+·kg-1 of dry peat moss)
= The weak acid functional groups between pH 11 and pHb
28
= [{(added HCl) – (increase in active acidity)}]/Pd×103
= [(0.1×HCladd) – {10-pHb(Y+HCladd) – 10-11(Y)}]/Pd×103
= [(0.1×HCladd) – {(10-pHb – 10-11)(Y) +10-pHb (HCladd)}]/Pd×103
= RAb11
In order to plot forward- and backward- titration curves in one graph, the backward-titration curve was transformed by the following equation when Z(ml)=Y+ΣHCladd:
The reserve acidity (mol H+·kg-1 of dry peat moss) between pH 3 and pHb
= [(total reserve acidity] – {(added HCl) – (increase in active acidity)}]/Pd×103 = [(0.1×ΣHCladd)–(10-3×Z)+(10-11×Y)–(0.1×HCladd)+10-pHb×(Y+HCladd) – (10 -11
×Y)]/Pd×103
= {0.1(ΣHCladd-HCladd)-10-3(Z)+10-pHb(Y+ HCladd)}/Pd×103
= RAb3
3) Hysteresis between forward-backward titration curves - The reserve acidities of peat moss
determined from the forward- and backward- titration curve did not agree with each other due to the well-know hysteresis phenomena between forward-backward curves for acid-base titrations of humic substances (Davis and Mott, 1981; Marshall et al., 1995; Paxeus and
Wedborg, 1985; Ritchie and Perdue, 2003; Santos et al., 1999). The forward and backward titration results in this study agreed with Davis and Mott (1981) who reported that there were
The hysteresis exhibited from the forward and reverse titrations has been shown to decreased by repeating titrations of fulvic acid (Paxeus and Wedborg, 1985) and humic acid
(Marshall et al., 1995). Also, Davis and Mott (1981) reported the difference between forward and reverse titration curves was smaller when less concentrated sample solution was used. In
this study, the reserve acidity from forward (RAf3) and backward (RAb3) titration curves and the averaged reserve acidity from both titration curves, [(RAf3+RAb3)/2] were tested.
Amounts of CaCO3 required to achieve a target pH in peat moss were calculated from each of the three curves. When these amounts were incubated with peat moss, the quantity from the average curve came closest to achieving the target pH. Amounts calculated from the RAf3 and RAb3 curves resulted in lower and higher pH value than the targeted pH (data not
shown). Therefore the reserve acidity of peat moss was recalculated by averaging acid-base
titration curves as a function of pH.
30
function of pH as determined from the acid dissociation reaction were used to calculate calcite requirements. The mole fraction (MF) of H2CO3, HCO3-, and CO32- is represented as following: When [H+]=10pH, [H2CO30]=10-1.46, [HCO3-]=10-7.82/[H+], and [CO32-]=10
-18.15
/[H+]2,
MFH2CO30=
, MFHCO3-=
,
MFCO32- =
The predicted CaCO3 requirement to bring peat moss to a given pH level is calculated as follows:
CaCO3 requirement = TA*(0.5*MFH2CO3
0+ MF
HCO3 -)
II. Peat Incubation Method
Fresh sphagnum peat moss, 20 g (dry weight equivalent), were mixed thoroughly in plastic bags with calcium carbonate (CaCO3 USP/FCC, Fisher Scientific, Pittsburgh, PA) at the rate of 0.3, 0.6, 0.9, 1.2, 1.5 mol per kg of peat moss (dry weight basis). Then, 140 mL of
deionized water were added to each bag to saturate the peat moss. Substrate solution was subsequently extracted by squeezing the plastic bags of saturated peat moss at 1, 3, 4, 8, and
was calibrated with pH 4.0 and 7.0 standard buffers solutions after every 10 measurements. After measuring pH of the solution, it was added back into the plastic incubation bag. The
incubation titration curve was developed based on the pH values measured over the 14 days of incubation.
Results and Discussions
Hysteresis between forward- and backward titration curves
The acid/base titration curves of sphagnum peat moss measured by forward- and
backward- titrations showed hysteresis (Fig. 2.1). The total acidity (H+) between pH 3 and 6 was measured as 0.77, 1.45, and 1.11 mol· kg-1 of sphagnum peat moss (dry weight basis) for the forward-, backward- and averaged-titration curves, respectively. Hysteresis has been
proposed to result from physical and chemical factors affecting the protonation and deprotonation of acidic groups on humic substances during the forward- and
backward-titration (Sposito et al., 1977; Varney et al., 1998; Paxeus and Wedborg, 1985; Marshall et al., 1995; Milne et al., 1995; Tombacz, 1999). During sample preparation, the pH of
sphagnum peat moss suspension was increased by addition of 0.1M NaOH for the purpose of
dispersing and hydrating the aggregated humic substance in sphagnum peat moss, then the pH was decreased by addition of 0.1M HCl to set the forward titration starting point of pH 3.
After this procedure, it was possible that the opened structure of humic substance was not permanently fixed and could still respond to the pH level of the suspension. Also, Milne et al.
32
during the forward titration (increasing pH) while aggregation or condensation occurs relatively slower during reverse titration. Therefore, re-aggregated of humic substance at pH
3 may have caused lower acidity measurement during the forward titration than during backward titration. From a chemical aspect, the higher acidity measured during
backward-titration could be due to additional protons released from deprotonation of fulvic acid during forward-titration (Paxeus and Wedborg, 1985).
CaCO3 Requirement Curve from acid-base titration curves
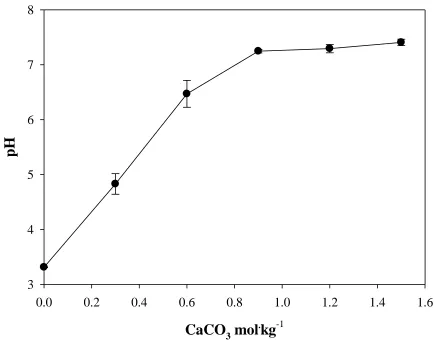
According to averaged titration curve of sphagnum peat moss (Fig. 2.1) the total acidity to adjust the peat moss pH 3.3 to targeted pH 6.0 was 0.96 mol of H+ per 1 kg of peat moss (dry weight basis) calculated by subtracting the acidity (=0.15 mol H+) at pH 3.3 from the acidity (=1.11 mol H+) at pH 6.0. If CaCO3 is only dissociated into Ca2+ and carbonate (CO32-), 0.48 mol of CaCO3 per 1 kg of peat moss (dry weight basis) is required to neutralize 0.96 mol of acidity (Fig. 2.2). However, the targeted pH 6.0 was not achieved by addition of 0.48 mol of CaCO3 (Fig. 2.3) because of various carbonate species (H2CO3o, HCO3-, or CO3 2-) depending on pH in water solution (Lindsay, 19792-). Lindsay (19792-) presented the mole
accounted (Fig. 2.2, Δ curve), the CaCO3 requirement to achieve targeted pH 6.0 from original peat pH 3.3 was estimated at 0.51 mol of CaCO3 instead of 0.48 mol (Fig. 2.2). The estimated CaCO3 requirement, 0.51 mol·kg-1 is in agreement with the result of incubation method test (Fig. 2.3). Therefore, the distribution of H2CO3o, HCO3-, or CO32- as function of solution pH should be considered to determine accurate CaCO3 requirement.
The comparison between estimated pH and measured pH level.
From the average strong acid/base curve, quantities of CaCO3, corrected for
carbonate species, of 0.3, 0.6, 0.9, 1.2, and 1.5 mol of CaCO3 per kg of sphagnum peat moss (dry weight basis) were calculated to achieve pH levels of 4.9, 6.7, 8.8, 10.1, and 10.8. However, when these quantities of CaCO3 were incubated with peat moss the resulting pH levels were 4.8(±0.19), 6.5(±0.25), 7.2(±0.03), 7.3(±0.08), and 7.4(±0.06) (Fig. 2.3 and 2.4). The predicted CaCO3 requirement curve based on the averaged titration curve agreed with the result of the incubation method only up to pH about 6.2 (Fig. 2.4), because the pH levels measured in the incubation method fitted into asymptotic curve as a function of CaCO3 addition.
Although the CaCO3 (fine powder, 98% purity) used in this study was anticipated to dissolve immediately without residual effect, at least 4-days incubation was required to
34
solubility of CaCO3 in water (0.015 g·L-1). Solubility of CaCO3 is also suppressed by decreased concentration of hydrogen ion (H+), increased Ca2+ concentration, and increased partial pressure of CO2 (Equation 2). As added CaCO3 was dissolved in the incubation method, decreases in H+ and increases in Ca2+ concentrations lead to diminishing proportions of CaCO3 dissociating and thus, less H+ neutralization than predicted by the amount of CaCO3 applied.
Acid-base titration technique can quickly and accurately quantify the acidity of
Figure 2.1. Acid/base titration curves of sphagnum peat moss from forward- and backward-titrations and the averaged curve.
Added [OH
-] or [H
+][ (mol
.
kg
-1)
0.0 0.5 1.0 1.5 2.0 2.5
pH
2 4 6 8 10 12
36
Figure 2.3. The pH response curve of sphagnum peat moss as a function of CaCO3 addition.
CaCO
3mol
.kg
-10.0 0.2 0.4 0.6 0.8 1.0 1.2 1.4 1.6
pH
38
Figure 2.4. Comparison between predicted CaCO3 requirement curves based on the acid-base titration curves of sphagnum peat moss and the effect of added CaCO3 on the pH of
sphagnum peat moss.
CaCO
3mol
.kg
-10.0 0.2 0.4 0.6 0.8 1.0 1.2 1.4 1.6
pH
3 4 5 6 7 8
Predicted CaCO3 requirement from forward titratration curve
Predicted CaCO3 requirement from backward titration curve
Predicted CaCO3 requirement based on the averaged titration curve
Figure 2.5. The pH response of sphagnum peat moss treated with addition of 0, 0.3, 0.6, 0.9, 1.2, and 1.5 mol of CaCO3 per kg of sphagnum peat moss (dry weight basis) over 14 days. Each symbol is the averaged pH of 5 replications, and the vertical bar is standard error.
Days of Incubation
0 2 4 6 8 10 12 14 16
pH
2 3 4 5 6 7 8 90 mol.kg-1
0.3mol.kg-1
0.6mol.kg-1
0.9mol.kg-1
1.2mol.kg-1
1.5mol.kg-1
Time (Days of Incubation)
0 2 4 6 8 10 12 14 16
pH
2 3 4 5 6 7 8 90 mol.kg-1
0.3mol.kg-1
0.6mol.kg-1
0.9mol.kg-1
1.2mol.kg-1
1.5mol.kg-1
Time (Days of Incubation)
0 2 4 6 8 10 12 14 16
pH
2 3 4 5 6 7 8 90 mol.kg-1
0.3mol.kg-1
0.6mol.kg-1
0.9mol.kg-1
1.2mol.kg-1
1.5mol.kg-1
Time (Days of Incubation)
0 2 4 6 8 10 12 14 16
pH
2 3 4 5 6 7 8 90 mol.kg-1
0.3mol.kg-1
0.6mol.kg-1
0.9mol.kg-1
1.2mol.kg-1
40
Equation 2. Dissociation of CaCO3 in equilibrium with hydrogen ion.
CaCO
3+ 2H
+
↔ Ca
2++ CO
2(g) + H
2O
Equation 1. Dissociation of carbonic acid (H2CO3o) and bicarbonate ion (HCO3-) H2CO3o ↔ H+ + HCO3- log Ko = -6.36
References
Aitken, R.L. and Moody, P.W., 1994. The Effect of Valence and Ionic-Strength on the Measurement of pH Buffer Capacity. Aust. J. Soil Res., 32(5):975-984.
Bailey, D.A. 1996. Alkalinity, pH, and Acidification. In: Reed, D.W. (ed), A grower's guide to water, media, and nutrition for greenhouse crops. Ball Publishing, Batavia, Illinois. Bishko, A.J., Fisher, P.R., and Argo, W. R., 2002. Quantifying the pH-response of a
peat-based medium to application of basic chemicals. Hortscience 37(3):511-515. Bunt, A.C., 1976. Modern Potting Composts: a manual on the preparation and use of
growing media for pot plants. The Pennsylvania State University Press, University Park and London.
Christl, I. and Kretzschmar, R., 2001. Relating ion binding by fulvic and humic acids to chemical composition and molecular size. 1. Proton binding. Environ. Sci. Technol. 35(12):2505-2511.
Cooke, J.D., Hamilton-Taylor, J. and Tipping, E., 2007. On the acid-base properties of humic acid in soil. Environ. Sci. Technol. 41(2):465-470.
Davis, H. and Mott, C.J.B., 1981. Titraions of Fulvic-Acid Fractions. 1. Interactions Influencing the Dissociation-Reprotonation Equilibria. Journal of Soil Science, 32(3):379-391.
Elliott, G.C., 1996. pH management in container media.Communications in Soil Science and Plant Analysis 27:635-649
Fisher, P.R., Huang, J. and Argo, W.R., 2006. Modeling lime reaction in peat-based subsrates. Acta Horticulturae 718:461-468.
Follett, R.H. and. Follett, R.F., 1983. Soil and lime requirement tests for the 50 states and Puerto Rico. Journal of Agronomic Education 12:9-17.
Godsey, C.B., Pierzynski, G.M., Mengel, D.B. and Lamond, R.E., 2007. Evaluation of common lime requirement methods. Soil Science Society of America Journa,
42
Gustafsson, J.P. and Kleja, D.B., 2005. Modeling salt-dependent proton binding by organic soils with the MICA-Donnan and Stockholm Humic models. Environ. Sci. Technol.
39(14):5372-5377.
Handreck, K. and Black, N., 2002. pH, Growing media for ornamental plants and turf. University of New South Wales Press, Sydney, Australia.
Huang, J.S., Fisher, P.R. and Argo, W.R., 2007. Container substrate-pH response to differing limestone type and particle size. Hortscience 42(5):1268-1273.
Janos, P., Krizenecka, S. and Madronova, L., 2008. Acid-base titration curves of solid humic acids. Reactive & Functional Polymers 68(1):242-247.
Kam, S.K. and Gregory, J., 2001. The interaction of humic substances with cationic polyelectrolytes. Water Research 35(15):3557-3566.
Kinniburgh, D.G., Milne, C.J., Benedetti, M.F., Pinheiro, J.P., Filius, J., Koopal, L.K., and VanRiemsdijk, W.H., 1996. Metal ion binding by humic acid: Application of the NICA-Donnan model. Environ. Sci. Technol. 30(5):1687-1698.
Kuznetsov, N.B., Alekseeva, S.A., Shashkova, G.V., Dronova, T.Ya. and Sokolova, T.A. 2007. Buffer Capacities of Podzolic and Peat Gleyic Podzolic Soils to Sulfuric and Nitric Acids. Eurasian Soil Science 40(4):353-366.
Lindsay, W. L., 1979. Carbonate Equilibria, p. 78-85, Chemical Equilibria in Soils. The Blackburn Press, Caldwell, New Jersey.
Liu, M., Kissel, D.E., Cabrera, M.L., and Vendrell, P. F., 2005. Soil lime requirement by direct titration with a single addition of calcium hydroxide. Soil Sci.Soc. Am. J.
69(2):522-530.
Marshall, S. J., Young, S. D. and Gregson, K., 1995. Humic-Acid Proton Equilibria - A Comparison of 2 Models and Assessment of Titration Error. European Journal of Soil Science 46(3):471-480.
McLean, E.O., Dumford, S.W. and Coronel, F., 1966. A Comparison of Several Methods of Determining Lime Requirements of Soils. Soil Science Society of America
Milne, C.J., Kinniburgh, D.G., Dewit, J.C.M., Vanriemsdijk, W.H. and Koopal, L.K., 1995. Analysis of Proton Binding by a Peat Humic-Acid Using a simple Electrostatic Model.
Geochimica Et Cosmochimica Acta 59(6):1101-1112.
Nelson, V.P., 2003. Root Substrate. In: 6th (ed.). Greenhouse Operation & Management. Prentice Hall, Upper Saddle River, New Jersey.
Orsetti, S., Andrade, E.M. and Molina, F.V., 2009. Application of a constrained
regularization method to extraction of affinity distributions: Proton and metal binding to humic substances. Journal of Colloid and Interface Science 336(2):377-387. Paxeus, N. and Wedborg, M., 1985. Acid-Base Properties of Aquatic Fulvic-Acid. Analytica
Chimica Acta 169:87-98.
Peterson, J. C., 1981. Modify your pH perspective. Florists' Review, 169(4386), 34-35, 92-93.
Ramos, A., Lopez, S., Lopez, R., Fiol, S., Arce, F. and Antelo, J.M., 1999. Effect of the ionic strength on the acid-base titration curves of a soil fulvic acid. Analusis 27:414-417. Rippy, J.F.M. and Nelson, P.V., 2005. Soilless root substrate pH measurement technique for
titration. Hortscience 40(1):201-204.
Rippy, J.F.M., Nelson, P.V., Hesterberg, D.L. and Kamprath, E.J., 2007. Reaction times of twenty limestones. Communications in Soil Science and Plant Analysis 38 (13-14):1775-1783.
Ritchie, J.D. and Perdue, E.M., 2003. Proton-binding study of standard and reference fulvic acids, humic acids, and natural organic matter. Geochimica Et Cosmochimica Acta
67(1):85-96.
Ritchie, J.D. and Perdue, E.M., 2008. Analytical constraints on acidic functional groups in humic substances. Organic Geochemistry 39(6):783-799.
Rosenbaum, S.E. and Sartain, J.B., 1982. Lime Requirement of Several Soilless Media.
Proceedings of the Florida State Horticultural Society 95:293-294.
44
CHAPTER 3
Comparison of Rhizon Soil Moisture Sampler, Pour-through, and
Saturated Media Extract Extractions of Container Root Substrate
Ka Yeon Jeong1, Paul Nelson1, and Jonathan Frantz2
1
Department of Horticultural Science, North Carolina State University, Raleigh, NC, USA 27695
2
USDA-ARS-ATRU, 2801 W. Bancroft, MS 604, Toledo, OH, USA 43606
Key words: substrate pH, substrate EC, soil testing
Abstract
The Rhizon soil moisture sampler (RS) provides a non-destructive method for
extracting soil solution. The RS with a 2.5 mm outer diameter draws solution from a small area and raises the question whether it can represent the whole pot. Also, when placed
diagonally or vertically in a pot more solution would be expected to be collected from the base relative to the top of the pot due to lower water container capacity at the top. When 5 RS samplers were placed horizontally at 1, 3, 5, 7, and 9 cm above the bottom of 16.5 cm