Theses and Dissertations
2017
Association of Freestanding Dialysis Facility Size,
Quality Incentive Program Scores and Patient
Survival
Fozia Ajmal
University of South Carolina
Follow this and additional works at:https://scholarcommons.sc.edu/etd Part of theHealth Services Administration Commons
This Open Access Dissertation is brought to you by Scholar Commons. It has been accepted for inclusion in Theses and Dissertations by an authorized administrator of Scholar Commons. For more information, please [email protected].
Recommended Citation
by
Fozia Ajmal
Bachelor of Medicine and Bachelor of Surgery Dow University of Health Sciences, 1998
Master of Business Administration College of Business Management, 2006
Master of Science University of London, 2010
Submitted in Partial Fulfillment of the Requirements
For the Degree of Doctor of Philosophy in
Health Services Policy and Management
The Norman J. Arnold School of Public Health
University of South Carolina
2017
Accepted by:
Janice C Probst, Major Professor
James Hardin, Committee Member
John Brooks, Committee Member
Zaina Qureshi, Committee Member
ii
iii
DEDICATION
To my parents,
Raja Shamrez Affendi and Sultana Shamrez for their prayers and unconditional love through my personal and professional endeavors
To my husband,
Agha Ajmal for his unwavering support, friendship and encouragement in the brightest and murkiest times of our lives
To my children,
Xeerak, Xaira and Xohha for their patience and understanding on my absence on special occasions
To all my extended family members, colleagues and friends,
iv
ACKNOWLEDGEMENTS
First and foremost, I thank God Almighty, my source of knowledge, wisdom and
strength. Thank YOU for always being my strong pillar at weakest moments of my life
and showing me the right path and hope.
After one and a half years of tirelessly working on the dissertation, I would like to
reflect on the people who have helped and supported me so much throughout this period.
I would never have been able to finish my dissertation without the guidance and feedback
of my dissertation committee. I cannot complete this section without mentioning of my
advisor and dissertation chair, Dr Janice Probst. Thank you so much for your guidance,
encouragement and countless hours of reviews and reflections throughout the entire
process. Your enthusiasm and motivation to keep things moving forward are inspirational
for me for the rest of my career. I would like to gratefully thank Dr Brooks, Dr Hardin
and Dr Qureshi for their critical reviews; time and commitment that helped me refine my
work.
In addition to my committee, I would like to thank staff dealing with the Medicare
data and United States Renal Data System to provide me data and respond to my data
v
ABSTRACT
Background
In 2011, The Centers for Medicare and Medicaid Services (CMS) has introduced
a bundled payment reform along with a Quality Incentive Program (QIP) to bring
efficiency in End stage renal disease (ESRD) care. The QIP rates facilities using clinical
and reporting criteria, but misses out on patient outcomes. It penalizes facilities not
achieving a target score by 0-2% of payments. The small facilities are expected to be
impacted more by a reduction in payments. We determined the association between
ESRD facility size and QIP scores and the association between QIP scores and patient
survival.
Methods
We used the Medicare dialysis facility compare, facility level impact and QIP
files; United State Renal Data System (USRDS) facility and patient data and Area health
resource (AHRF) file. We restricted the data to 2013, the most recent year for which all
data were available.
For the first objective, we aggregated the USRDS patient data by facility.
Merging the above data yielded 5,193 facility records. We measured facility size by
number dialysis stations. Given a non-linear relationship between QIP sores and dialysis
stations, we categorized stations into three categories including small (≤10), medium
vi
(>25). We used a multivariable generalized linear model to determine the association
between QIP scores and facility size.
In the objective 2, we included 96,102 incident ESRD patients from January
2013- December 2013, using USRDS patient files. We determined 1-year patient survival
among incident patients who survived the first 90 days. A multivariable Cox proportional
hazard model was run to estimate the association between QIP scores and patient.
Result
The medium and large size facilities scored higher on QIP than small facilities.
Facilities in South, offering peritoneal dialysis, having higher number of Hispanics
patient and county populations scored higher on QIP. However, the facilities with a
higher average distance between patients and facility, a higher proportion of black
population in a facility or county scored lower. Further, patients in facilities scoring < 60
showed a higher mortality than patients in facilities scoring ≥ 95.
Conclusion
We found small facilities scored lower by the QIP than medium and large
facilities. Further, facilities performing lower on the QIP criteria demonstrated lower
patient survival. Our finding that a higher black population in a facility or in the county is
vii
TABLE OF CONTENTS
DEDICATION ... iii
ACKNOWLEDGEMENTS ... iv
ABSTRACT ...v
LIST OF TABLES ...x
LIST OF FIGURES ... xii
LIST OF ABBREVIATIONS ... xiii
CHAPTER I: INTRODUCTION ...1
1.1 THE U.S. HEALTHCARE SYSTEM AND ESRD CARE ...1
1.2 INITIAL COST CONTAINMENT: NARROW BUNDLE PROGRAM ...3
1.3 MODIFICATION: EXPANDED BUNDLE PAYMENT ...3
1.4 POTENTIAL RISKS OF THE EXPANDED BUNDLE PROGRAM ...4
1.5 ESRD QUALITY PROGRAM ...5
1.6 FACTORS ASSOCIATED WITH ESRD QUALITY PERFORMANCE ...6
1.7 RATIONALE ...7
1.8 RESEARCH QUESTIONS ...8
CHAPTER II: BACKGROUND ...10
2.1 ESRD: A COSTLY AND FATAL DISEASE ...10
2.2 HISTORY OF THE MEDICARE ESRD COST SYSTEM...11
2.3 ADDRESSING QUALITY OF CARE UNDER BUNDLED PAYMENT ...13
2.4 QUALITY AND EVOLUTION OF QIP ...14
2.5 CONCERNS ABOUT QIP ...26
2.6 THEORETICAL FRAMEWORK FOR ADDRESSING QUALITY ...28
2.7 FACTORS ASSOCIATED WITH ESRD CARE QUALITY ...32
2.8 FACILITY FACTORS AND PATIENT SURVIVAL ...36
2.9 ECOLOGICAL FACTORS AND PATIENT SURVIVAL ...40
viii
2.11 LIMITATION OF PUBLISHED LITERATURE...55
2.12 HYPOTHESES ...56
CHAPTER III- METHODS ...57
3.1 RESEARCH QUESTIONS ...57
3.2 STUDY METHODS - QUESTION 1 ...57
3.3 STUDY METHODS - QUESTION 2 ...65
3.4 INSTITUTIONAL REVIEW BOARD ...70
CHAPTER IV- MANUSCRIPT ONE: Association of facility size and Medicare ESRD Quality incentives program’s performance scores ...76
4.1 ABSTRACT ...77
4.2 BACKGROUND ...79
4.3 METHODS...80
4.4 RESULTS...88
4.5 DISCUSSION ...92
4.6 CONCLUSIONS ...95
CHAPTER V: MANUSCRIPT TWO: Association of freestanding dialysis facility Quality Incentive Program scores and mortality among incident hemodialysis patients in the United States in 2013 ...106
5.1 ABSTRACT ...107
5.2 BACKGROUND ...109
5.3 METHODS...110
5.4 RESULTS...117
5.5 DISCUSSION ...122
5.6 CONCLUSIONS ...124
CHAPTER VI- CONCLUSIONS ...138
REFERENCES ...143
APPENDIX A: SUMMARY OF THE STUDIES INCLUDED IN THE LITERATURE REVIEW ...157
APPENDIX B: DISTRIBUTION OF DIALYSIS STATIONS AND QIP SCORES AND ASSOCIATION BETWEEN THE STATIONS AND QIP...188
ix
APPENDIX D: ZHANG'S MODEL USING DIALYSIS STATIONS AS A SQUARED TERM ...193 APPENDIX E: SUMMARY OF INCREMENTAL MODEL PREDICTING
PERFORMANCE SCORES ...194 APPENDIX F: ADJUSTED HAZARD RATIOS OF 1-YEAR MORTALITY OF
x
LIST OF TABLES
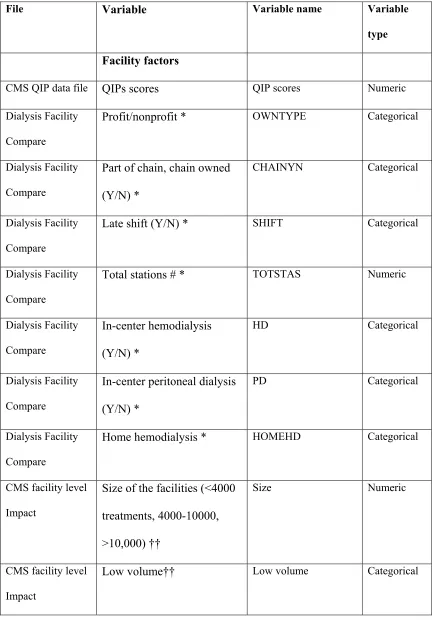
Table 2.1: ESRD quality incentive program (QIP) performance measures
summary 2012-15 ... 18
Table 3.1: List of covariates and data sources ... 71
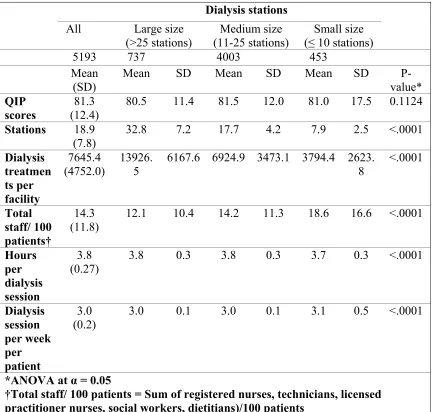
Table 4.1: Facility characteristics by facility size, calendar year 2013 ... 96
Table 4.2: Facility characteristics by dialysis facility size, calendar year 2013 ... 97
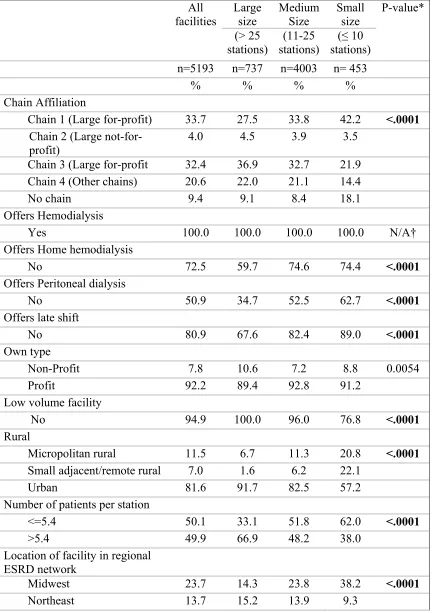
Table 4.3: Distribution of aggregated patient and ecological characteristics,
by facility size, calendar year 2013 ... 99
Table 4.4: Facility characteristics associated with QIP scores, calendar year 2013 ... 101
Table 4.5: Facility characteristics associated with QIP scores, calendar year 2013 ... 102
Table 4.6: Bivariate association between facility-level aggregates of patient and
ecological factors and QIP scores, calendar year 2013 ... 103
Table 4.7: Adjusted analysis for association between facility size and
performance scores, calendar year 2013 ... 104
Table 5.1: Patient characteristics by QIP scores in calendar year (CY), 2013 ... 125
Table 5.2: Patient’s facility characteristics by QIP scores, 2013 ... 128
Table 5.3: Patient’s county characteristics by facility QIP scores, 2013 ... 129
Table 5.4: Unadjusted hazards ratio of 1-year mortality by
Patients characteristics, 2013 ... 131
Table 5.5: Unadjusted Hazard Ratios of 1-year mortality by
xi
Table 5.6: Unadjusted Hazard Ratios of 1-year mortality of patient’s county
characteristics, 2013 ... 135
Table 5.7: Unadjusted 1-year mortality and unadjusted Hazard ratio, 2013
incident patients ... 135
xii
LIST OF FIGURES
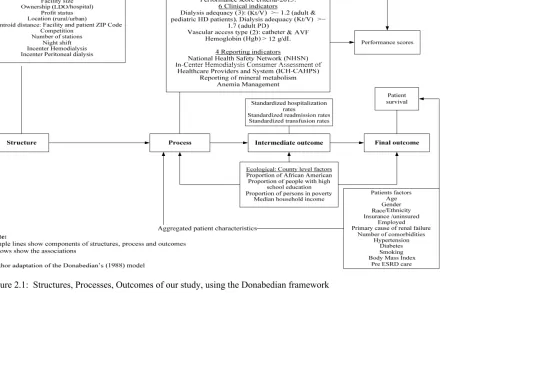
Figure 2.1: Structures, Processes, Outcomes of our study, using the Donabedian
framework ... 31
Figure 4.1: Data sources and merging ... 86
Figure 5.1: Data sources and merging ... 113
xiii
LIST OF ABBREVIATIONS
ACE ... Angiotensin-converting enzyme
AVF ... Arteriovenous fistula
AVG ... Arteriovenous graft
BSI ... Blood stream infections
BMI ... Body mass index
CY ... Calendar year
CVC ... Cardiovascular catheter
CVD ... Cardiovascular disease
CDC ... Centers for Disease Control and Prevention
CMS ... Centers for Medicare and Medicaid Services
CKD ... Chronic Kidney Disease
CPM ... Clinical Performance Measures
CRP ... C-reactive protein
DFC ... Dialysis facility compare
DOPPS ... Dialysis outcomes and practice pattern study
ESRD ... End-stage renal disease
ESA ...Erythropoietin stimulating agent
FFS ... Fee-for-service
xiv
FMC ... Fresenius Medical Care
GFR ... Glomerular filtration rate
GDP ... Gross Domestic Produce
HCT ...Hematocrit
Hgb ...Hemoglobin
IRFCRD ... Independent Renal Facility Cost Report Data file
IOM ... Institute of Medicine
IL ... Interleukin
IV ... Intravenous
MIPPA ... Medicare Improvements for Patients and Providers Act
NHSN ... National Healthcare, Safety Network
NIDDK ... National Institute of Diabetes and Digestive and Kidney Disease
NIUDIC... National Kidney and Urological Diseases Information Clearinghouse
NCC ... Network Coordinating Councils
OR ... Odds ratio
OECD ... Organization for Economic Cooperation and Development
PY ... Payment year
PNV ... Pre-nephrology visit
PPS ... Prospective payment system
RBC ... Red blood cell
SES ... Socioeconomic status
SMR ... Standardized mortality ratios
xv
USRDS ... United States Renal Disease System
URR ... Urea reduction ratio
1
CHAPTER I: INTRODUCTION
1.1 THE U.S. HEALTHCARE SYSTEM AND ESRD CARE
The U.S. spends more on healthcare than any other country (Health at a Glance
2011: OECD Indicators, 2011; Woolf & Aron, 2013). However, it lags behind many
wealthier nations, both in life expectancy and quality of care (The Commonwealth Fund,
2015; Woolf & Aron, 2013). The US spent $3.2 trillion on health care in 2015, 17.8% of
gross domestic product (GDP) (Martin, Hartman, Washington, Catlin, & Team, 2016).
Trends show a continuing rise in cost of care, more so, during the past two decades
(Dieleman et al., 2016). The rising health care costs have affected both private and public
health insurance programs. Medicare, being the largest public insurer, is expected to
utilize 8% of the GDP in 2020, an unprecedented consumption of a single program
(Thorpe, Ogden, & Galactionova, 2010). Therefore, the Centers for Medicare and
Medicaid Programs (CMS) is focused on bringing healthcare delivery reforms.
Some diseases are more costly to treat than the others. An example of such
disease is end-stage renal disease (ESRD). Given its high cost, Centers for Medicare and
Medicaid Services (CMS) included ESRD as a first disease based eligibility in 1972. In
other words, ESRD patients are enrolled in Medicare, irrespective of their age. When the
ESRD legislation was being debated in 1972, the estimated cost was $22-25K per patient
2
ESRD patients require kidney transplantation or frequent dialysis to survive
(Levey & Coresh, 2012). Kidney transplantation is a more permanent and cost effective
treatment than dialysis, however, a majority of patients remain on dialysis due to the
unavailability of kidneys or mismatch in kidney tissues (Garcia, Harden, & Chapman,
2012). Dialysis entails a long treatment with a high recurring cost (National Kidney and
Urologic Diseases Information Clearinghouse, 2013). In 2011, total Medicare
expenditure by modality included, $24.3 billion for hemodialysis; $1.5 billion for
peritoneal dialysis and $2.9 billion for kidney transplants (United States Renal Data
System, 2013). The majority of the End-stage renal disease (ESRD) patients are covered
by Medicare or jointly by Medicare and Medicaid programs (Wetmore, Rigler, Mahnken,
Mukhopadhyay, & Shireman, 2009).
Initially, Medicare reimbursed the cost of ESRD treatment, laboratory services
and drugs, using service (FFS) methods (Watnick et al., 2012). The
fee-for-service (FFS) payment mechanism and growth in the eligible population increased the
total ESRD care cost to Medicare. Further, the lifespans of ESRD patients have also
increased due to the discovery and use of new treatment modalities (A. W. Williams,
2015). Currently, ESRD patients account for a disproportionate share of Medicare
expenditures – ESRD patients comprise about 1% Medicare patient population, however,
consume 7% of the program expenditures (Ojo, 2014; The American Society of
Nephrology, 2014). The rise in overall healthcare cost and, more specifically, the ESRD
3
1.2 INITIAL COST CONTAINMENT: NARROW BUNDLE PROGRAM
In 1983, the program promulgated the ESRD bundled payment model – also called
narrow bundle payments (Chambers, Weiner, Bliss, & Neumann, 2013). Medicare paid
$130 per dialysis treatment, however, kept reimbursing facilities for the provider’s fee,
laboratory tests and medications by FFS method (Watnick, et al., 2012). Consequently,
the providers started prescribing more medications to ESRD patients. The higher
erythropoiesis stimulating agent (ESA) was one such example. This drug improves
hemoglobin levels among anemic ESRD patients. In 2005, 40% of facility payment were
mainly driven by ESA — a separately billable drug (Weiner & Watnick, 2010). Epoetin
and darbepoetin are the two approved ESAs. Epoetin had become a revenue generator,
consuming $2 billion in Medicare costs in the same year (Steinbrook, 2007).
1.3 MODIFICATION: EXPANDED BUNDLE PAYMENT
Realizing the ever increasing cost of the program, Medicare implemented a
prospective payment system with an expanded bundle payment in 2011 (Iglehart, 2011;
Medicare & Medicaid Services 2010). Using new PPS, CMS pays a predetermined
Medicare payment to cove items and services in a dialysis care episode . The composite
rate covers routine laboratory The services included intravenous drugs, laboratory
services, supplies and capital-related costs related to providing maintenance dialysis
(Iglehart, 2011). The expanded bundle makes an average payment of $230 per dialysis
episode, This cost was calculated after adjusting for patient characteristics, including,
age, body size and acute/chronic health conditions (Medicare & Medicaid Services 2010;
4
reimbursed by FFS method. At the end of 2011, the majority of the dialysis facilities
were paid through PPS (Iglehart, 2011).
1.4 POTENTIAL RISKS OF THE EXPANDED BUNDLE PROGRAM
The expanded bundle was designed to bring down cost, however, experts raised
concerns about the negative effects of fixed payment (Kristensen & Wish, 2010; Weiner
& Watnick, 2010). For instance, to mitigate financial risks, dialysis facilities can
undertreat, cherry pick, stint services and increase referrals to ensure financial solvency
(Chambers, et al., 2013; Iglehart, 2011; Kristensen & Wish, 2010; Swaminathan, et al.,
2012). Such reactions to cost saving can result in higher patient complications,
hospitalization, readmissions and mortality due to poor quality of health care (Iglehart,
2011).
The agency theory attempts to explicate the relationship between principal and agent
in a marketplace. The bundled payment is likely to affect the relationship between
principal and agent. A provider (dialysis facilities) acts as an agent, while a patient acts as
a principal (Eisenhardt, 1989; Lee & Zenios, 2012). Under financial constraints, the
agent tries to save cost (Eisenhardt 1989). The principal remains unable to assess agent’s
performance and has no control over the quality of service rendered by an agent.
Therefore, cost savings reforms that are not coupled with quality assessment can result in
5
1.5 ESRD QUALITY PROGRAM
Researchers raised concerns about the possibility of service quality and quantity
decline after the expanded bundle (Chambers, et al., 2013; Kristensen & Wish, 2010).
Considering the concerns and taking lessons from the past, Medicare included the Quality
Incentive Program (QIP) as part of the Medicare ESRD Program in Medicare
Improvement for Patient and Provider Act, 2008 (Medicare & Medicaid Services 2011).
In 2011, the program was formally implemented after the initiation of expanded bundled
payment. Initially, the QIP tracked the facility performance using indicators: proportion
of patients with hemoglobin (Hgb) levels <10 g/dl, Hgb ≥ 12 g/dl and urea reduction ratio
of ≥ 65% average over a year (Fishbane & Hazzan, 2012). Over years, the program
added more indicators including, clinical measures (proportion of patients with
arteriovenous fistula (AVF) and the proportion of patients with catheter for more than 90
days of dialysis initiation) and reporting factors (Table 2.1). The presence of mature AVF
decreases the risk of infections associated with dialysis.
CMS penalizes facilities scoring lower than the target score on QIP by 0-2% of the
payments (Center for Medicare and Medicaid Services, 2012b). Table 2.1 presents the
summary of the clinical measures, reporting measures and scoring criteria. Chapter II
includes more details on indicators and performance calculation and criteria.
Generally, the experience with pay for performance is mixed (James, 2012).
Researchers have also questioned whether the QIP will improve the patient outcomes
(Watnick, et al., 2012; A. W. Williams, 2015). The program was implemented as an
uncontrolled pilot – using a “one size fit all” strategy without an initial pilot or
6
narrow clinical focus, rather than a focus on achieving overall health of the patient (Moss
& Davison, 2015). QIP includes easy to measure laboratory indicators (Moss & Davison,
2015; Nissenson, 2013). However, both Moss et al. and Nissenson et al. reviewed studies
based on specific measures included in the QIP criteria rather than the studies that the
QIP criteria. The QIP criteria include a collection of clinical and reporting measures.
Therefore, a key unanswered question is the relationship between QIP scores and actual
patient outcomes including patient survival.
1.6 FACTORS ASSOCIATED WITH ESRD QUALITY PERFORMANCE
In addition to Medicare quality incentives, facility factors such as chain
affiliation, for-profit status, number of dialysis stations and patient to staff ratio influence
facility performance and health outcomes (Straube, 2014; Yan, Norris, Xin, et al., 2013;
Yue Zhang, 2015). Zhang et al. reported for-profit and chain affiliated facilities rendering
better service quality (Yue Zhang, 2015).
QIP is more likely to increase financial constraints of small dialysis facilities (A.
W. Williams, 2015). QIP can limit the ability of smaller facilities to receive medication
discounts, establish their own pharmacy and laboratory services and administer electronic
health records (Slinin & Ishani, 2013). The few studies that have addressed the
association between size and quality have reported mixed results. For instance, while
Eisenstein et al. and Yan et al. reported that smaller facilities are associated with a higher
patient mortality (Eisenstein et al., 2008; Yan, Norris, Xin, et al., 2013, ) Zhang et al.
reported such facilities perform better (Yue Zhang, 2015). Zhang and associates surmised
7
performance. Notably, the definition of size also varies in the literature. Yan et al. and
Zhang et al. used number of stations, while Eisenstein et al. used number of treatments to
measure facility size.
CMS payment reforms are expected to impact small size facilities adversely
(Chambers, et al., 2013; A. W. Williams, 2015). Rural dialysis facilities are more likely
smaller in size (Medicare Payment Advisory Commission (US), 2015); treat a low patient
volume; render fewer treatments; operate on fewer dialysis stations and generate lower
profit margin, compared with urban facilities (Eisenstein et al., 2008; Medicare Payment
Advisory Commission (US), 2015; O'hare, Johansen, & Rodriguez, 2006; Yan, Norris,
Xin, et al., 2013).
In 2012, CMS rebased the bundle payments, further reducing per treatment
payment by $30 (Wish, Johnson, & Wish, 2014). Rebasing was expected to further
aggravate financial constraints of rural facilities. CMS proposed Low Volume Payment
Adjustments (LVPA) for rural and low volume facilities. However, recent reports
indicate discrepancies in financial adjustments, causing under adjustment or no
adjustment (United States Government Accountability Office, 2013). Low operating
margins are associated with poor quality of care (Ly, Jha, & Epstein, 2011). Therefore,
we hypothesize that small size dialysis facilities are more likely to render a poor quality
of dialysis services.
1.7 RATIONALE
Performance scores were designed by CMS to improve the quality of the program
in the face of increased risk of compromised quality. Facility, patient and ecological
8
literature contains mixed results relating facility size with care quality. Large facilities
receive higher patient volume and therefore are expected to perform better on QIP
criteria. High volume brings down treatment cost. Large organizations receive higher
patient volume which in turn enables them to make more revenues and negotiate on lower
prices. However, Zhang et al.’s study found that the larger facilities performed worse
(Yue Zhang, 2015). QIP may impact small size dialysis facilities adversely (A. W.
Williams, 2015). To the best of our knowledge, no study has determined the association
between number of dialysis stations (facility size) and facility QIP performance scores,
controlling for patient, facility and ecological factors and demand side factor (patient
volume and number of treatments). Small facilities are expected to perform poorly and
become liable to QIP penalties, closure and consolidation after the bundled payment.
However, empirical evidence of association between facility size and QIP scores are
missing. Further, QIP criteria are generally critiqued for their narrow clinical focus,
however, no study has yet determined the association between facility QIP score and
patient survival. Therefore, the proposed research addresses two main questions, as
follows.
1.8 RESEARCH QUESTIONS
1) Is facility size associated with the performance of the freestanding dialysis
facilities as measured by QIP scores?
Hypothesis: Net of other factors, larger facilities have better performance scores
9
2) Is freestanding dialysis facility performance as measured by QIP scores associated
with the survival of the ESRD patients on dialysis?
Hypothesis: Net of other factors, patient survival are positively associated with
10
CHAPTER II: BACKGROUND
2.1 ESRD: A COSTLY AND FATAL DISEASE
ESRD is the principal sequel of chronic kidney disease (CKD) (Couser, Remuzzi,
Mendis, & Tonelli, 2011). CKD results in the inability of kidneys to fully excrete the
body waste. Kidneys are made up of millions of nephrons – filtering units that excrete
body waste and play a role in mineral and water homeostasis (J. E. Hall, 2015). A normal
kidney has a GFR of 125 ml/min/1.73 m2 (Levey et al., 2011). In CKD nephrons die,
reducing the kidney filtration rate, also called the glomerular filtration rate (GFR). As it
progresses, more nephrons die causing further reduction in filtration rate. ESRD ensues
when GFR is reduced to 15 ml/min/1.73 m2 (Levey, et al., 2011).
Reduced GFR results in waste build up inside the body causes uremia – a
syndrome is characterized by a buildup of nitrogenous end products of protein and amino
acids (J. E. Hall, 2015). The nitrogenous end products include urea (measures as Blood
Urea Nitrogen) and creatinine. CKD leads to complications including, hypertension;
weak bones; anemia; infections; pericarditis; pulmonary edema; damaged nerves; poor
nutritional status; and cardiac arrest (Centers for Disease Control and Prevention, 2014;
Taal, 2015). Advanced CKD heralds end stage renal disease (ESRD), a chronic and
debilitating condition. The kidneys completely stop excreting waste (Couser, et al.,
11
Currently, about 10% of the U.S. adult population i.e., about 20 million, suffers
from CKD. The country reported 778,810 ESRD cases in 2013 (Centers for Disease
Control and Prevention, 2014; United States Renal Data System, 2015). The reported
rates of ESRD are three times in the U.S. than other Organization for Economic
Cooperation and Development (OECD) countries (Levey & Coresh, 2012; McCullough
et al., 2011). Indeed, the US ranks third after Taiwan and Japan in ESRD prevalence (Jha
et al., 2013; Levey & Coresh, 2012).
The numbers of ESRD patients are expected to grow with an aging population.
Since 2012, ESRD has risen at a rate of 3.5 % annually, adding 21,000 patients per year
(United States Renal Data System, 2015). Medicare expects its enrollees to increase from
50 million currently to nearly 70 million in 2023 (Blumenthal, Stremikis, & Cutler,
2013). The quality and cost of the ESRD Medicare program will face more brunt of
increasing ESRD aging and frail population with the passing time.
ESRD patients have a higher all-cause mortality rate compared to the other
Medicare patient populations, including cancer (United States Renal Data System, 2015).
In 2015, Jiaquan Xu and colleagues reported kidney diseases among the ten most
common causes of mortality in the US (Jiaquan Xu, 2016). The mortality among ESRD
patients show a rising trend - age adjusted death rate increased by 1.5% between 2014
and 2015 (Jiaquan Xu, 2016). About 20% ESRD patients die within a year of dialysis and
35% die within three years of diagnosis (de Jager et al., 2009; Nissenson, 2013).
2.2 HISTORY OF THE MEDICARE ESRD COST SYSTEM
In 1972, ESRD patients became eligible to enroll in the Medicare program,
12
enrollees and cost of the program has resulted in CMS introducing payment reforms in
1980s and onwards (Watnick, et al., 2012).
2.2.1 Narrow bundled payment
Before 1983, Medicare reimbursed ESRD facilities using a retrospective FFS
payment model, without any payment cap (Chambers, et al., 2013). In 1983, the Social
Security amendment introduced a composite dialysis payment rate of $130 (Iglehart,
2011). The amendment, however, allowed for some items, including drugs, to be billable
outside the bundle. As a result, the providers prescribed costly medications at a higher
rate (Watnick, et al., 2012). ESA is an example of one such costly drug, the use of which
increased exponentially after the QIP.
In 1989, Medicare approved the use of ESA, that is, Epoetin, as a separately
billable drug (Watnick, et al., 2012). Epoetin maintains blood hemoglobin in normal
limits among anemic ESRD patients. Medicare applied a rate of $40 for initial 10,000
units, and the $30 for the units in excess to 10,000 (Watnick, et al., 2012). However, in
1991, Medicare revised the rate to $10 per 1,000 units.
Providers used Epoetin to maximize profits, making it a major revenue source.
Consequently, in 2006, Epoetin constituted a 70% of the total ESRD drug cost, a $2
billion (Watnick, et al., 2012). The overall cost of the program increased tremendously.
In addition to the possible overuse of ESA, the other factors increasing cost included
increasing ESRD prevalence, the number and severity of comorbidities, and changing
13
2.2.2 Expanded Bundle Payment System
To rein in the escalating cost, Medicare introduced the ESRD Prospective payment
system (PPS) as a part Medicare Improvements for Patients and Providers Act (MIPPA)
in 2011 (Weiner & Watnick, 2010). As an expansion of narrow bundle, the new PPS
system included the separately billable drugs, laboratory tests and other related services
in a fixed payment bundle of $230 per episode of care. CMS adjusted the bundle for
patient age, body size and morbidities (Medicare & Medicaid Services 2010;
Swaminathan, et al., 2012). The majority of the facilities shifted to the new system within
a year of its implementation.
2.3 ADDRESSING QUALITY OF CARE UNDER BUNDLED PAYMENT
The term quality used here and hereafter relates to the QIP scores assigned by
Medicare ESRD QIP. The bundled payment increases the financial risks of the providers.
The providers had to render services within an allocated amount. Research has indicated
potential negative effects of bundled payment including lower service quantity (stinting)
quality (Kristensen & Wish, 2010; Winkelmayer & Chertow, 2011). Providers can cherry
pick healthier patients and refer patients with complications (Chambers, et al., 2013;
Desai, Bolus, et al., 2009).
Stinting results in higher hospitalizations and readmission and thereby a higher cost
(Iglehart, 2011). Due to the inclusion of ESA in the bundle payment, providers could also
turn to blood transfusions to treat anemia among ESRD patients (Iglehart, 2011; A. W.
14
bundle. An unnecessary blood transfusion compromises the immune system and
increases the risk of infections (Winkelmayer & Chertow, 2011).
2.4 QUALITY AND EVOLUTION OF QIP
CMS formally addressed quality in ESRD through the Balanced Budget Act for the
first time in 1997 (Frederick, Maxey, Clauser, & Sugarman, 2002; Watnick, et al., 2012).
The Act mandated facilities to report on quality. However, the assessment prompted no
monetary penalty or incentives (Ramanarayanan & Snyder, 2012). In early 2000, the
severe quality deficiency was identified in the US healthcare system by the Institute of
Medicine (IOM) (Berwick, 2002). In 2001, the CMS launched a dialysis facility compare
data public reporting system. The system tracked the facility performance and allowed
CMS to incentivize conforming facilities (Ramanarayanan and Snyder 2012). The broad
category of quality criteria included anemia control, dialysis adequacy and survival.
Realizing the compromised quality as a potential risk, Medicare introduced QIP, a
pay-for-performance system, a few months after the PPS (Center for Medicare and
Medicaid Services, 2016b); (Berenson, Pronovost, & Krumholz, 2013). The term
“Pay-for-performance” embodies quality, efficiency and value based purchasing (Eijkenaar,
2013). It creates rewards for providers who meet or exceed quality criteria (James, 2012).
It also penalizes the noncompliance to quality measures (Berenson, et al., 2013).
Medicare ESRD QIP is such an example. Facility quality measures and benchmarks were
developed and publicly reported with a penalty of 0-2% on non-compliance (Berenson, et
15
2.4.1 QIP performance indicators
Prior research has shown the association of clinical benchmark such as attainment
of target Hgb, hematocrit, URR, albumin, etc. with health outcomes including improved
survival and lesser hospitalization. (Lacson, Wang, Lazarus, & Hakim, 2009; Plantinga et
al., 2007). Among large nonprofit chains, Tentori et al. found achieving clinical goals
(Urea levels, hemodialysis treatments, hemoglobin level, bicarbonate level, albumin
level, phosphorus level, fistulae, and catheters) in the large nonprofit chain was
associated with better patient survival (Tentori et al., 2007).
Since its inception, QIP criteria varied over the years. The following section
presents clinical and reporting measures and target scores used by QIP over the years
(Table 2.1).
Medicare publishes facility quality reports two years after the actual service year
(Center for Medicare and Medicaid Services, 2016b). Thus, services rendered in calendar
year 2010 are reported in 2012. In the current study we used the calendar (service) year
as a reference to payment year. In the calendar year 2010, the three performance
indicators were included; 1) the proportion of patients with hemoglobin (Hgb) >12 mg/dl,
2) Hgb < 10 mg/dl and 3)urea reduction ratio (URR) of ≥ 65% (Centers for Medicare &
Medicaid Services (CMS), 2013). Hgb >10 and Hgb > 12 determine appropriateness of
anemia management, while URR measures dialysis adequacy (Swaminathan, et al.,
2012). All clinical measures are discussed in more detail at the end of this section.
For the calendar year 2011, CMS revised the QIP criteria. It removed the proportion
of patients with Hgb < 10 mg/dl, keeping the other two aforesaid criteria (Centers for
16
after the Food and Drug Administration (FDA) added a label on ESA indicating a need
for cautious use of the drug (Food and Drugs Administration (FDA), 2011). The FDA
added the label based on clinical trials reporting cardiovascular events, including stroke
and mortality, associated with the drug (Food and Drugs Administration (FDA), 2011;
Manns & Tonelli, 2012). Since the overuse of ESA has serious side effects, therefore,
Medicare decided to exclude Hgb < 10 mg/dl as a QIP criterion.
In the calendar year 2012, CMS again revised the criteria. This time, it included
three clinical measures to determine total performance scores. The clinical indicators
included, the proportion of patients with Hgb > 12 mg/dl and URR ≥ 65% and vascular
access treatment (VAT) (Centers for Medicare & Medicaid Services, 2013b; Fishbane &
Hazzan, 2012). VAT is associated with lower rates of localized infections, thrombosis
and better patient survival (Chand, Teo, Fatica, & Brier, 2008). Further, lower rates of
Hgb > 12 and higher rates of URR > 65% marks better quality (Fishbane & Hazzan,
2012). In 2012, QIP expanded its base by including pediatric, home dialysis and
peritoneal dialysis facilities.
In calendar year 2013, CMS further included six clinical and four reporting
indicators to examine the quality of dialysis facilities. Additionally, in lieu of URR, CMS
introduced three dialysis adequacy measures – percent adult hemodialysis patients with
Kt/V >1.2, percent pediatric hemodialysis patients with Kt/V >1.2 and peritoneal dialysis
patients with Kt/V >1.7 (Centers for Medicare & Medicaid Services 2013). However,
reporting on anemia management was added as a facility reporting measure (Centers for
17
It also enforced a 2% penalty on a non-conformance (Chambers, et al., 2013; CMS.gov
Centers for Medicare & Medicaid Services ; Iglehart, 2011).
2.4.2 Calculation and use of performance scores
In the calendar year 2010, Medicare compared facility performance in 2010
against its performance in 2007 or national average in 2008, whichever standard yielded a
better score. Medicare assigned a score of 10 on each measure, if a facility met or
exceeded the given standard. However, it deducted 2 points per percentage if facility fell
short of the standard. Given three measures, Hgb < 10g/dL, Hgb > 12 and URR, a facility
could attain a maximum score of 30. While, Medicare assigned a higher weight of 50% to
Hgb < 10g/dL, the other two were given a weight of 25%. In 2010, Medicare required a
facility to score at least 26 to avoid a penalty, a payment reduction of 0.5-2%.
In the calendar year 2011, Medicare compared facility performance in 2011
against its performance in 2007 or the national average in 2009, whichever yielded a
better result. An equal weight was used for both standards, Hgb > 12 and URR. The
calculated scores were multiplied by 1.5 to get performance scores ranging from 0-30.
Facilities were required to score 30 to avoid payment reductions of 0-2%.
In the calendar year 2012, Medicare compared facility performance in 2012
against its national performance rate of mid 2010-2011 (Centers for Medicare &
Medicaid Services, 2012). A performance score was assigned to facilities based on two
clinical criteria (Hgb >12 and URR) and one reporting criteria vascular access type
(fistula versus catheter). The scores ranged from 0-100. Penalties of 0-2% were applied
18
Table 2.1: ESRD quality incentive program (QIP) performance measures summary 2012-15
PY a 2012 PY 2013 PY 2014 PY 2015
Clinical indicators Hgb e > 12 g/dL
Hgb < 10 g/dL URR f > 65%
Hgb > 12 g/dL,
URR > 65% • Hgb > 12 g/dL • URR
• VAT g
Hgb > 12 g/dL
VAT Measure Topic (fistula, catheter)
Kt/V Dialysis Adequacy Measure Topic (hemodialysis, peritoneal dialysis, pediatric hemodialysis)
Reporting indicators None None
• NHSN c • ICH CAHPS d
• Mineral Metabolism
• NHSN c ICH CAHPS
• Mineral Metabolism • Anemia Management
Performance period CYb 2010 CY 2011 CY 2012 CY 2013
Performance standards Lesser of the performance rate in CY 2007 OR the national performance rate in CY 2008
Lesser of the performance rate in CY 2007 OR the national performance rate in CY 2009
National
Performance Rate (July 1, 2010 – June 30, 2011)
National Performance Rate (CY 2011)
Weights 50% Hgb < 10 g/dL 25% Hgb > 12 g/dL 25% URR > 65%
50% Hgb > 12 g/dL 50% URR > 65%
Clinical: 90%, Reporting: 10% If the facility has only one type of measure, that type is weighted at 100% of the score.
19
PY a 2012 PY 2013 PY 2014 PY 2015
Total score (min
requirement) 30 (26) 30(30) 100 (53) 100 (60)
Minimum Data
Requirements 11 cases for each measure 11 cases for each measure Facility needs either (i) 11 cases for at least one clinical measure or (ii) to qualify for at least one reporting measure.
Facility needs both (i) 11 cases for at least one clinical measure and (ii) to qualify for at least one reporting measure. Note: The 11-case minimum now also applies to reporting measures.
Low volume adjustment None None None Applied to clinical measures
with 11 – 25 cases
Source: Centers for Medicare and Medicaid Services, ESRD QIP Summary: Payment years 2012-2016
Notes:
a PY Payment year; b CY Calendar year
c NHSN National Healthcare, Safety Network
d ICH-CAHPS In-Center Hemodialysis Survey Consumer Assessment of Healthcare Providers and Systems e Hgb Hemoglobin
f URR Urea reduction ratio
20
In the calendar year 2013, CMS compared facility performance in 2013 against its
performance National performance rate of CY 2011 (Centers for Medicare & Medicaid
Services 2013). A performance score was estimated based on six clinical measures and
four reporting measures (Table 2.1). A 75% weight was assigned to clinical and 25% to
reporting measures (Center for Medicare and Medicaid Services, 2012b). The scale of
0-100 was devised. Medicare required the facility to score at least 60 to avoid penalties.
In addition to the standards and calculation details, Medicare also defined the
facility eligibility for score reporting. Before 2012, the eligible facilities included those
for which each performance measure was reported for at least 11 patients (Centers for
Medicare & Medicaid Services, 2012). In 2012, the eligibility included reporting on 11
patients for at least one clinical indicator and informing on the reporting indicator. In
2013, the total performance scores were reported for facilities that received scores on at
least one clinical and one reporting measure (Centers for Medicare & Medicaid Services
2013).
The section below includes the description and clinical significance of the recent
measures. For the calendar year, 2013 QIP scores are calculated using both clinical and
reporting measures. The clinical measures include, Hgb of >12 mg/dl, Kt/V for adult
hemodialysis, adult peritoneal dialysis patients and pediatric hemodialysis patients,
VAT-Catheter and VAT-AVF (Centers for Medicare & Medicaid Services 2013). While,
reporting measures incorporate, reporting infections to the Centers for Disease Control
and Prevention’s (CDC) National Healthcare, Safety Network (NHSN); conducting
21
(Center for Medicare and Medicaid Services, 2016b). In the calendar year 2013,
Medicare included anemia management as an additional reporting measure.
2.4.3 QIP: The ESRD Clinical Performance Measures (CPM) for calendar year 2013
The clinical rationales behind the current QIP measures are discussed here. This includes
a discussion for the inclusion, and subsequent exclusion, of low hemoglobin values as a
measuring point.
Hemoglobin levels
Anemia, or low hemoglobin levels, is the most common complication kidney
failure (Kazmi et al., 2001). The lack of erythropoietin, a renal hormone that stimulates
bone marrow for RBC production, results in anemia (Bunn, 2013). Uremia, an abnormal
urea level in blood, also contributes towards RBC destruction, production of defective
RBCs and inability of platelets to create clots at bleeding points (Bunn, 2013). These
mechanisms result in either lower RBC count and reduced hematocrit (amount of
hemoglobin in the RBC). Hgb less than 9.0-10 g/dl or hematocrit less than 33% are
associated with higher mortality among ESRD patients (Hanafusa, Nomura, Hasegawa,
& Nangaku, 2014; Hörl, 2013). Treating anemia reduces risk of stroke, cardiovascular
diseases and improve outcomes among patients (Groenveld et al., 2008; Saeed, Kousar,
Qureshi, & Laurence, 2012).
Before the introduction of bundled payment and FDA label, providers treated
anemic patients with Hgb < 10mg/dl with ESA (National Institute of Diabetes and
Digestive and Kidney Disease, 2014a). Although, ESA effectively increases the Hgb
22
hypertension; vascular thrombosis (blood clots); heart attacks; stroke and higher mortality
(Lankhorst & Wish, 2010). The risk of complications increases with the variation in level
of Hgb. Specifically, an increase of 1 g/dl in standard deviation of Hgb among ESRD
patient population is associated with a 33% increase in mortality rates (Yang et al., 2007).
Therefore, National Institute of Diabetes and Digestive and Kidney Disease (NIDDK)
disapproves the use of ESA among patients with Hgb > 11.5 mg/dl (National Institute of
Diabetes and Digestive and Kidney Disease, 2014a). The inclusion of the drug in the PPS
bundle and the relabeling by FDA about its use with caution label further restricted the
use of epoetin (Manns & Tonelli, 2012). Consequently, the Medicare excluded Hgb < 10
mg/dl from the QIP list. The clinical measures Hgb >12g/dl and URR were included in
the QIP criteria in the calendar year 2011.
Dialysis Adequacy Measures
QIP used two measures of URR ≥65% and Kt/V ≥1.2 (National Institute of
Diabetes and Digestive and Kidney Disease, 2014b). URR measures a percentage
reduction in blood urea during a single dialysis treatment. URR is measured after every
12-14 dialyses or once a month (National Institute of Diabetes and Digestive and Kidney
Disease, 2014b). A higher URR demonstrate better dialysis effectiveness. Although,
research does not indicate a definitive level of adequate URR, however, URR ≥ 65%
implicates in better survival (Port, Ashby, Dhingra, Roys, & Wolfe, 2002).
In 2013, Medicare replaced URR with Kt/V, which denotes dialyzer clearance of
urea (Centers for Medicare & Medicaid Services 2013). In Kt/V, ‘Kt’ represents dialysis
time and ‘V’ indicates the volume of urea distribution (National Institute of Diabetes and
23
body during dialysis and extra urea removed during dialysis along with excess fluid
(National Institute of Diabetes and Digestive and Kidney Disease, 2014b). The
recommended Kt/V normal values for adult and pediatric patient population is ≥ 1.2 and
peritoneal dialysis value of ≥ 1.7 (Centers for Medicare & Medicaid Services 2013). A
Kt/V of ≥ 1.2 corresponds with the URR of about 63% (National Institute of Diabetes and
Digestive and Kidney Disease, 2014b).
Research showed Kt/V ≥ 1.2 relates to lesser dialysis complications and mortality
among ESRD patients (Chandrashekar, Ramakrishnan, & Rangarajan, 2014; Greene et
al., 2005; Maduell et al., 2016). However, a systematic review of 128 articles that
included 44 laboratory outcomes yielded significant but modest effect of dialysis
adequacy on mortality compared to the other laboratory markers such as tumor necrosis
factor (TNF), pre-albumin, and C-reactive protein (CRP) (Desai, Nissenson, et al., 2009).
Vascular access treatment
Vascular access treatment (VAT) implies the site on the body that is used to
remove and return blood during dialysis (National Institute of Diabetes and Digestive and
Kidney Disease, 2014c). A perfectly functioning vascular access plays a critical role in
efficient dialysis (Pantelias, 2012). The term VAT embodies three types of vascular
access, arteriovenous fistula (AVF), an arteriovenous graft (AVG) and central venous
catheter (CVC) (Santoro et al., 2014). Compared to the others, AVF is the safest due to
lesser infections and thrombosis rates (Chand, et al., 2008; Ng et al., 2011; Pisoni et al.,
2009; Ravani et al., 2013). Most providers use a catheter at the onset of dialysis and
24
2013, Medicare included both the percentage of patients with catheter use for more than
90 days and AVF as QIP indicators.
2.4.4 QIP: The ESRD reporting measures for the calendar year 2013
Blood stream infections (BSI)
Hemodialysis increases the risk of localized infection at the vascular access site or
widespread BSIs (Patel, Kallen, & Arduino, 2010). NHSN defines BSI as “a positive
blood culture collected from a hemodialysis patient as an outpatient or within 1 calendar
day after a hospital admission”(Centers for Disease Control and Prevention, 2015). In
2014, CMS introduced BSI as a reporting indicator. Facilities reported infection events
on a given protocol to the NHSN, which established an infection surveillance system
(National Healthcare Safety Network, 2015) (Center for Disease Control and Prevention,
2015b; Medicare & Medicaid Services 2012).
The order of access type from lowest to highest risk of infections includes,
arteriovenous fistula (AVF), an arteriovenous graft (AVG) and Cardiovascular catheter
(CVC) (Fysaraki et al., 2013; Patel, et al., 2010). Incidence rates vary from 0.5-27.1/100
patients/month given the type of access used (Klevens et al., 2007). In 2008, CDC
reported 37,000 cases of BSI among hemodialysis patients with CVC access. (National
Healthcare Safety Network, 2015). BSIs result in substantial complications,
hospitalizations and deaths (Li et al., 2009; National Healthcare Safety Network, 2015;
Patel, et al., 2010; United States Renal Data System, 2013)
25
In-Center Hemodialysis- Consumer Assessment of Healthcare Providers and Systems
(ICH-CAHPS) survey
CMS designed ICH-CAHPS in support with the AHRQ to capture patient care
experiences (Cavanaugh, 2016; Darby, Crofton, & Clancy, 2006). The survey captures a
patient perspective about nephrologist communication and caring; staff communication
and caring; operations of the dialysis facility; patient knowledge of treatment options;
provider and staff handling of patient problems; and global ratings (Center for Medicare
and Medicaid Services, 2016c). In 2011, the facilities started conducting the surveys,
however, CMS included ICH-CAHPS as a reporting indicator in 2012 (Centers for
Medicare & Medicaid Services, 2013b). CMS publicly reports the survey results and
mandates facilities to conduct patient surveys twice a year. (Center for Medicare and
Medicaid Services, 2012b).
The psychometric studies on ICH-CAHPS have demonstrated excellent reliability
and validity of the survey tool to capture variation in care quality (Weidmer et al., 2014).
Further, better patient care experiences translate into higher treatment adherence, lesser
use of unnecessary care and lower cost of care (Price et al., 2014).
Mineral Metabolism
In ESRD, damage incapacitate kidneys to maintain blood phosphorus and calcium
balance, resulting in deformed bones, vascular problems and seizures (Blaine, Chonchol,
& Levi, 2014; Hruska, Mathew, Lund, Qiu, & Pratt, 2008). In the absence of kidney
functions, dialysis maintains the mineral balance. Therefore, QIP requires facilities to
measure patient serum calcium and phosphorus levels at least once a month (Center for
26 Anemia Management
To further improve the quality of care and containing the cost, CMS included the anemia
management at the facility reporting measure in 2013 (Centers for Medicare & Medicaid
Services 2013).
2.5 CONCERNS ABOUT QIP
Researchers raised concerns about QIP’s lack of focus on patient outcomes such as
patient quality of life and survival (Chambers, et al., 2013; Swaminathan, et al., 2012;
Watnick, et al., 2012) (Kliger, 2015). The program has been criticized for its narrow
focus on easy to capture clinical and reporting criteria (Moss & Davison, 2015;
Nissenson, 2013; Smith & Hayward, 2011). Further, concerns were also raised that
completing and reporting QIP data will come at the expense of provider loss of focus on
patient care (Watnick, et al., 2012). Research indicated the potential of QIP reports to
increase the disparities among ESRD patients, due to not adjusting the scores for patient
demographics and socioeconomic conditions (Casalino et al., 2007; A. W. Williams,
2015).
Despite the concerns, the data indicate QIP succeeded in improving the clinical
benchmarks (Berenson, et al., 2013). Proportion of patients having target Hgb increased
(Fuller, Pisoni, Bieber, Port, & Robinson, 2013; Molony et al., 2016). Data also show a
slight increase in use of peritoneal and home dialysis (Rivara & Mehrotra, 2014). QIP
also marked an increase in AVF use, after its inclusion as a clinical indicator in 2014. The
AVF use increased from 63% in 2010 to 68% in 2013, whereas, catheter use decreased
27
catheterization at the onset of hemodialysis (Pisoni, et al., 2015). The main reason for the
increase use of the catheter at the initiation of hemodialysis are financial and regulatory
barrier to the initial placement and revision of AVF fistula (Allon et al., 2011).
In their review of existing literature, Nissenson et al. found specific clinical
measures being weakly correlated with the patient survival (Nissenson, 2013).
Conversely, literature showed improvement in survival and reduction in hospitalization
rate in 2013 (Medicare Payment Advisory Commission (US), 2015; United States Renal
Data System, 2015). Literature also reported the decline in adverse cardiovascular
outcomes, including stroke and acute myocardial infarction in ESRD patients in 2013
(Medicare Payment Advisory Commission (US), 2015). However, a limited research
exists on association between facility QIP scores and patient outcomes.
This shows that individual clinical measure in the absence of
pay-for-performance initiative such as QIP influence care outcome differently.
Another concern regarding QIP implementation was an increased risk of
consolidation or closure among smaller and low volume facilities (Slinin & Ishani, 2013;
A. W. Williams, 2015). Initial research after the bundled payment initiative indicated
merging of smaller facilities with the larger chains (Chambers, et al., 2013). Smaller
facilities are more likely to be involved in cherry picking and stinting of required services
due to inability to offset financial risk compared to large dialysis organizations
(Chambers, et al., 2013; Medicare Payment Advisory Commission (US), 2015). This may
impact the quality of care and health outcomes among rural and isolated patients since
28
2008; Medicare Payment Advisory Commission (US), 2015; Yan, Norris, Xin, et al.,
2013).
2.6 THEORETICAL FRAMEWORK FOR ADDRESSING QUALITY
The Donabedian model provides a theoretical foundation for our work
(Donabedian, 1988). The model has been used in prior researches on ESRD care quality
(Argentero, Dell’Olivo, Santa Ferretti, & on Burnout, 2008; Y. N. Hall, Xu, Chertow, &
Himmelfarb, 2014; Himmelfarb, Pereira, Wesson, Smedberg, & Henrich, 2004; Lawson
& Yazdany, 2012). Donabedian linked structures, processes and outcomes in a continuum
to evaluate quality of care (Donabedian, 1988). His model shows structures and processes
are associated patient outcomes and quality of care.
In our research, structures include, organizational, patient and population factors
(see figure 2.1 below). The processes are the activities that help achieve clinical targets
and reporting measure ensured by CMS QIP. The outcomes are further classified into
intermediate and final outcomes. The example of intermediate outcomes includes
hospitalization ratio and transfusion ratio and of the final outcomes includes, survival
rates of patients.
2.6.1 The structure, process and outcome measures
Understanding quality requires a multidimensional paradigm. Here, quality of
care refers to QIP scores. The structures, processes and outcomes work closely in tandem
to affect quality. The section below presents the structure, process and outcome measures
29 Structures
The structure refers to the characteristics of the setting where the healthcare is
provided (Donabedian, 1988). They include administrative processes and physical
characteristics, which support the provision of care (Donabedian, 1988). A few examples
include human resources (the number of qualified health care personnel, and other health
care supporting staff); material resources (money invested and equipment used) and
organizational factors (medical staff and method of reimbursement) (Donabedian, 1988).
Structural characteristics are not necessary, but when present, increase the
likelihood of better outcomes (Hearld, Alexander, Fraser, & Jiang, 2008). These
characteristics impact care processes, which in turn influence healthcare quality. Better
health care quality improves health outcomes. The structural variables in our research
include dialysis facility resources (chain status, ownership, profit /nonprofit, total
stations, night shifts offered); dialysis types offered (in-facility vs home dialysis) and
ecological factors (percent population living below the poverty line; percent uninsured;
the education rate in the county).
Further, our study also classifies some of the patient characteristics affecting process and
outcomes. These characteristics include age; sex; race; comorbidities; the primary cause
of renal failure; insurance; location (rural/urban); distance between patient residence and
facility ZIP codes (Figure 2.1).
Process
Process refers to activities directly related to the provision of health care
(Donabedian, 1988). Healthcare processes involve healthcare providers and support staff.
30
diagnosis and treatment (Donabedian, 1966). Quality in healthcare process entails
meeting required professional standards.
Process measures have a fundamental role in understanding the variation in the
performance of the organization and health care outcomes. However, a major limitation
in examining the process is that not all processes in an organization can be captured
(Donabedian, 1966). Further, a process measure must also be related to the outcome
under study. Process measures do not ensure the outcomes, but rather increase the
likelihood of them (Donabedian, 1988). Our study includes total performance scores for
the QIP six clinical and four reporting measures as a process indicator and its relationship
with patient survival.
Outcomes
The outcome measures generally include, patient survival or mortality,
morbidities, satisfaction with care, quality of life, the cure of disease (Donabedian, 1966).
The organizational structures and processes influence patient outcomes. Further, patient
factors also underlie in the relationship between healthcare and health outcomes
(Donabedian, 1966). For instance, age, gender, race neighborhood and economic
opportunities can confound the relationship between the healthcare and cancer survival.
Further, outcomes mostly occur late in the continuum of care, making it difficult to link
the processes to the outcome, e.g. survival of cancer patients (Powell, Davies, &
Thomson, 2003). Also, multiple factors contribute towards outcomes, making it difficult
31
32
The literature emphasizes on using measurable structure, process and outcome
indicators (Donabedian, 1966; Steinwachs & Hughes, 2008). For instance, choosing
survival as an outcome of a disease that is not acutely fatal could make the study
unnecessarily long. However, using death as an outcome of fatal diseases is associated
with less bias (Kobewka et al., 2016). Therefore, researchers have assessed the quality of
ESRD care using mortality as an outcome indicator (Kobewka, et al., 2016).
ESRD patients have exceptionally high mortality rates. About 20% die annually
with a median survival rate of 38 months and five-year survival rate of 33-35%
(Kalantar-Zadeh, Kovesdy, & Norris, 2012). This makes mortality a useful indicator of
the quality of care of ESRD care.
The section below presents the ESRD literature in relation to the patient, facility
and ecological factors associated with the quality of ESRD care and patient outcomes. In
summary, a majority included facility and ecological factors or facility and patient
factors. However, research generally lacks in accounting for all three types of factors,
including, patient, facility and ecological, and even more so after the QIP
implementation. Appendix A shows the summary table of the cited articles.
2.7 FACTORS ASSOCIATED WITH ESRD CARE QUALITY
Freestanding facilities constitute 91% ESRD facilities (Medicare Payment
Advisory Commission (US), 2015). The facility factors that have been studied for
associations with quality of ESRD care include, size, ownership (profit vs. nonprofit) and
chain status (chain vs. independent) (William M McClellan, Soucie, & Flanders, 1998;
33
2011). Mostly, the researchers assessed quality using laboratory indicators, such as URR,
Hgb and AVF and albumin levels. However, we found limited data on the association
between facility factors and QIP performance scores.
2.7.1 Relationship of facility factors to QIP performance measures/scores
Recently, Zhang et al. reported a variation in QIP performance scores associated with
facility and ecological factors (Yue Zhang, 2015). However, the author mentioned not
adjusting for the patient factors as the major limitation. Almachraki and colleagues found
QIP penalties associated with the facility location. For instance, QIP penalized 6.2%
facilities in rural and 4.6% in urban areas (Almachraki et al., 2016). Similarly, facilities
in lower socioeconomic areas received more penalties(Almachraki, et al., 2016).
Adjusting for facility, ecological and patient factors, Tangri and colleagues
reported that facility factors explain 11.5% variation in URR (Tangri, Tighiouart, Meyer,
& Miskulin, 2011). The variation, however, dropped to 6.7% when adjusted for patient
case-mix. The study also found patient gender, body surface area, dialysis access type
and compliance to the treatment associated with variation in URR. In another study, Fink
et al. found that URR varied more by facility factors than individual characteristics,
23.6% vs. 11.3% (Fink, Blahut, Briglia, Gardner, & Light, 2001).
In another study, Tangri et al. reported an association between facility factors and
AVF use (Tangri, Moorthi, Tighiouhart, Meyer, & Miskulin, 2010). The variation in
AVF due to facility factors persisted even after adjusting for the patient demographics
and comorbidities. The authors identified lack of data on surgeon’s availability and
34
comorbidities and place of residence did not play a significant role in the AVF use.
Further, other researchers also indicated a significant role of facility factors in catheter
use, dialysis adequacy and anemia management (Fink, et al., 2001; Fink et al., 2007;
Pisoni, et al., 2009).
For-profit status
For-profit organizations own about 85 % renal dialysis facilities (Medicare
Payment Advisory Commission (US), 2015). The data show a rising trends in for-profit
freestanding dialysis facilities for the past two decades (USRDS 2015). The property
rights theory explains the divergence in behavior between profit and nonprofit
organizations (Valentinov, 2007). For-profit organizations pursuit for more services to
maximize profits to pay dividends to the shareholders (Valentinov, 2007). Compared
with non-profit, for-profit ESRD facilities have fewer personnel per dialysis run and
lower skilled staff (Meyer and Kassirer 2002; (Held, Garcia, Pauly, & Cahn, 1990;
Yoder, Xin, Norris, & Yan, 2013). While for-profit are able to achieve better Hgb and
URR targets than non-profit, however, no significant difference is found in patient
survival in the two types of facilities. In the case of ESRD care, most facilities are
for-profit. Further, market pressure on nonprofits, cause them to become efficient as well
(Ozgen 2002).
Studies report a higher proportion of for-profit dialysis facilities achieve clinical
benchmarks, after adjusting for the patient factors or facility and ecological factors
compared to nonprofit facilities (Griffiths et al., 1994; Hirth, Turenne, Wheeler, Ma, &
Messana, 2010; M. R. Saunders & Chin, 2013; Szczech et al., 2006; Yue Zhang, 2015).
For instance, Hirth et al. adjusted the patient case-mix to determine the aforesaid
35
facility and ecological factors, while Szczech et al. adjusted for patient and facility
factors. Saunders and colleagues reported URR associated with the status, but not the
hemoglobin levels (M. R. Saunders & Chin, 2013; Yue Zhang, 2015). Further, adjusting
for patient and facility factors, Foley et al. indicated that for-profit status implicated in
better URR, hemoglobin levels and lower use of ESA, intravenous iron, and blood
transfusions (Foley et al., 2008).
Chain status
The USRDS defines chain as “…a group of 20 or more freestanding facilities that
have been owned or operated by a corporation for one year or longer and that are located
in more than one state” (United States Renal Data System, 2014). A remarkable growth
has been seen in the chain affiliated freestanding dialysis facilities from 1988 (14%) to
2011 (91%) (United States Renal Data System, 2015).
Two large dialysis organizations account for 70% of all facilities and 75% of
treatment of Medicare patients (Medicare Payment Advisory Commission (US), 2015).
CMS defines the large dialysis organizations (LDOs) as the ones that own 200 or more
facilities. The data show a trend in the consolidation of LDOs. Between 2004-2008, six
LDOs merged into two. Further, research also showed that smaller organizations also
merged with LDOs at a higher rate after the bundle payment and QIP (Medicare Payment
Advisory Commission (US), 2015; The American Society of Nephrology, 2014).
Trend in chain affiliation has increased due to increase in number of dialysis
facilities providing outpatient dialysis as a single product (Pozniak, Hirth, Banaszak‐Holl,
& Wheeler, 2010). Although, financial insolvency is associated with consolidation,