University College London
Department of Psychology
Institute of Cognitive Neuroscience
Candidate: Manuela Piazza
Degree: Ph.D. Psychology
Supervisor: Professor Brian Butterworth
The quantifying brain: a functionai imaging
approach to subitizing, counting, and
ProQuest Number: U642406
All rights reserved
INFORMATION TO ALL USERS
The quality of this reproduction is dependent upon the quality of the copy submitted.
In the unlikely event that the author did not send a complete manuscript and there are missing pages, these will be noted. Also, if material had to be removed,
a note will indicate the deletion.
uest.
ProQuest U642406
Published by ProQuest LLC(2015). Copyright of the Dissertation is held by the Author.
All rights reserved.
This work is protected against unauthorized copying under Title 17, United States Code. Microform Edition © ProQuest LLC.
ProQuest LLC
789 East Eisenhower Parkway P.O. Box 1346
Summary
Table o f Content
TABLE OF CONTENT... 3
CHAPTER 1... 6
NUMEROSITY JUDGEMENTS...6
1. Introduction... 6
2. Numerosity judgements: a developmental overview... 7
2.1- Numerosity estimation in the non-human animal... 7
2.2- Numerosity estimation in the pre-verbal human infant... 12
2.3- The development of verbal counting: a bridge from numerosity to numerical symbols?... 13
2.4- Numerosity judgements in adults...14
3. Exact numerosity judgements in human adults: subitizing and counting... 16
3.1- Counting and subitizing: two different processes?...16
3.2- Behavioural studies... 18
3.3- Neuropsychological studies... 21
3.3.1-Impaired counting and intact subitizing... 27
3.3.2- Impaired subitizing and intact counting... 27
3.3.3- Subitizing and awareness o f spatial location: patients showing extinction...22
3.4- Functional imaging studies... 23
3.5- Models... 24
3.5.1- Pattern Recognition...24
3.5.2- FINST.... 25
3.5.3- Numerosity detector...26
3.5.4- Pre-verbal Counting... 27
3.6- Subitizing and counting -Summary... 29
4. Approximate numerosity judgements in human adults: estimation...29
4.1- Does numerosity estimation rely on an abstract “number sense”? ...29
4.2- Behavioural studies...30
4.3- Neuropsychological studies... 32
4.4- Functional Imaging Studies... 33
4.5- Numerosity estimation -Summary... 33
5. Objectives of the present thesis...34
CHAPTER II... 35
EXPERIMENT 1. ARE SUBITIZING AND COUNTING IMPLEMENTED AS SEPARATE OR FUNCTIONALLY OVERLAPPING PROCESSES? A PET STUDY... 35
1. Introduction... 35
2. Methods and materials... 36
2.1- Subjects... 36
2.3- Stimuli and procedure... 37
2.4- Imaging parameters...38
2.5- Image processing and statistical analysis... 38
2.5.7- Main Effects...39
2.5.2- Specific Effects...40
3. Results...41
3.1- Behavioural results... 41
3.2- Neuroimaging Results... 43
3.2.1- Main Effects...43
Table 1... 43
Table 2... 44
3.2.2- Specific Effects...45
Table 3... 45
4. Discussion...46
4.1- Conclusion... 50
CHAPTER III... 51
EXPERIMENT 2. ARE SUBITIZING AND COUNTING IMPLEMENTED AS QUALITATIVELY DIFFERENT PROCESS? AN EVENT-RELATED FMRI STUDY... 51
1. Introduction... 51
1.1- Limitations of the previous PET study... 51
1.2- The present study...52
2. Methods and materials... 52
2.1- Subjects... 52
2.2- Design, Task, Stimuli and Procedure... 52
2.3- Imaging parameters... 53
2.4- Image processing and statistical analysis...53
3. Results...54
3.1- Behavioral results...54
3.2- Functional imaging results... 55
3.2.1- Subitizing range... 55
3.2.2- Counting range...56
Table 4... 57
Table 5... 58
3.2.3-A single-trial measure o f posterior parietal activation...58
3.2.4- Inferring subjects’ strategies for quantifying 4 items...61
4. Discussion...63
CHAPTER IV ... 67
EXPERIMENT 3. EXPLORING THE FUNCTIONAL CORRELATES OF NUMEROSITY ESTIMATION PROCESSES... 67
1. Introduction... 67
2. Methods and materials... 68
2.1- Subjects... 68
2.2.1- Design...68
2.2.2- Stimuli...69
2.2.3- Tasks...70
2.3- Imaging parameters... 71
2.4- Image processing and statistical analysis...71
2.4.1- Modality independent effects...72
2.4.2- Modality specific effects: auditory > visual... 72
2.4.3- Modality specific effects: visual > auditory...72
3. Results...72
3.1- Behavioural results... 72
3.2- Functional Imaging results...73
3.2.1- Modality independent effects...73
Table6... 75
3.2.2- Modality specific effect: auditory > visual...76
3.2.3- Modality specific effects: visual > auditory...76
4. Discussion... 76
4.1- An amodal right hemisphere circuit for numerosity estimation... 76
4.1.1- Th£ functional implementation o f the accumulator models for numerosity estimation: a proposal...77
4.1.2- Numerosity estimation and time estimation...78
4.2- Counting: an attentional and linguistic process... 79
4.2.1- Always estimate when counting?...81
CHAPTER V ... 83
GENERAL SUMMARY AND DISCUSSION... 83
1. On subitizing and counting... 83
1.2- Inferring cognitive processes from brain activation... 85
2. On numerosity estimation... 85
2.1- Non symbolic numerosity manipulations and symbolic number processing... 86
ACKNOWLEDGEMENTS...88
ANNEX 1. SCIENTIFIC PUBLICATIONS... 89
Chapter I
Anything we know has got a number: without numbers we could neither think nor understand things.
[Filolao, VI sec. BC, fragments]
Numerosity judgements
1. Introduction
Any set of individual elements has got a number, or numerosity, and can therefore be quantified on this continuum. Numerosity is a very abstract property of a set, because it does not depend on neither the modality (visual, auditory, somatosensory, motor), nor the mode (simultaneous or sequential) of stimuli presentation, nor on their physical characteristics (colour, pitch, and so one).
The numerosity ‘two’ can be attributed to two lions in the savanna, as well as to two melodies in a song, to two ideas in a speech, two movements in a ballet, and even to one set comprising of one sound and one colour. More formally, numerosity can be defined as the only property of sets that remains invariant under substitutions of any item in the set. How does the human brain grasp and access such an abstract property of the world? To what extent language and the counting procedures are necessary for making accurate numerosity judgements? How many ways there are to determine numerosity and which are the processes involved? Which is the functional neuroanatomy of such processes? This thesis attempts the investigations of some of these questions using behavioural and different functional imaging techniques in healthy human adults.
numerosity judgements (counting, subitizing and estimation). We will structure this literature review around two main questions, that are also most relevant for the experimental work presented later. In the second, third, and fourth chapter, we will present 3 experiments that, using behavioural and functional imaging techniques, attempt to answer the previously proposed questions. Finally, in the fifth chapter, we will draw the main conclusions and indicate future development of this work.
2. Numerosity Judgements: a developmental overview
Numbers could be thought to be a very recent cultural invention in the evolution of the human species. Indeed, the use of number words and digits are part of the human specific and evolutionary recent ability to create and mentally manipulate complex symbols. However, the concept of numerosity does not seem to be as recent, as traces of sensitivity to numerical properties of the world seem to be present also in numerous non-human species as well as in babies. In this first introductory part, we will review evidences for the presence of a numerosity sensitive behaviour in our phylogenetic and ontogenetic ancestors, structuring the discussion around two main points: 1) whether non human animals and human infants are genuinely sensitive to numerosity, and what is the nature of their representation of number, and 2) whether the ability to grasp numerosity is necessary for the development of symbolic numerical competence in humans.
2.1- Numerosity estimation in the non-human animal
Once one has established that animals can represent numerosity, it is interesting to investigate the nature of such representation. In this respect, the most relevant and very well replicated behavioural finding is that, in numerosity judgements, the accuracy of the representation of a certain numerosity is proportional to its value: the higher the numerosity the larger the variability of the estimate across trials. For example, rats trained to make a certain number of lever pressing in order to get a reward always approximately produce the number of presses requested, and this approximation is such that the variability of the behaviour between trials is proportional to the mean of presses (see figure 1.1). This finding is held to reflect that representation of numerosity in animals is approximate, and not exact, and that its internal structure is organised according to the Weber’s law \ like as many other physical continua (Weber, 1834).
We will later discuss different theoretical accounts for this phenomenon.
% Numberof presses required
response
20
2 4 6 8 10 12 14 16 18 20 22 24
Figure 1.1 Distributions o f rats lever presses (in %) as a function o f number o f presses fixed by the experimenter (modified from Mechner (1958).
Number of lever presses
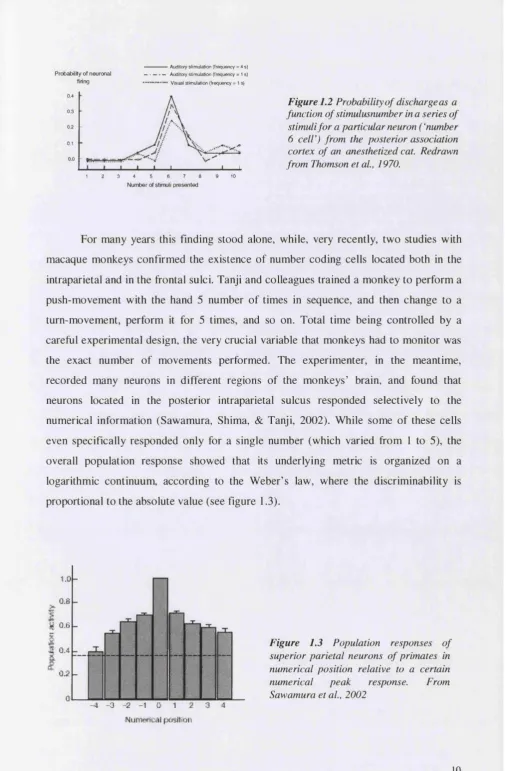
Which are the neural mechanisms that underlie animal ability to perform such complex abstract numerosity estimation tasks? The first, pioneer study that investigates elementary numerosity discrimination abilities in animals at a neuronal level dates back to the work of Thompson and colleagues (Thompson, Mayers, Robertson, & Patterson, 1970). They recorded from cells in the posterior association cortex of the anaesthetised cat (in an area that could be homologous to posterior parietal areas in monkeys and humans) and found preferential responses to a given numerosity, for instance, a sequence of three sounds or three light flashes (see figure 1.2).
Probability of neuronal firing
--- Auditory stim ulation (frequency = 4 s) • Auditory stim ulation (frequency = 1 s) Visual stimulation (frequency = 1 s) 0.4
0.3
0.2
0.1
X .
0 0 - «S.
3 7 8 9 10
1 2 4 5 6
Figure 1.2 Probability o f dischargeas a function o f stimulusnumber in a series o f stimuli fo r a particular neuron ( ‘number 6 cell’) from the posterior association cortex o f an anesthetized cat. Redrawn from Thomson et a i, 1970.
Num ber of stimuli p resented
For many years this finding stood alone, while, very recently, two studies with macaque monkeys confirmed the existence of number coding cells located both in the intraparietal and in the frontal sulci. Tanji and colleagues trained a monkey to perform a push-movement with the hand 5 number of times in sequence, and then change to a turn-movement, perform it for 5 times, and so on. Total time being controlled by a careful experimental design, the very crucial variable that monkeys had to monitor was the exact number of movements performed. The experimenter, in the meantime, recorded many neurons in different regions of the monkeys’ brain, and found that neurons located in the posterior intraparietal sulcus responded selectively to the numerical information (Sawamura, Shima, & Tanji, 2002). While some of these cells even specifically responded only for a single number (which varied from 1 to 5), the overall population response showed that its underlying metric is organized on a logarithmic continuum, according to the Weber’s law, where the discriminability is proportional to the absolute value (see figure 1.3).
1.0
Q.a >
I
W OG
I I 0.4
Ù2
Q
- 4 - 0 - 2 - 1 0 1
Num erical posltioif
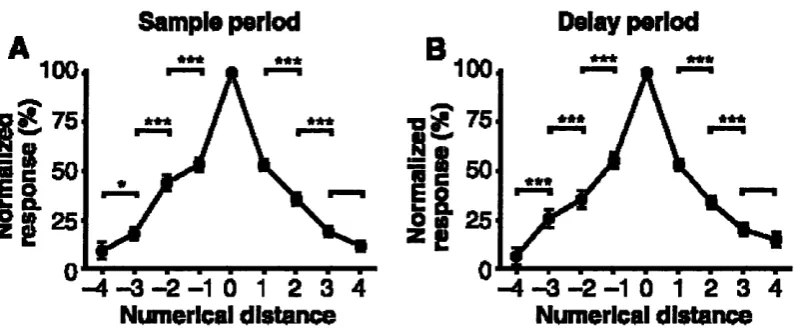
Unfortunately, however, it has to be noted that the numerical information relevant to perform the task in this study was more related to the numerical position in a sequence {ordinal number) than to the numerical quantity itself {cardinal number). Numerosity, by definition, refers to the cardinal value of a set, which is in principle different from its ordinal value (Giaquinto, 1995). Therefore, while this study represents a very elegant effort to “read” the neural code supporting the representation of number in the monkey brain, it doesn’t strictly tap on the concept of numerosity. However, an even more recent study indeed reported neurons tuned to cardinal number (Nieder, Freedman, & Miller, 2002). Macaque monkeys were trained to perform a match-to-sample task on successively presented visual displays containing between 1 and 5 randomly arranged items. During training, number was confounded with other visual parameters such as item size. However, after training, the monkeys spontaneously generalised to novel displays in which all of the relevant non-numerical variables were unconfounded, suggesting that they were attending to number. Each neuron was tuned to a specific numerosity between 1 and 5 (the maximal numerosity that was tested). A large proportion of such number-coding neurons was recorded in prefrontal cortex. The discrepancy between this localisation and the ones previously found will be briefly later discussed in chapter 4, §4.1.1. Overall, these data, confirming number-tuned neurons in the monkey brain, constitute a very strong support to the idea that animals are indeed sensitive to number.
Sample period
Delay period
***
100
100
E 75
* * *E o
4
Numerical distance
Numerical distance
2.2- Numerosity estimation in the pre-verbai human infant
As in animals, abilities to discriminate sets on the basis of their numerosity seem to be present also in human pre-verbal infants. With the classic method of habituation- recovery of looking time, both new-boms and pre-verbal human infants have been shown to discriminate sets of visual object, as well as tones, or words that differed in the number of syllables, on the unique basis of their numerosity (Antell & Keating,
(Xu & Spelke, 2000). This suggests that the mental representation of number in infants obeys to the same laws (Weber’s) that govern numerosity representations in animals and in human adults. This representation is certainly non-verbal in nature, as neither animals nor the infants tested possess a symbolic language.
What are the neural mechanisms that underlie infants’ ability to perform such complex abstract numerosity estimation tasks? Unfortunately, at present no studies investigating the neural correlates of numerosity perception in infants and/or babies has been published yet. The most probable reason for this lack of research in this field is that methodological and ethical problems make such kind of experiments particularly difficult to perform Nevertheless, it is clear that it would be extremely important to understand the neural basis of such early and pre-verbal numerical abilities.
2.3- The development of verbal counting: a bridge from numerosity to numerical symbols?
On the basis of the behavioural observation that preverbal infants and animals rely on internal representation of numbers that are governed by the same metrics (the Weber’s law), different authors have proposed that infants and animals share a common, innate mechanisms to represent numerosity, emerging from cerebral circuits that are biologically determined (Dehaene, Dehaene-Lambertz, & Cohen, 1998). Along the same line, they also propose that this mechanism serves as a fundational core of numerical knowledge, providing humans with a start-up tool to the acquisition of numerical symbols. Some of those authors also propose that this initial pre specialization will determine the brain circuits that will ultimately support high-level arithmetic in adults (Dehaene et al., 1998).
Others, on the contrary, refuse both this view of phylogenetic continuity between animal and human data, and stress the importance of verbal processing and of perceptual constraints in the emergence of the human understanding of number (Simon,
a co-ordination of domain general mechanisms for attention and language. At present, no data unambiguously refutes one or the other hypothesis. However, some straightforward contrasting predictions could be drawn from two such different views:
1) According to the first view, children who are particularly impaired in numerosity judgements should show impaired acquisition of counting and of numerical principles, while according to the second view, only children with impairment in language and/or perceptual processes should later show impaired acquisition of counting and of numerical principles. To our knowledge, these predictions have not been directly contrasted yet. 2) According to the first view, in healthy adults, brain regions that are necessary for performing numerosity tasks (representing a core numerical quantity system) should also be involved in symbolic numerical tasks, like counting, number comparison, and even arithmetic. According to the second view, this should not be the case. In chapter 5 we present a study that indirectly tests these predictions.
Despite the still open debate on the existence of an hypothesised numerosity specific module which would ground the ontogenesis of numerical knowledge, there is consensus on the fact that it is via learning how to count that the knowledge of numbers as abstract symbols for numerosity emerges. During the development, mastering the counting principles takes a relative long time (Wynn, 1992). During this process, children have first to learn a set of symbols (number words), and then understand that those symbols are to be used in a certain fixed order. Moreover, they need to understand (non necessarily in an explicit form) four basic principles: 1) the cardinal value principle: the last count word used represents the numerosity (cardinal value) of the set; 2) the order irrelevance principle: it does not matter the order one counts the objects in a collection; 3) the abstractness principle: it does not matter the nature of the objects to be counted; and 4) the one-to-one correspondence principle: each number word needs to be put to a one-to-one correspondence with each to-be-counted item (Gelman & Gallistel, 1978)(Gelman & Meek, 1983, 1986). Mastering the counting procedure, therefore, is essential to build a sohd concept of numbers as symbols for numerical quantities and their governing principles.
2.4- Numerosity judgements in aduits
the human adult, while this ability to make approximate, non-verbal estimations of numerosity is still present, the acquisition of a symbolic system - such as counting words - allows performing exact numerosity judgements, via counting. Overall, three main different types of numerosity judgements have been described in human adults: subitizing, counting, and estimation. We will briefly consider them in turn, and present those that, in our view, are the two main still open questions related to quantification processes in human adults.
Subitizing refers to the quantification o f very small sets of elements. When subjects quantify small sets of visual stimuli, by responding to the question “how many are there?”, their performance is extremely accurate and fast, increasing very little as the number of object increases. While such extreme speed of identification of small numerosities has been observed since the end of the 19^^ century (Cattell, 1886; levons, 1871), the term “subitizing” (from the Latin adverb “subito” = suddenly) has been introduced by Kaufman and collaborators more than 50 years later (Kaufman, Lord, & Reese, 1949). Initially, this term referred to the rapid and accurate report of up to 6 or 7 items. With the advent of more accurate chronometric techniques, however, it was recognised that performance in the 4-7 range was linearly decreasing, and was therefore attributable to a serial counting process. However, in the 1-3 or 4 range, data seemed to suggest that quantification is indeed carried out by a special procedure which differ from serial counting, as reaction times increase very little (from 5 to 20ms, depending from different experimental conditions) and performance is at ceiling. Thus, the word subitizing is now used to define quantification in such 1-3 or 4 range, in opposition to counting.
Counting is the operation used in quantifying large sets of more then 3-4 items. It involves language and the application of a serial one-to-one operation between each individuated item and a particular sequence of number words. The time taken to count sharply increases up to 200 ms per items, and performance becomes error prone. The apparent discontinuity in performance around 3-4 items suggested that counting is a qualitatively different process from subitizing. However, this is still a matter of debate, as will be discussed in session 3.
linguistic system. However, questions remain on whether numerosity estimation abilities emerge from an abstract system specific for numerosity or it is based on different modality specific systems that only rely on perceptual information. This will be discussed in session 4.
Studies on quantification processes in adults have mainly focused, in our view, around two main questions: 1) Are subitizing and counting two qualitatively different and separate processes? 2) Does numerosity estimation rely on an abstract “number sense”? Therefore, in this section, the review o f the literature on numerosity judgements is subdivided according to these questions.
3. Exact numerosity Judgements in human adults:
subitizing and counting
In this session we review the relevant literature in the attempt to investigate cognitive and neural correlates of subitizing and counting.
3.1- Counting and subitizing: two different processes?
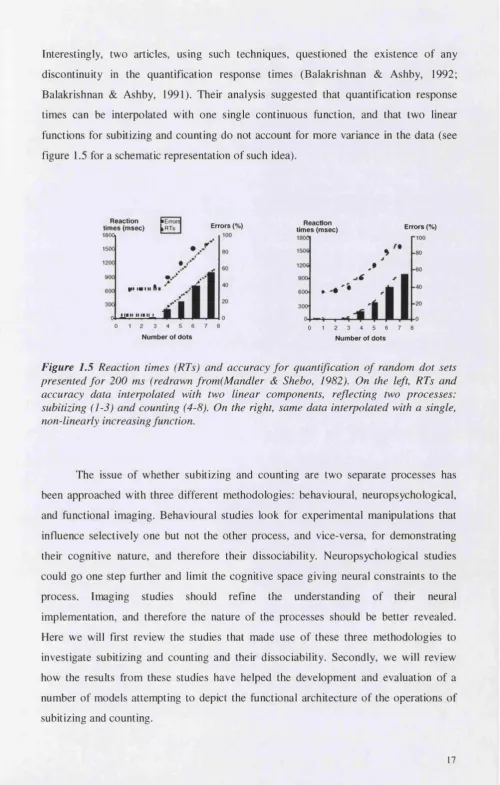
Interestingly, two articles, using such techniques, questioned the existence of any discontinuity in the quantification response times (Balakrishnan & Ashby, 1992; Balakrishnan & Ashby, 1991). Their analysis suggested that quantification response times can be interpolated with one single continuous function, and that two linear functions for subitizing and counting do not account for more variance in the data (see figure 1.5 for a schematic representation of such idea).
Reaction hE times (msec) Lr 1800,
Errors (%)
#111 # I
! ! ■ II II !■ l l _ l
Reaction
Errors (%) times (msec)
Number of dots
0 1 2 3 4 5 6 7
Number of dots
Figure 1.5 Reaction times (RTs) and accuracy fo r quantification of random dot sets presented fo r 200 ms (redrawn from(Mandler & Shebo, 1982). On the left, RTs and accuracy data interpolated with two linear components, reflecting two processes: subitizing (1-3) and counting (4-8). On the right, same data interpolated with a single, non-linearly increasing function.
3.2- Behavioural studies
The main experimental manipulations that affect counting but not subitizing relate to: 1) ocular movements; 2) spatial arrangement of the items; 3) homogeneity of the array, 4) attentional focus in space, and 5) verbal short-term memory load.
Ocular Movement. The control of ocular movement is typically used to show the influence of attentional shift in space over the process of interest. In enumeration experiments, eye movement suppression (by shortening exposure times under 150 ms, the time for a saccade, or by presenting the stimuli in the form of afterimages) results in reduced reaction times in both subitizing and counting, and decreased accuracy in counting only, leaving subitizing flawless (Atkinson, Campbell, & Francis, 1976; Atkinson, Francis et al., 1976; Simon & Vaishnavi, 1996). This result suggests that eye movements are needed to obtain accurate performance in counting more then 4 items, while they are not needed in subitizing, for which covert attention is sufficient.
Spatial arrangement o f the items. When the elements in the visual array are arranged so that they form symmetric geometrical shapes (like, for example, in dice layout, which is normally defined as “canonical” layout), or when group of chunks of 2- 3-4 items are close together in space, counting is facilitated compared to condition in which the elements are all equi-spaced or randomly arranged (Atkinson, Campbell, & Francis, 1976; Mandler & Shebo, 1982). Subitizing, on the contrary, is not facilitated by either of these manipulations. See figure 1.6 for examples of different spatial arrangements.
Example of Canonical arrangemet Example of Random arrangement Example of Grouped arrangement
Figure 1.6 Example o f different spatial arrangements o f the dots used in different studies. Manipulating the spatial arrangement has an effect on counting but not on subitizing.
arrays of different items (heterogeneous) are counted much faster and accurately than arrays of identical items (homogeneous) (Frick, 1987). Subitizing, on the contrary, is not affected by this manipulation. Heterogeneity helps in both individuating items to be counted, and in assigning spatial tags to keep track of already counted ones, and this manipulation shows that that these operations are crucial in counting, but not as much in subitizing.
Attentional focus. When the locations at which the dots will be presented are pre-cued (say, by the appearance of a coloured rectangles in the appropriate locations), counting is facilitated, while subitizing is not (Trick & Pylyshyn, 1993). Moreover, when the location cues are invalid (i.e., they do not predict the location of the dots), counting is impaired while subitizing is not. This shows that the attentional focus is needed in counting but not in subitizing.
Verbal short term memory. Counting has also shown to be influenced by a concurrent articulatory task. Subjects repeating an irrelevant speech sound as “...the the the..” showed substantial disruption in counting accuracy (Logie & Baddeley, 1987). Unfortunately, the authors did not discuss the impact of articulatory suppression on subitizing. Visual inspection of their graph, though, seems to show that the RTs started increasing for the suppression condition at around numerosity 6. This suggests that verbal working memory plays a fundamental role in counting but a less relevant one in subitizing.
U r -c L C L
r L c U L U U
^ Lc ""U L U c
A. E m bedded figures display B. Conjunction search display
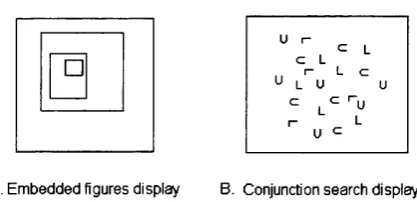
Figure 1.7 Example o f two cases in which there is no evidence o f dichotomy in performance between subitizing and counting. A. When the objects are embedded one in the other, and B. In conjunctive search displays, where the task is to quantify, fo r example, the number o f '‘tilted U* among "L ”, "U ” and "tilted U ’\
3.3- Neuropsychological studies
The presence of a double dissociation between counting and subitizing in brain damaged patients would be strong evidence for the existence of two distinct processes. However, the evidence for a double dissociation is unconvincing in the literature.
3.3.1- Impaired counting and intact subitizing
This dissociation is revealed in a study of a group of patients with simultanagnosia. Simultanagnosia is a deficit of the visual perception of conplex scenes, with preserved recognition of individual objects, usually following bilateral parietal lesions (Balint, 1909; Coslett & Saffran, 1991; Hécaen & Ajuriaguerra, 1954). These patients usually fail to perceive a scene as a whole and report only one item at a time. Dehaene and Cohen ran a systematic conç>uter-based testing of these patients showing that, while extremely impaired in counting, they could still subitize up to 2 or 3 objects (Dehaene & Cohen, 1994). Interestingly, those patients showed a good performance in a classic visual conjunction search task, (Treisman & Gelade, 1980) in that they explored all the visual display without missing any item. This suggests that the deficit in counting was not due to an impaired visual exploration of the set, but to the inability to keep track of the previously explored spatial location. The operation of spatial tagging, which is supported by parietal circuits, is more essential in counting than in subitizing.
3.3.2- impaired subitizing and intact counting
pointing (Cipolotti, Butterworth, & Denes, 1991). However, in this study, the investigators were not able to use conçuter-controlled presentation of dots, and the patient's counting limit was 4, since she could not recall numbers above 4. These data are not conclusive with respect to the neural dissociability o f subitizing and counting processes.
3.3.3-
Subitizing and awareness of spatiai location: patients showing
extinction
Some neuropsychological data suggest that subitizing does not depend on awareness of objects' location in egocentric space. For instance, three patients showing extinction were tested by Vuilleumier and Rafal (Vuilleumier & Rafal, 1999; Vuilleumier & Rafal, 2000). Extinction is a deficit (following right parietal lesions) for which a stimulus presented in the contro-lesional hemifield is not spontaneously attended when it is associated with another contemporary stimulus in the ipsi-lesional hemifield. With the same set of stimuli and exposure times, such patients were asked to perform two different tasks: an enumeration task and a spatial location task. Stimuli were visual objects briefly presented in the left, right, or both hemifields, and varied in term of numerosity: a single object or two objects, in either one or both the hemifields, resulting in a total of 1, 2, or 4 objects in the visual field. Patients were able report the number of items, but unable to consciously report the localization of the objects in the contro-lesional space when the ipsi-lesional space was concurrently stimulated. This result confirms previously discussed chronometric data that the ability to explicitly localise object in space is dissociable from the ability to subitize. It is worth noticing, however, that that particular spatial arrangement of objects -symmetric and with familiar shapes, such as horizontal line or square- could have transformed the counting task in an object recognition task (Mandler & Shebo, 1982). The way to control for this possibility should be to present the items in a more random arrangement, or all in a line.
Still, as for the behavioural case, neuropsychological literature failed to give evidence for the separability of the two processes: no specific neuropsychological deficit is found to affect subitizing selectively, leaving counting spared. One way to further investigate the neural circuits involved in the two processes and therefore clarify their nature, is the use of functional imaging techniques.
3.4- Functional imaging studies
Results from functional imaging studies suggest that subitizing and counting are not dissociable at the neuroanatomical level, but do not unambiguously solve the problem of the nature of the two processes. One PET (Positron Emission Tomography) study made use of a visual search-type of display, consisting of 16 bars, containing 1 to 9 vertical bars in a variable number of horizontal bars (Sathian et al., 1999). The task consisted of reporting the number of vertical bars. Similar types of visual search display had previously been used to investigate subitizing, and they seemed to elicit the typical RTs slope of subitizing (Trick & Pylyshyn, 1993)^. The results showed that counting, relative to subitizing, activated a widespread network of brain regions comprising bilateral middle occipital and superior parietal, and right frontal regions. On the other hand subitizing, relative to single target detection, activated foci solely in the middle occipital extrastriate cortex. This was interpreted as supporting the idea that subitizing is a preattentive process, while counting is a qualitatively different serial process that involves shifting visual attention. However, interpretation of the results is not straightforward, since counting and visual search operations were confounded; moreover, the total number of elements in the display was held constant, and therefore the ratio between targets and distractors increased with the number of targets to be counted. This means that the perceptual salience of the targets was not matched in the subitizing (1-4) and counting (6-9) conditions, and so the attentive effort to isolate targets from the background may have led to brain activation that could not be strictly related to enumeration processes.
Another PET neuroimaging study made use of numerosity matching task, where subjects had to compare the numerosity of a visual array to 4 (Fink at a l, 2001). Results show that numerosity matching was associated with striate, extrastriate, and inferior
frontal activation. This result was interpreted as evidence for subitizing as a preattentional visual parallel process. However, the matching task used could in principle be performed on the basis of information that is perceptual rather than numerical. Subjects could have deployed strategies such as matching the sets in terms of brightness, density and occupancy, which were not controlled in the display. This could explain the involvement of visual areas for numerosity matching.
In summary, functional imaging data on the dissociability between subitizing and counting are very sparse. Subitizing seems to be characterised at the neural level by activity restricted to the extrastriate occipital cortex, while counting seems to recruit a much larger network of regions. This might reflect a pre-attentive/attentive dichotomy of the two processes. Nevertheless, due to the nature of the task and stimuli used, results from previous studies can not be considered conclusive with respect to the question of the neural dissociability of the two processes of subitizing and counting.
3.5- Models
Many models have been suggested to account for the apparent dichotomy subitizing/counting. These models can be classified into two groups: “domain general” and “domain specific”. Domain general models held that subitizing reflects some general properties of visual perception that are not specific to the number domain, and they are “the pattern recognition” and “FINST” models. Domain specific models held that subitizing reflects mental processes and representations that are specific to numerosity and consist in numerosity estimation. Those are the “accumulator”, and the “numerosity detector” model.
3.5.1- Pattern Recognition
performance mirrors the cases of randomly arranged displays. Still, there remains an open possibility that subitizing is performed by a recognition of a “canonical” array only in the cases where items are NOT arranged in a row, but are randomly spread. However, this account would need to be integrated in a broader theory in order to account for the entire set of data.
3.5.2- FINST
shift of spatial attention (i.e., parietal regions) result in impairment in counting but not (or less) in subitizing.
3.5.3- Numerosity detector
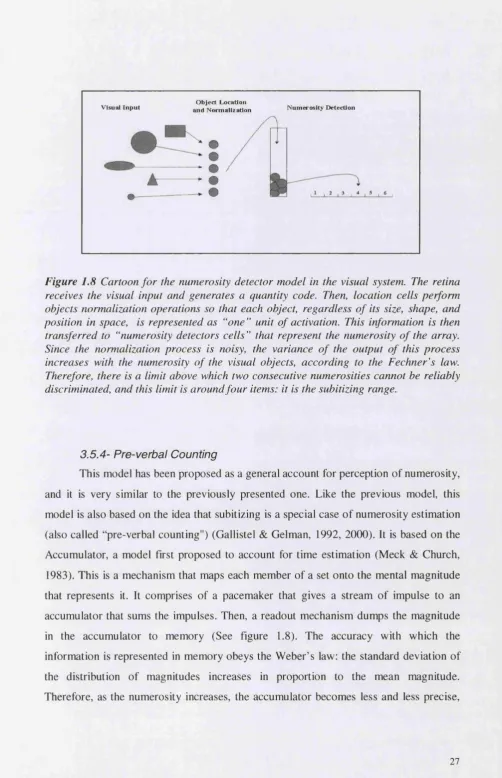
This model bas initially been proposed to account for infants’ and animals’ abilities to discriminate and compare numerosities in the visual domain, even if, in principle, it could be extended to the other domains as well. The core idea is that subitizing is a form of very efficient numerosity estimation (Debaene & Cbangeux,
v is u a l In p u t a n d N orm alizatio nO b ject L ocation N u m ero sity D etection
Figure 1.8 Cartoon fo r the numerosity detector model in the visual system. The retina receives the visual input and generates a quantity code. Then, location cells perform objects normalization operations so that each object, regardless o f its size, shape, and position in space, is represented as ‘'one ” unit o f activation. This information is then transferred to “numerosity detectors cells” that represent the numerosity o f the array. Since the normalization process is noisy, the variance o f the output of this process increases with the numerosity o f the visual objects, according to the Fechner's law. Therefore, there is a limit above which two consecutive numerosities cannot be reliably discriminated, and this limit is around four items: it is the subitizing range.
3.5.4- Pre-verbal Counting
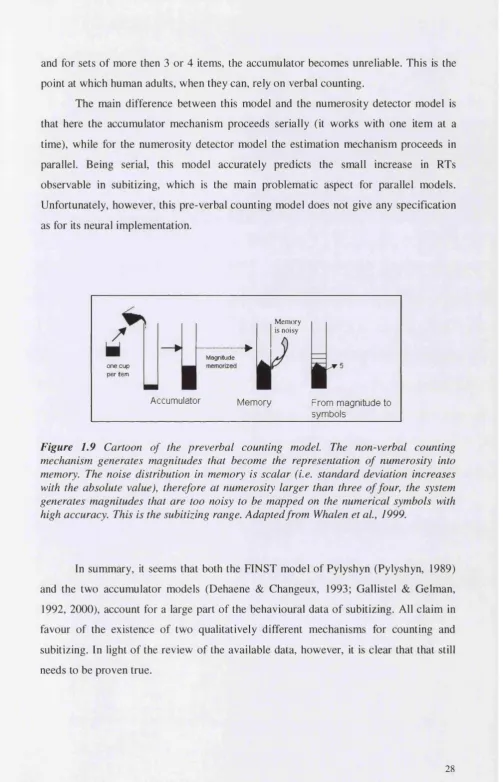
and for sets of more then 3 or 4 items, the accumulator becomes unreliable. This is the point at which human adults, when they can, rely on verbal counting.
The main difference between this model and the numerosity detector model is that here the accumulator mechanism proceeds serially (it works with one item at a time), while for the numerosity detector model the estimation mechanism proceeds in parallel. Being serial, this model accurately predicts the small increase in RTs observable in subitizing, which is the main problematic aspect for parallel models. Unfortunately, however, this pre-verbal counting model does not give any specification as for its neural implementation.
o n e cu p p er item
Magnitude
I
Memory is noisy
Accum ulator Memory From magnitude to
symbols
Figure 1.9 Cartoon of the preverbal counting model. The non-verbal counting mechanism generates magnitudes that become the representation o f numerosity into memory. The noise distribution in memory is scalar (i.e. standard deviation increases with the absolute value), therefore at numerosity larger than three o f four, the system generates magnitudes that are too noisy to be mapped on the numerical symbols with high accuracy. This is the subitizing range. Adapted from Whalen et ai, 1999.
3.6- Subitizing and counting -Summary
Behavioural, neuropsychological, and imaging data show evidence that counting is a complex operation that requires the co-ordination of the attentional focus to locate and mark objects in space and a sub-vocalisation process to update the running total in the phonological store. Subitizing, on the contrary, seems to be an operation that has minimum requirements to both the attentive visuo-spatial and the linguistic systems. One of the proposed models that accounts for the majority of such data suggests that subitizing is based on a pre-attentive ability of the visual system to keep track of multiple objects in parallel, while counting necessitates spatial attention. However, it is still not clear whether the engagement of spatial attention is a continuous function of the number of items to be enumerated even in the subitizing range, or it represents a real qualitative difference between subitizing and counting. A double dissociation in neuropsychological studies between subitizing and counting has not been described yet, and this would the strongest proof of a qualitative distinction between the two processes. In chapter 2 and 3 we present two studies that use brain activation techniques in the attenpt to solve this question.
4. Approximate numerosity judgements in human
aduits: estimation
When humans are unable to use language and therefore counting, they still show some ability to perform judgements of numerosity, by estimation. The most striking feature of numerosity estimation judgements in humans is that it is almost identical to performance of other animals is similar tasks (see figure 1.10). Such performance is characterised by the fact that both the mean estimate and its variability are proportional to target value, suggesting that the internal representation of numerical magnitudes is organised on a logarithmic continuum. This similarity has led many authors to hold the idea that humans share with non verbal animals a system for representing numerosity.
4.1- Does numerosity estimation rely on an abstract “number sense”?
estimation (Church & Meek, 1984; Gibbon, 1977). These models (see the numerosity detector and the accumulator models, in §3.5.3 and §3.5.4., respectively) hypothesise the existence of an internal xmm&xosiiy-accumulator system (Dehaene & Changeux, 1993; Meek & Church, 1983) which is thought to transform objects and/or events into “abstract” items to be accumulated, irrespective of stimulus modality (visual, auditory, motor), mode (simultaneous or sequential), and physical characteristics (shape, position in space, duration, etc). The outputs of the accumulator are abstract magnitudes that are transferred into working memory, where they represent numerosity. In the final comparative decision stage, the actual magnitudes in the accumulator are compared with the stored magnitude in working memory, and a response is generated.
Many questions remain, however, regarding the nature of this representation and the processes that are used to construct it. In fact, a truly abstract representation of numerosity would apply to any set of discrete elements, whether events or objects, homogeneous or heterogeneous, simultaneous or sequential. Yet numerosity estimation is consistently found to be influenced by sensory properties of the stimulus, such as, for example, visual regularity. In both visual and auditory arrays, the presence of certain regularities influence the perception of numerosity. For example, the density and the grouping patterns of large visual arrays affect the numerosity judgements. Because of these perceptual influences, some explain numerosity estimation in terms of modality- specific perceptual process (e.g. texture perception for visual arrays), or in terms of processes specific to stimuli in certain formats (e.g. timing mechanisms for temporally distributed elements). For exan^le, some con^utational models of human visual numerosity estimation predict human performance quite accurately, though they perform the numerosity judgement based on the detection of some physical stimulus properties such as area and density, which can be correlated with, but are not equivalent to numerosity (Allik & Tuulmets, 1991; Vos, van, Tibosch, & Allik, 1988). However, there is some evidence that seems to support the existence of an abstract non verbal representation of numerosity, even if the number of studies conducted in this domain are, unfortunately, still very few. Again, we group them according to the methodology used: behavioural, neuropsychological, and neuroimaging.
4.2- Behavioural studies
literature, and follow two lines of research: (1) disentangling numerosity judgements from other judgements on possible co-varying factors, and (2) investigating the judgement of numerosity between different modality (e.g. visual and auditory) and mode (e.g., simultaneous vs. sequential) of stimulus presentation. (1) On one side, some studies systematically compare estimation of numerosity with estimation of other physical variables of the same set (e.g. time, for sequentially presented stimuli) that co- vary with numerosity. If numerosity estimation is performed on the basis o f the estimation of the physical variable considered, performance in the estimation of the physical variable should account for performance on numerosity. In this logic, Whalen et al. (Whalen et al., 1999) presented numbers between 7 and 25 on a computer screen, and asked subjects to press a button as fast as they could until they had felt they had made approximately the indicated number of button presses. Results showed that both the mean estimate and its variability were proportional to target value, and the coefficient of variation (the ratio of the standard deviation and the mean) was constant across target size. These data perfectly mirror animal data (see figure 1.10). Then, in order to control if subjects relied on time estimation, they asked them to reproduce a time interval that was of the same order of the total key-presses. The coefficient of variation was then calculated and used to measure the precision of the judgement of time. Its value was much greater than the one found for the variation of the numerosity judgement, showing that subjects did not rely on estimated duration rather then on estimation of numerosity. Very similar results were found when subjects were presented with sequences of tones at a very fast rate, and had to estimate their number. Time estimation over the same stimuli did not account for numerosity estimation performance. In order to confirm the generality of such results, these manipulations should be systematically done also using simultaneously presented items.
intra-modal and intra-mode comparisons, which strongly suggests that adults’
numerosity estimation is based on abstract representation o f number. Nevertheless, this
line o f research is just at its beginning, and we will be able to conclude in favour o f this
hypothesis only after having collected a larger amount o f evidence.
(a) 0 ,3
0,2
0,1
0
q> N
N = 4
N = 8
N = 12
N = 1 6
(b) (c)
30
20 .
S
10
-0.1
.,.4 30
20
10
0
0.30
S 0.15
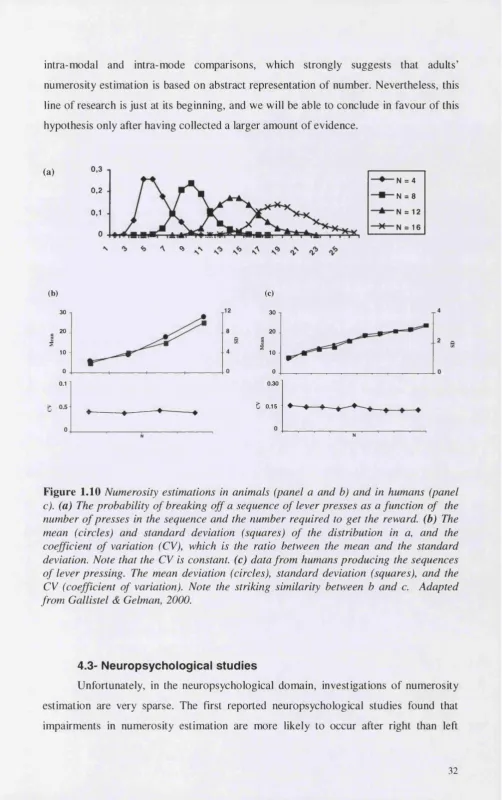
Figure 1.10 Numerosity estimations in animals (panel a and b) and in humans (panel c). (a) The probability o f breaking off a sequence of lever presses as a function of the number o f presses in the sequence and the number required to get the reward, (b) The mean (circles) and standard deviation (squares) o f the distribution in a, and the coefficient of variation (CV), which is the ratio between the mean and the standard deviation. Note that the CV is constant, (c) data from humans producing the sequences of lever pressing. The mean deviation (circles), standard deviation (squares), and the CV (coefficient o f variation). Note the striking similarity between b and c. Adapted from Gallistel & Gelman, 2000.
4.3- Neuropsychological studies
Unfortunately, in the neuropsychological domain, investigations o f numerosity
estimation are very sparse. The first reported neuropsychological studies found that
hemisphere damage (McFie, Piercy, & Zangwill, 1950). Later it was shown that the right parietal lobe was the only locus relevant for estimation performance (Warrington & James, 1967), since, out of a pool of subjects with lesions in the three lobes of the two hemispheres, only the group with lesions in the right parietal were impaired at numerosity estimation. Indeed, a right hemisphere superiority in numerosity estimation was replicated using unilateral tachistoscopic presentation of stimuli to normal subjects (Kimura, 1966 ; Kosslyn et a l, 1989; McGlone & Davidson, 1973; Young & Bion, 1979), but the specificity of parietal structures has never been further investigated. Moreover, is worth noticing that the procedures used in all the aforementioned neuropsychological experiments show some problematic aspects:
1) stimuli always consisted of simultaneous, very brief, visually presented items; no other modality (auditory, or motor) or mode (sequential) of presentation was tested. This prevents any conclusions on the issue of whether numerosity estimation is an a- modal process, and whether the individuated neural substrate reflects this a-modal nature.
2) tasks involved the production of a number word. This could be problematic for investigations of non-verbal estimation because it is possible that subjects, having to generate a numerical result, may have used arithmetical strategies that depended on number symbols (such as counting by groups). In this sense, this procedure is not comparable with other studies in animals and infants in which no symbolic output is required, and where estimation is tested by means of con^arison between numerosities. Clearly, a more systematic exploration of number estimation abilities in brain lesioned patients should be pursued, using different modality and mode of stimulus presentation.
4.4- Functional Imaging Studies
To date, no functional imaging study of numerosity estimation has been published yet.
4.5- Numerosity estimation -Summary
of such numerosity estimation in healthy human subjects using fMRI, in order to localise this process and to compare the brain regions involved in estimation with the ones involved in exact counting.
5 .
Objectives of the present thesis
As seen in the previous literature review, although much work has been done to understand the mechanisms involved in numerosity judgements in the human adults, still some unanswered questions remain.
With respect to counting and subitizing, data reviewed are still not able to determine whether the two processes are indeed qualitatively different, or whether they simply lie on a continuum of difficulty. We approached this problem in two steps: first, we investigated whether the two processes are implemented in separable regions in the brain using PET; then, using event related fMRI, we investigated whether they emerge from a qualitatively different recruitment of a set of relevant brain regions.
Chapter II
Experiment I, Are subitizing and
counting implemented as separate or
functionally overlapping processes? A
PET study
1. Introduction
To ensure that the outcomes could be interpreted straightforwardly in terms of the normal behavioural results (unlike the previous imaging studies on subitizing processes, see chapter 1, §3.4), we used stimuli that are standardly used in enumeration tasks - black dots on a white background, that subjects had to quantify by saying aloud their answer.
2. Methods and materials
2.1- Subjects
Nine right-handed English speaking male volunteers (mean age 29, age range 22-45) with no history of neurological disorders gave informed consent to participate in 12 consecutive measurements of rCBF using PET. One subject suffered cramps during the acquisition of the 7* scan, and only 6 scans (out of 12) were included in the analysis. The study was approved by the local hospital ethics committee and the Administration of Radioactive Substances Advisory Committee (UK) (ARSAC).
Canonically arranged dots
# e
# e
Randomly arranged dots 0
e
• •
Figure 2.1 Examples o f canonical and random arrangements o f dots presented for auantificatioru for numerosity 4 and 8.
2.2- Design and task
The experiment comprised a 2x2 factorial design with two baseline conditions. The variables manipulated were: (i) numerosity of dots, that had two levels: subitizing range (1-4 dots), and counting range (6-9 dots), and (11) spatial arrangement of dots,
possible, the number of dots presented. Responses were recorded using a microphone and used to measure RTs and accuracy.
The baseline conditions conprised of one baseline for the subitizing range, and one for the counting range. The former consisted of the presentation of one single dot, to which subjects were asked to respond with the word "one". The latter consisted of a combination of two different scans: in the first the stimulus always consisted of the same display of six dots, and the subjects were asked to simply respond with the word "six" without performing any counting; in the second baseline scan the stimulus was always a display of nine dots, and subjects were instructed to respond with the word "nine" without counting. These baseline conditions were included in order to control for the visual stimulation on the two numerosity ranges (1-4 and 6-9), and for verbal production, and auditory processing, even though the visual stimulation was not completely controlled in the case of the 1-4 range. Instructions were given prior to each scan.
2.3- Stimuli and procedure
Stimuli in all conditions consisted of black dots (0.36 deg.) on a white background, arranged on a virtual 32-space matrix that subtended a visual angle of 2 deg., and were presented at the centre of a 13-in. video monitor of a Macintosh computer 7200/90. For each subject, 12 scans were acquired, 8 for the experimental tasks, and 4 for the baseline tasks in a pseudorandom order.
period preceding and following it. Non-crucial stimuli (e.g. 6-9 dots for the subitizing range condition) were randomly chosen from the other non-crucial conditions. For the baseline conditions, no non-crucial trial was presented, and therefore the probability of occurrence of the crucial stimuli was 100% through the whole scan.
2.4- Imaging parameters
The 12 PET scans were obtained using a SIEMENS/CPS ECAT EXACT HR-k (model 962) PET scanner (Siemens/CTI, Knoxville, TN, USA). Participants received a 20s intravenous bolus of H2150 at a concentration of 55 Mbq ml -1 and at a flow rate of 10 ml min -1 through a foreham cannula. Images were reconstructed by filtered back projection into a 128 x 128 x 63 image matrix (voxel size 2.1 x 2.1 x 2.4 mm) using measured attenuation correction. For each subject, a T1-weighted structural magnetic resonance (MR) image was obtained with a 2 Tesla Magnetom VISION scanner (Siemens, Erlangen, Germany).
2.5- Image processing and statisticai anaiysis
2.5.1- Main Effects
1. Effect of Task: The Quantification System
Areas more activated during a quantification task (enumeration), irrespective of numerosity and arrangement of dots, were identified with a contrast of all the experimental conditions (1-4 canonically arranged dots, 6-9 canonically arranged dots, 1-4 randomly arranged dots, 6-9 randomly arranged dots) versus the baselines conditions (a single dot, and 6 dots, or 9 dots). In these areas, we report Z values for all the simple effects separately.
2. Effects of Numerosity on Quantification
a) Activation for enumerating 6-9 dots versus 1-4 dots, irrespective of arrangement
Areas more activate for enumerating 6-9 dots irrespective of arrangement were identified with a conjunction (Price & Friston, 1997) of two contrasts: 6-9 randomly arranged dots > 1 - 4 randomly arranged dots, and 6-9 canonically arranged dots > 1 - 4 canonically arranged dots. In addition, to control for visual input, we used the inclusive masking option in SPM to mask the conjunction with contrasts 6-9 random > 6-9 baseline and 6-9 canonical > 6-9 baseline.
b) Activation for enumerating 1-4 dots versus 6-9 dots, irrespective of arrangement
The same procedure was used to identify areas more activate in enumerating 1-4 dots than 6-9 dots, irrespective of arrangement. Contrasts 1-4 random> 6-9 random, and 1-4 canonical > 6-9 canonical were combined using conjunction analysis masking with contrasts (1-4 random > 1-4 baseline) and (1-4 canonical > 1-4 baseline).
3. Effects of Spatiai Arrangement on Quantification
a) Activation for canonical versus random arrangement, irrespective to numerosity
b) Activation for random versus canonical arrangement, irrespective to numerosity
The same procedure was used to identify areas more activate for the random arrangement than the canonical irrespective of number of dots. Contrasts 1-4 random > 1-4 canonical and 6-9 random > 6-9 canonical were combined using the conjunction analysis and the result was masked with contrasts 1-4 random > 1 - 4 baseline and 6-9 random > 6-9 baseline.
2.5.2- Specific Effects
1. Effects specific for 6-9 dots randomiy arranged (counting)
The inclusive masking option was used to identify the areas that were more active for 6-9 randomly arranged relative to 6-6-9 canonical (at p. < 0.05 corrected); masked (at p<0.001 uncorrected) with 6-9 randomly arranged relative to (i) 6-9 baseline; (ii) 1-4 random; and (iii) the numerosity by arrangement interaction.
2. Effects specific for 6-9 dots canonicaiiy arranged
6-9 canonically arranged were contrasted with 6-9 randomly arranged (at p. < 0.05 corrected) and masked (at p<0.001 uncorrected) with 6-9 canonically arranged relative to (i) 6-9 baseline; (ii) 1-4 canonical; and (iii) the numerosity by arrangement interaction.
3. Effects specific for 1-4 dots randomiy arranged
1-4 randomly arranged relative to 1-4 canonical (at p. < 0.05 corrected) was masked (at p<0.001 uncorrected) with 1-4 randomly arranged relative to (i) 1-4 baseline; (ii) 1-4 canonical; and (iii) the numerosity by arrangement interaction.
4. Effects specific for 1-4 dots canonicaiiy arranged
1-4 canonically arranged relative to 1-4 random (at p. < 0.05 corrected) was masked (at p<0.001 uncorrected) with 1-4 canonically arranged relative to (i) 1-4 baseline; (ii) 1-4 random; and (iii) the numerosity by arrangement interaction.
activated in neuroimaging studies of shifts of attention in space, and of attentional modulation of visual inputs. Interestingly, the same regions have been shown to play a crucial role in the manipulation of numbers (typically in number comparison and calculation) both in imaging and in neuropsychological studies (Cipolotti et al., 1991; Dehaene & Cohen, 1995; Dehaene et al., 1999; Pinel, Dehaene, Riviere, & LeBihan, 2001; Thioux et al., 1998; Pesenti, Thioux, Seron, & De Voider, 2000; Rickard et al., 2000)) A second region of interest is extrastriate occipito-temporal cortex, that has previously been activated in studies of pattern recognition and naming (Kanwisher, Chun, McDermott, & Ledden, 1996; Moore & Price, 1999a ; Murtha, Chertkow, Beauregard, & Evans, 1999; Rolls, 1998 ) and may be one of the areas in which activity is strongly influenced by top-down attentional modulatory input from parietal cortex (Friston & Biichel, 2000).
3. Results
3.1- Behavioural results
(Dehaene & Cohen, 1994; Mandler & Shebo, 1982). These effects were tested entering reaction times on correct trials only into a 2x2 repeated measure analysis of variance, with number of dots (subitizing range [1-4 dots]; and counting range [6-9 dots]); and spatial arrangement of dots (canonical and random) as between subject factors. The analysis showed a significant main effect of number of dots (F[l,8] = 46.3, p.< .0001), with counting being much slower than subitizing (670 and 1112 ms.); a significant main effect of spatial arrangement (F[l,8] = 21.39, p.< .005), with random arrangements enumerated much slower than canonical arrangements; and finally, a significant number of dots X arrangement interaction (F[l,8] = 16.07, p.< .005). Planned comparison showed that the effect of number of dots was modulated by their spatial arrangement: for the random arrangement, counting was significantly slower than subitizing (F[l,8] = 61.327, p. <. 001) while for the canonical arrangement the difference between subitizing and counting didn't quite reach significance (F[l,8] = 4.672, p. = .062). Moreover, planned comparisons also showed that in the counting range, the dots arranged in a random display were enumerated slower than when arranged in a canonical way (F[l,8] = 35.057, p.< .0005), while in the subitizing range there was no difference between the two arrangements.
num erosity * pattern
1600
1400
1200
1000
■^■random canonicc 800
600
400
200
Numerosity
3.2- Neuroimaging Resuits
3.2.1- Main Effects
1. Effect of Task: The Quantification System (see tabie 1)
At a corrected level of significance, when subjects performed a quantification task, areas of enhanced brain activity were found in the middle/inferior occipital extrastriate cortex bilaterally, in the posterior bank of the right intraparietal sulcus, and in the midbrain. Deconposition of the main effect of task into simple effects for each condition relative to baseline, showed that the significance of the main effect of task is modulated by the number of dots: it increases as the numerosity increases. Individual contrasts relative to baseline show that the activation both in extrastriate and parietal areas is more significant for 6-9 dots than 1-4 dots irrespective of arrangement (see effect of numerosity below). At an uncorrected level, activation was also found in the left intraparietal sulcus, which was an apriori region of interest, in the right middle frontal gyrus, and in the left cerebellar hemisphere.
Talairach C luster OTH
C oordinates s iz e Ail 6 -9 R 6 -9 C 1-4 R 1-4 C ER
A reas >
bsl > bsl > bsl > bsl > bsl EFF ECT S X
Y z Num ber
of v o x e ls Z -sc o r e s
Middle Occipital R 36 -7 6 -1 2
} 4 7 1 3 5.8 5.1 3 .6 4 .4 2 .9 N
3 6 -6 0 -1 4 4.7 4.9 3 .4 4 .4 n.s.
L -32 -9 0 0 5.2 4.7 3 .5 3 .2 3 .0 N ,C
-4 8 -7 8 -1 4 } 2 5 2 3 4.9 4.9 3 .4 2 .9 n.s.
-1 0 -9 2 -8 4 .5 4 .6 3 .5 3 .3 n.s.
Intra Parietal R 3 0 -7 0 4 4 5.2 5.9 3 .9 2 .7 2 .9 C
L -2 8 -7 0 3 8 8 3 3 .4 3 .7 2 .5 n .s n .s N
Midbrain -2 -3 4 -1 0 4 4 9 4.5 3 .9 4.8 n .s. n.s. n.s.
Middle Frontal R 5 4 3 2 3 6 3 7 3 .6 4 .2 n .s n .s n.s. n .s
C erebellum L -36 -4 0 -3 2 2 3 6 3 .8 3 .7 3 .4 2 .6 2 .9 n.s.
Table 1,
The quantification system. Regions that show increased activation during quantification tasks fo r all numerosities and arrangements relative to the baseline tasks, and relative z-scores. C = canonical arrangement; R = random arrangement; bsl = baseline. In Bold-type, Z-scores corrected fo r multiple comparisons, at p. < 0.05, and related regions. In the column "other effects” regions that show increased activation as the Number o f dots increases, irrespective o f arrangement (N), and regions that showed