| INVESTIGATION
The Interplay of Temperature and Genotype on
Patterns of Alternative Splicing in
Drosophila melanogaster
Ana Marija Jaksi´c*ˇ ,†and Christian Schlötterer*,1
*Institut für Populationsgenetik, Vetmeduni Vienna, 1210 Vienna, Austria, and†Vienna Graduate School of Population Genetics, Vetmeduni Vienna, 1210 Vienna, Austria
ABSTRACT Alternative splicing is the highly regulated process of variation in the removal of introns from premessenger-RNA transcripts. The consequences of alternative splicing on the phenotype are well documented, but the impact of the environment on alternative splicing is not yet clear. We studied variation in alternative splicing among four different temperatures, 13, 18, 23, and 29°, in twoDrosophila melanogastergenotypes. We show plasticity of alternative splicing with up to 10% of the expressed genes being differentially spliced between the most extreme temperatures for a given genotype. Comparing the two genotypes at different temperatures, we found,1% of the genes being differentially spliced at 18°. At extreme temperatures, however, we detected sub-stantial differences in alternative splicing—with almost 10% of the genes having differential splicing between the genotypes: a magni-tude similar to between species differences. Genes with differential alternative splicing between genotypes frequently exhibit dominant inheritance. Remarkably, the pattern of surplus of differences in alternative splicing at extreme temperatures resembled the pattern seen for gene expression intensity. Since different sets of genes were involved for the two phenotypes, we propose that purifying selection results in the reduction of differences at benign temperatures. Relaxed purifying selection at temperature extremes, on the other hand, may cause the divergence in gene expression and alternative splicing between the two strains in rarely encountered environments.
KEYWORDSalternative splicing; temperature; plasticity; dominance
S
PLICING, the removal of introns from precursor messen-ger RNAs (mRNAs) together with the subsequent ligation of exons, is an integral part of gene expression regulation. Alternative splicing is the combination of different exons from the same precursor mRNA and provides the basis for the impressive diversity of gene products originating from a substantially smaller set of genes (Pan et al. 2008; Nilsen and Graveley 2010; Brown et al.2014). There are several types of alternative splicing; such as the exclusion of exons, sometimes mutually exclusive; or the retention of intronic sequence in the mature transcript. Furthermore, the alterna-tive selection of 59or 39splice sites, a special form of exonskipping (Koren et al. 2007), has been shown to make an important contribution to transcript diversification.
Splicing, in particular alternative splicing, is a highly reg-ulated process that depends oncis-regulatory sequences (splicing enhancers and suppressors) andtrans-regulatory splicing fac-tors, such as heterogeneous nuclear ribonucleoproteins and SR and SR-related proteins (Nilsen and Graveley 2010). The repertoire of isoforms, different mature mRNAs originat-ing from a soriginat-ingle gene, differs widely among tissues, develop-mental stages, and environdevelop-mental conditions (Barberan-Soler and Zahler 2008; Ganet al.2010; Barbosa-Moraiset al.2012; Bartoket al.2013; Leviatanet al.2013; Longet al.2013; Reyes et al.2013; Telonis-Scottet al.2013; Brownet al.2014; Chang et al.2014; Vituloet al.2014). It could, therefore, be consid-ered as a prototype for phenotypic plasticity on the molecular level (Mastrangeloet al.2012; Chenet al.2015b).
Phenotypic plasticity describes the ability of a given ge-notype to display a range of phege-notypes as a response to environmental heterogeneity. On the organismal level, phe-notypic plasticity has been of key interest to evolutionary biologists as it provides the opportunity to respond quickly
Copyright © 2016 by the Genetics Society of America doi: 10.1534/genetics.116.192310
Manuscript received June 3, 2016; accepted for publication July 8, 2016; published Early Online July 19, 2016.
Available freely online through the author-supported open access option.
Supplemental material is available online atwww.genetics.org/lookup/suppl/doi:10. 1534/genetics.116.192310/-/DC1.
to environmental changes. On the cellular level, phenotypic plasticity is the impressive manifestation of cellular differ-entiation of multicellular organisms; a property favored by natural selection.
While the selective advantage of both the presence or absence of phenotypic plasticity is conceptually appealing, their relative importance is not yet clear. Traditionally, plas-ticity has been studied using high-order phenotypes, such as morphology and life history traits, which integrate the effects of many genes. Nevertheless, the advances in molecular bi-ology have opened the possibility to expand these studies to lower-level phenotypes such as gene expression and alterna-tive splicing. Over the past years, an impressive amount of data has been collected demonstrating plasticity of gene expression and alternative splicing in different tissues and developmental stages (Jinet al.2001; Wanget al.2008; Graveleyet al.2011; Zhouet al.2012; Smithet al.2013; Brownet al.2014; Etges et al.2015). Much less is known about the influence of envi-ronmental conditions on this plasticity (Levineet al.2011; Yampolskyet al.2012; Telonis-Scottet al.2013; Brownet al. 2014; Changet al.2014; Sikkinket al.2014; Vituloet al.2014; Yampolskyet al.2014; Chenet al.2015a; Zhaoet al.2015), and the conservation of these patterns across genetically di-verged organisms (Barberan-Soler and Zahler 2008; Etges et al.2015; Chenet al.2015a; Zhaoet al.2015).
Temperature is one of the key environmental parameters, in particular for ectotherms such asDrosophila. A broad range of morphological, behavioral, and physiological responses to temperature has been described, but few studies attempted to compare the patterns of gene expression plasticity across temperatures. Most of these studies compared the pattern of gene expression at two temperatures (Sikkink et al. 2014; Zhaoet al.2015) and found a large number of genes signif-icantly affected by temperature. Recently, Chenet al.(2015a) attempted a more refined characterization of the temperature effect on gene expression by describing the reaction norm of gene expression across a broad temperature range (13–29°). Remarkably, they found that the reaction norm did not only cluster genes according to function, but also explained some of the underlying regulatory architecture (Chenet al.2015b).
Extending the plasticity analysis to diverged genotypes often found significant differences in the reaction norm be-tween genotypes. In studies that compared gene expression between differentially evolved genotypes, differences in gene expression plasticity were good indicators for direct or indirect selection targets (Telonis-Scottet al.2009; Yampolskyet al. 2012). An interesting pattern was found when Chen et al. (2015a) contrasted the pattern of gene expression between two genotypes at different temperatures. At 18°the authors observed almost no differences in gene expression intensity between two inbred Drosophila laboratory strains, but at more extreme temperatures the expression divergence in-creased. This pattern was interpreted as evidence for cana-lized gene expression at 18°, which becomes lost whenflies are exposed to more extreme environments (decanalization) (Chenet al.2015a).
Despite its well-characterized influence on the phenotype, alternative splicing plasticity has been studied only in the context of exposure to acute stress conditions (Mastrangelo et al.2012; Longet al.2013; Telonis-Scottet al.2013; Vitulo et al.2014). Very little is known, however, about how long-term exposure to typically encountered environments mod-ulates alternative splicing.
Here, we have used the data from the gene expression study by Chenet al.(2015a), studied the influence of tem-perature on the pattern of alternative splicing inDrosophila melanogaster, and compared this response between two ge-notypes. We contrasted the patterns of alternative splicing to those of gene expression intensities from a study by Chen et al.(2015a). Like for gene expression intensities, we found that temperature has a strong effect on alternative splicing, resulting in up to 568 (10.4%) genes being differentially spliced between the two most extreme temperatures for a given genotype. Even more surprising was the consis-tency of the pattern of increasing differences between the genotypes on both levels of the phenotype at extreme temperatures: at 18° only very few genes were differen-tially spliced between the two genotypes, whereas at ex-treme temperatures we detected the largest number of genes with differential splicing. Despite the similarity of this pattern, the involved genes did not overlap more than expected by chance.
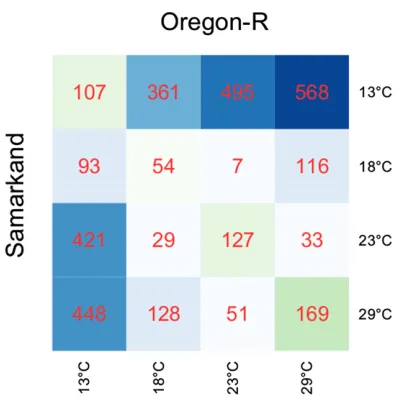
Figure 1 Temperature-dependent differential splicing between temper-atures and between genotypes. Differentially spliced genes for pairwise temperature comparisons (blue) are shown for each of the genotypes, above the diagonal for Oregon-R and below the diagonal for Samarkand. Differential splicing between genotypes at a given temperature is shown on the diagonal (green). The heat map of pairwise temperature compar-isons of differential splicing shows strong plasticity in both strains when the most extreme temperatures (13 and 29°) are compared. Alternative splicing between the more benign temperatures, 18 and 23°, however, exhibited only a weak plastic response to temperature in both genotypes. The data are based on reads mapping to the 39side of the transcript (see File S1for more details).
Materials and Methods
Females (f) from Oregon-R (O) and Samarkand (S) laboratory strains were crossed with males (m) from both strains (Of3 Om, Of3Sm, Sf3Sm, Sf3Om) in three replicates. After 2 days of egg laying at 23°, the eggs were transferred to one of the four assaying temperatures (13, 18, 23, and 29°). Vir-gin females were used for extraction and sequencing of mRNA. Further details onfly rearing can be found in Chen et al. (2015a) and Supplemental Material,File S1. Library preparation and sequencing are described in Chen et al. (2015a). Raw sequence reads (National Center for Biotech-nology Information accession number SRP041398 and SRP041395) were trimmed based on sequencing quality us-ing PoPoolation2 (Kofleret al.2011) and mapped to theD. melanogasterreference genome (Flybase assembly 5) using thegenomicshort-read nucleotidealignmentprogram (GSNAP) (Wu and Nacu 2010). All mapped RNA sequencing (RNA-seq) reads were randomly downsampled to the same coverage and counted with a DEXSeq counter. Differential exon usage analysis was conducted using the DEXSeq R package (Anders et al.2012). Due to 39gene-transcript coverage bias in some samples, we restricted some analyses by using only the reads mapping to the 39side of the transcript (Figure A,File S1). Inheritance assignment followed the procedures described in McManus et al. (2010) and Chenet al. (2015a) and is described in detail in File S1. Splice types were assigned based on theD. melanogasterannotation (seeFile S1). Gene ontology (GO) analysis was performed using Gowinda (Kofler and Schlötterer 2012) and accounted for different splicing opportunities (i.e., intron numbers) among GO categories.
Gene set overlaps were assessed using receiver operating characteristic (ROC)-like curves, which indicate if the over-lap between two sets of ranked data are higher or lower than expected by chance (curve above and below the di-agonal). Further details about the methods used are de-scribed inFile S1.
Data availability
All raw sequence data used in this study is deposited in the National Center for Biotechnology Information Sequence Read Archive with accession numbers SRP041398 (Oregon-R and Samarkand) and SRP041395 (F1). All unfiltered read counts, custom scripts, and protocols will be available at DataDryad.org.
Results
We used 100-bp paired-end RNA-seq reads from two D. melanogastergenotypes, Samarkand (S) and Oregon-R (O), which were exposed to four different developmental tem-peratures ranging from 13 to 29°(Chenet al.2015a). Each genotype–temperature combination was analyzed in three replicates. We measured alternative splicing by means of exon usage (Anders et al. 2012), using only those multi-exon genes with an average of at least 50 reads across all samples in the analysis (Table C,File S1).
Temperature-mediated plasticity of splicing
Pairwise comparisons of alternative splicing revealed a sub-stantial effect of temperature, with up to 10.4% (568 out of 5463) of the multi-exon genes showing differential splicing
between two temperatures for a given genotype. The highest plasticity of splicing was seen between the two extreme temperatures, but as few as seven genes differed in splicing between 18 and 23° in Oregon-R. Overall both D. mela-nogasterstrains showed the same pattern of differential splic-ing with exons besplic-ing more commonly retained at 13°and spliced out at 29°in both strains (Figure G,File S1). Oregon-R was more plastic than Samarkand (Figure 1).
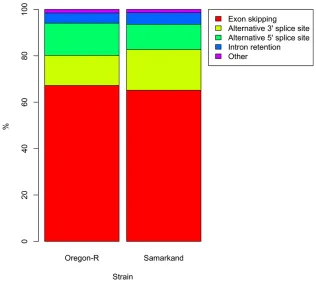
The splicing differences between the two most extreme temperatures (13 and 29°) within genotypes were mostly caused by exon skipping (O = 67%, S = 65%) followed by both alternative 39(O = 13%, S = 17%) and 59(O = 14%, S = 11%) splice site selection, and with least changes caused by intron retention (O = 4%, S = 5%; Figure 2).
Temperature-dependent differences in alternative splicing between genotypes
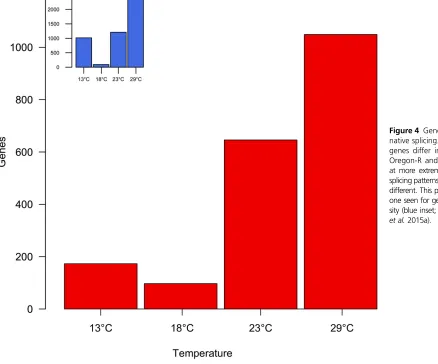
Despite the overall similarity of the two strains in splicing patterns across temperatures, we systematically tested for differential splicing between the two genotypes (Oregon-R and Samarkand) at each of the four developmental temper-atures (Figure 3 and Figure 4). The highest similarity in splic-ing between the two strains for a given temperature was observed at 18°, with 1.21% of all tested multi-exon genes (97 out of 8021) showing significantly different splicing pat-terns. However, at the other three temperatures, 13, 23 and 29°, splicing differed between the two genotypes for 1.95% (173 out of 8858), 7.99% (646 out of 8090) and 12.81% (1049 out of 8186) genes, respectively; (Figure 4) suggesting that difference in alternative splicing between strains is strongly dependent on the assaying temperature. This pat-tern was previously observed for gene expression intensities
(Figure 4 inset). The difference in alternative splicing be-tween the two genotypes at 13°becomes clearer after adjust-ing for variance in the 39 gene-body read coverage across replicates (seeFile S1).
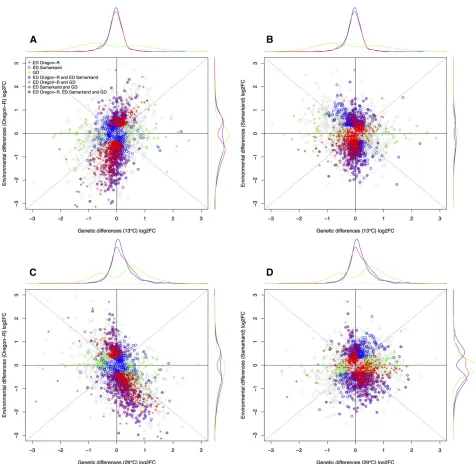
With temperature stress resulting in increasing differ-ences in the splicing pattern between the two strains, we were interested to understand this better. Since different reaction norms of alternative splicing between the two strains may have caused the differences between genotypes at a certain temperature, we related these patterns to the intrastrain plasticity between different temperatures. Plot-ting the fold change in exon expression between genotypes within a temperature for each exon (corrected for overall gene expression) and fold changes of exons with splicing plasticity (differences between temperatures, within a strain) against each other, clearly indicated that the two are not congruent. Hence, we conclude that differences be-tween strains are not a consequence of different reaction norms for alternative splicing of the two genotypes (Figure 5). Further support for this lack of congruence comes from ROC for exon expression intensities as well as a difference in GO term enrichment for genes with significant genetic differ-ences and plasticity (Figure H,File S1).
Out of all splicing events that differed between the strains for a given temperature, exon skipping was the most frequent one (76%), followed by 39alternative splicing site usage (14– 30%), and 59alternative splice site usage (3–5%). The least frequent event was intron retention (1%). This pattern was very similar across the entire temperature range, with a trend toward more exon skipping at higher temperatures (Figure 6). Importantly, a similar distribution of alternative splicing events has been described previously (McManuset al.2014).
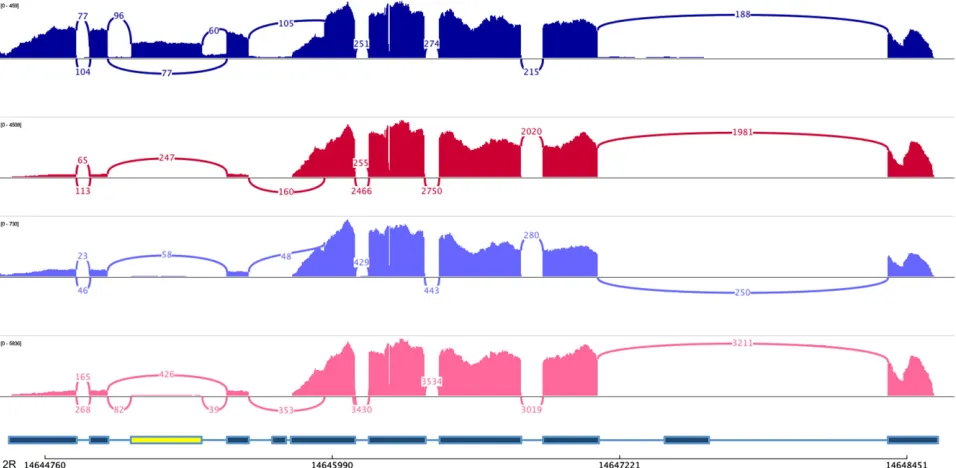
Figure 3 Genotype- and temperature-dependent alternative splicing. Sashimi plots for exon skipping of the third exon (marked in yellow) of the gene CG42351. Dark blue, Oregon-R 13°; dark red, Oregon-R 29°; light blue, Samarkand 13°; pink, Samarkand 29°.
Candidate genes for differential exon skipping
Previously, Chen et al.(2015a) showed enrichment in the GO categories“spliceosome”and“mRNA splicing, via spliceosome”, indicating that the expression differences in the core splicing machinery could result in the differences in alternative splicing between the genotypes. Dominant inheritance of alternative splicing between the genotypes also suggested that alternative splicing regulation is guided mostly bytrans-acting factors. To test this hypothesis further, we took advantage oftrans-acting factors with genome-wide influence on alternative splicing. The exon junction complex serves a central role in splicing (Tangeet al.2004). Knockdown of two members of the exon junction complex,mago nashiandeIF4AIII, increases the rate of exon skipping (Tangeet al.2004; Ashton-Beaucageet al.2010; Wanget al.2014). The three core exon junction complex genes that can be found in the nucleus and can, therefore, have the ability to interact with the splicing process, show a consistent expression pattern across temperatures. At 13°they are more ex-pressed in Oregon-R, while at 29°Samarkand has the higher ex-pression level (Table 1). If the exon junction complex is involved in the splicing differences between the two strains, we expect to
find more exon skipping in Oregon-R at 13°, while Samarkand would have more exon skipping at higher temperatures.
In support of this hypothesis, in Samarkandflies wefind on av-erage downregulation of differentially spliced exons at 13°, and the opposite pattern at higher temperatures (Table 1). While these results strongly suggest a substantial influence of the exon junction complex on the alternative splicing, the observation of different genes being alternatively spliced across temperatures indicates that other splicing factors may also shape the plasticity of alternative splicing. Brooks et al. (2015) recently reported 56 splicing factors and their target genes. We used this set of splicing factors to further test our hypothesis. In our data, 49 of the factors reported by Brookset al.were expressed (on average at least 20 mapped reads across all samples). A total of 31 (63%) of the splicing factors showed a similar pattern as the exon junc-tion complex genes: they were upregulated in one strain at 13° and upregulated in the other strain at 29°. Genes with differential splicing between the two genotypes were enriched with genes regulated for 19 splicing factors (Table D,File S1). Five splicing factors,snRNP-U1-70K(FBgn0016978),RpS3(FBgn0002622),
SC35 (FBgn0265298), RnpS1 (FBgn0037707), and Hrb27C
(FBgn0004838) showed the same concordance of expression level and exon skipping as core exon junction complex genes (Table D,File S1). The protein components of the spliceosome,
snRNP-U1-70KandSC35, are strong candidates for regulating
Figure 4 Genotype-specific alter-native splicing. At 18°only a few genes differ in splicing between Oregon-R and Samarkand, while at more extreme temperatures the splicing patterns become increasingly different. This pattern resembles the one seen for gene expression inten-sity (blue inset; redrawn from Chen
differential splicing between the two genotypes. The auxiliary protein component of the exon junction complexRnpS1provides further support for the importance of the exon junction complex for the alternative splicing patterns seen in this study.
Similar patterns of temperature-dependent differences among strains for gene expression and
alternative splicing
Interestingly, the striking temperature dependence of differ-ential splicing between Oregon-R and Samarkand is mirrored for gene expression intensity (Figure 4) (Chenet al.2015a).
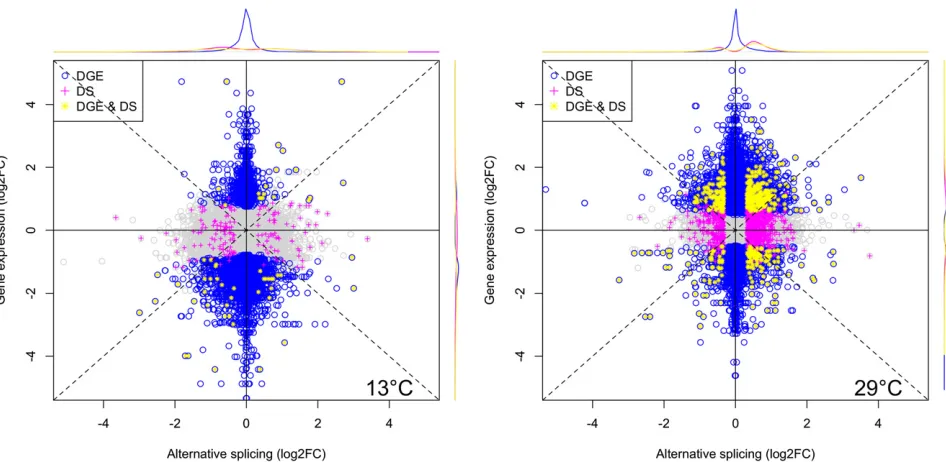
While at 18°the differences in both splicing and gene expres-sion intensity between genotypes are very small, at extreme temperatures the differences increase. Given these parallel patterns, we were interested in whether the same genes were affected and compared the expression intensity differences of the entire gene against the expression differences in each exon (Figure 7; Figure I,File S1). Independent of the developmen-tal temperature, genes with significant differences in gene ex-pression intensity have only limited overlap with genes with differential splicing (Figure 7). These results suggest that despite the overall similarity in temperature dependence of
Figure 5 Geneticallyvs.environmentally induced differences in alternative splicing. Log2-fold changes between Oregon-R and Samarkand at (A and B) 13°and (C and D) 29°are plotted against log2-fold changes between 13 and 29°in (A and C) Oregon-R and in (B and D) Samarkand. Exons that are significantly differentially spliced between genotypes (GD, green) mostly do not overlap with the exons that are plastic (ED) in Oregon-R (red) or Samarkand (blue). Density plots on the top and on the right show the distribution of plotted points with corresponding colors. ED, environmental differences; GD, genetic differences.
differential splicing and gene expression intensities, both processes are regulated by different mechanisms. This conclu-sion is further substantiated in a comparison of GO categories that are enriched for genes with significant differential splicing or gene expression intensities at 23 and 29°. Despite both categories harboring a significant enrichment for some genes, there is very little similarity in the enrichment patterns (GO categories) between differential splicing and gene expres-sion (Figure I,File S1). A similar pattern has been observed by Brookset al.(2015) who found that expression levels of splicing factors that regulate alternative splicing of thou-sands of genes do not influence their expression intensities (Brookset al.2015).
Dominance prevails for differential splicing
The mode of inheritance of alternative splicing can be stud-ied by contrasting two parental genotypes to offspring of a cross between them. Between 92 and 99% of the genes did not differ significantly from the splicing pattern of both parents. Splicing of most (83–96%) remaining genes matched one of parents (i.e., were dominant; Table 2). Unexpectedly, this dominance was not evenly distributed between the two paren-tal genotypes and differed strikingly among temperatures (Figure 8). This pattern was most extreme at 13 and 29°. While at 13°the splicing pattern of Samarkand was dominant for the majority of genes (58%) and made up for 70% of all genes with dominant splicing inheritance, at 29°splicing of most genes in F1individuals matched Oregon-R (92%) and
corresponded to 96% of all dominant genes. At 18°, no such imbalance of dominance was found (44% Oregon-R
dominant vs. 56% Samarkand dominant). To test to what extent allele-specific gene expression may have affected our inference of dominance, we evaluated if genes with dominant splicing also have imbalanced allele-specific expression favor-ing the allele comfavor-ing from the dominant parent. On average, 21.75% of the dominant genes have imbalanced allele-specific expression favoring the dominant allele (Figure J, File S1). Nevertheless, even if only genes with no allele specific differ-ences are considered, we stillfind the same temperature-dependent dominance pattern (Figure J,File S1).
Similar patterns of swapping dominance for gene expression and alternative splicing
This change in the direction of dominance is not restricted to the patterns of alternative splicing but it can be also be found for gene expression intensities (Chenet al.2015a). Particularly remarkable is that for gene expression intensity and alterna-tive splicing, more genes in the F1resemble the Samarkand
parent, while at 29°the pattern of the Oregon-R parent is dominant. Despite this overall similarity, we did notfind an overlap between the genes showing swapping dominance for alternative splicing and gene expression intensity; suggesting different regulatory mechanisms.
Discussion
This study evaluates the interplay of temperature and geno-type on the patterns of alternative splicing. We show that both temperature and genotype have a significant effect on the splicing patterns and that the interaction of both causes a highly complex splicing signature. We identified the exon junction complex as a strong candidate for regulation of temperature-dependent alternative splicing.
Temperature has a very strong effect on alternative splic-ing. Ranging from only a few genes having differential splicing at 18°to about the same fraction of genes with differentially spliced exons as found in interspecific comparisons (McManus et al. 2014). The same pattern has been observed for gene expression (Chenet al.2015a). In comparing the differences in alternative splicing to gene expression between the two genotypes across a range of temperatures, we found that even though these two phenotypic levels behave in a similar man-ner, they operate on clearly distinct groups of genes. To shed light on this phenomenon it is necessary to consider different
Figure 6 Contribution of splice types to differential splicing contrasting Oregon-R and Samarkand at each of the four temperatures. Exon skip-ping is the most frequent splice type among genes with differential splic-ing between genotypes and with increassplic-ing temperatures this pattern becomes even more pronounced.
Table 1 Expression of nuclear core exon junction complex negatively correlates with exon skipping at extreme temperatures
13° 29°
FDR log2FC FDR log2FC
mago nashi 0.077 0.915 0.006 20.923
tsunagi 0.769 0.136 0.001 21.024
eIF4AIII 0.035 0.914 0.024 20.659 Mean log2FC expression of exons
differentially spliced between Oregon-R and Samarkand
20.26 0.3
factors that may influence it, such as the underlying regulation of the two phenotypic levels and selection forces that might shape the differences between the two.
Mode of inheritance
In this study we report, for thefirst time, an inheritance mode of alternative splicing and its temperature dependence. Our analyses of alternative splicing revealed a striking pattern of prevailing dominant inheritance. Furthermore, dominance of alternative splicing showed temperature dependence by pref-erably using alternative splicing patterns of Oregon-R at warm temperatures and of Samarkand at cold temperatures. This suggests that temperature-specific alternative splicing might stem from the usage of splicing factors carrying alleles or interacting with alleles that enable them to perform better at a certain temperature. Using the identical data set, Chenet al. (2015a) found the same pattern for gene expression intensi-ties, despite different genes being affected. Interestingly, this prevalence of dominance was also found for other inter- and intraspecific gene expression studies inDrosophilaand Cir-sium(Gibson et al.2004; McManus et al.2010; Bellet al. 2013; Suvorov et al. 2013; Meiklejohn et al. 2014; Chen et al. 2015a). Strong departure from additivity was seen in oysters, with the highest proportion of differentially expressed genes being overdominant (Hedgecocket al.2007). Neverthe-less, the majority of studies in different organisms reported prevalent additive effects with only a minor portion of genes showing dominant or other types of nonadditive inheritance for gene expression (Vuylsteke et al. 2005; Cuiet al. 2006; Stupar et al. 2008). This study supports the prevalence of dominant inheritance in Drosophila by extending the study
of inheritance to alternative splicing, and suggests that trans-acting factors may be important regulators for alter-native splicing as was shown for gene expression (Lemos et al. 2008; Suvorov et al. 2013; Meiklejohn et al. 2014; Chenet al.2015a).
Selection for genotype3temperature interaction
By analyzing alternative splicing in adult D. melanogaster females from two different genotypes developing at four different temperatures, we observed a complex pattern of plasticity: alternative splicing showed pronounced genotype– temperature interactions. Interestingly, the genotypic differences in splicing were most pronounced at extreme temperatures, while at 18°almost no differences in alternative splicing could be recognized.
Strong differences between genotypes at extreme temper-atures were previously described for gene expression intensity (Chen et al. 2015a). The authors argued that this pattern suggests temperature–stress-mediated decanalization of gene expression, reasoning that 18°represents the most benign temperature forD. melanogaster.
What evolutionary forces caused this striking pattern at both phenotypic levels? Unfortunately, the impact of gene expression and alternative splicing differences on organismal
fitness is not yet understood. For the sake of argument, we will distinguish extreme scenarios and discuss their consequences.
Hypothesis 1: Gene expression and alternative-splicing differences between strains are adaptive: Contrasting ex-pression patterns of strains/populations from different hab-itats in a common garden setting is common practice to identify
Figure 7 Limited overlap between genes with differential splicing and those that differ in expression intensity. Differential splicing between Oregon-R and Samarkand is plotted against differential gene expression between the two strains. Significant differences are indicated in color (blue, differential gene expression only; magenta, differential splicing only; yellow, significant for both categories). Density plots on top and on the right of thefigure indicate nonoverlapping distribution of genes with significant differences for gene expression and alternative splicing.
differentially expressed genes, which serve as candidates for local adaptation (Telonis-Scottet al.2009; Yampolskyet al. 2012). Along these lines, the differences at extreme temper-atures seen in our experiment may be viewed as the signa-ture of adaptation of the two strains used in this study to different environments. On the other hand, if the environ-ments of the two strains are not as different, differences in their expression and splicing patterns may stem from con-vergent adaptation.
Hypothesis 2: Gene expression and alternative splicing differences between strains are maladaptive: If selection favors similar gene expression between different genotypes, mechanisms will evolve that result in a pattern of genetic canalization in a specific environment. One classic example for canalization is theHsp90gene, which has been shown to suppress phenotypic differences between diverged genotypes. Once the function of Hsp90is compromised, through muta-tions or environmental stress, the genetic differences usually manifest in deleterious phenotypic differences (Rutherford and Lindquist 1998). Since these differences are typically sheltered by the action of a buffering system consisting of putative canalization factors such asHsp90, they will inde-pendently accumulate between strains. Thus, once the buff-ering system is broken, these independently accumulated variants result in differences in gene expression and alter-native splicing.
Alternatively, instead of buffering systems, purifying se-lection could cause the pattern of low phenotypic divergence in a given environment by removing variants causing differ-ences in gene expression and alternative splicing. Reasoning that purifying selection is most effective in the environment in which an organism spends most time, at 18°(the favorite temperature ofD. melanogasterlarvae) (Kwonet al.2008; Shenet al.2011) the fewest deleterious variants are expected. Extreme temperatures, such as 13 and 29°, are avoided byD. melanogaster. Genes that are expressed at these temperatures can accumulate mutations that are inaccessible to purifying selection if they do not affect the gene expression patterns at 18°. In this way, variation resulting in differences in gene expression and alternative splicing could accumulate and will only be detected in environments that are rarely encountered.
Some support for this hypothesis is provided by a recent study (Richardsonet al.2013). Comparing the phenotypic variation in mutation-accumulation lines with and without HTZ1, a gene implicated in mutational robustness, they found no dif-ference. Since this observation contrasted results comparing phenotypic variation with and without a gene conferring ro-bustness, they concluded that natural selection must have purged those variants that cannot be buffered (Richardson et al.2013). We follow this reasoning to explain the phenome-non seen in our data.
Several lines of evidence support the accumulation of deleterious alleles in rarely encountered environments as an explanation for the differences observed between the two strains. First, the differences in alternative splicing and gene expression are affecting different gene sets, suggesting that the two processes are independent from each other. Second, assuming that the recessive allele is the deleterious variant, the concordance of the dominance patterns for alternative splicing and gene expression in-tensity suggest that Oregon-R has acquired deleterious mutations in warm environments that are expressed at low-assaying temperatures. Samarkand, on the other hand, did the same in cold environments and accumu-lated deleterious mutations that are uncovered at high temperatures.
This leads to a clear prediction for flies from different temperature environments. Whileflies originating from hot environments are more likely to accumulate mutations that are deleterious in cold environments, the opposite is true for
flies originating in warm environments. This phenomenon can
Table 2 Inheritance modes of alternative splicing
13° 18° 23° 29°
Testable genes Oregon-R:F1 8982 8320 8236 8182
Testable genes Samarkand:F1 8789 8352 8372 8340
Conserved Oregon-R 8768 8267 7864 7573
Conserved Samarkand 8672 8307 8201 8243
Conserved both 8551 8204 7792 7505
Additive 20 6 22 13
Dominant Oregon-R 36 18 249 567
Dominant Samarkand 83 23 100 26
Underdominant 0 1 3 3
Overdominant 0 0 1 1
eventually lead to an increase in the gene expression and alternative-splicing variance between populations, which creates a pattern of high-phenotypic differentiation in ex-treme environments. Future work using flies evolved in extreme environments may yield new evidence in support of this hypothesis.
Acknowledgments
We thank Jun Chen, Alexander Kalinka, François Mallard, and Ray Tobler for helpful discussions. This study was sup-ported by the Austrian Science Fund (FWF P22834 and FWF W1225) and the European Research Council (ArchAdapt).
Literature Cited
Anders, S., A. Reyes, and W. Huber, 2012 Detecting differential usage of exons from RNA-seq data. Genome Res. 22: 2008–2017. Ashton-Beaucage, D., C. M. Udell, H. Lavoie, C. Baril, M. Lefrançois
et al., 2010 The exon junction complex controls the splicing of
MAPK and other long intron-containing transcripts in Drosoph-ila. Cell 143: 251–262.
Barberan-Soler, S., and A. M. Zahler, 2008 Alternative splicing regulation during C. elegans development: splicing factors as regulated targets. PLoS Genet. 4: e1000001.
Barbosa-Morais, N. L., M. Irimia, Q. Pan, H. Y. Xiong, S. Gueroussov
et al., 2012 The evolutionary landscape of alternative splicing
in vertebrate species. Science 338: 1587–1593.
Bartok, O., C. P. Kyriacou, J. Levine, A. Sehgal, and S. Kadener, 2013 Adaptation of molecular circadian clockwork to environ-mental changes: a role for alternative splicing and miRNAs. Proc. Biol. Sci. 280: 20130011.
Bell, G. D. M., N. C. Kane, L. H. Rieseberg, and K. L. Adams, 2013 RNA-seq analysis of allele-specific expression, hybrid ef-fects, and regulatory divergence in hybrids compared with their parents from natural populations. Genome Biol. Evol. 5: 1309– 1323.
Brooks, A. N., M. O. Duff, G. May, L. Yang, M. Bolisetty et al., 2015 Regulation of alternative splicing in Drosophila by 56 RNA binding proteins. Genome Res. 25: 1771–1780. Brown, J. B., N. Boley, R. Eisman, G. E. May, M. H. Stoiberet al.,
2014 Diversity and dynamics of the Drosophila transcriptome. Nature 512: 393–399.
Chang, C.-Y., W.-D. Lin, and S.-L. Tu, 2014 Genome-Wide Analy-sis of Heat-Sensitive Alternative Splicing inPhyscomitrella pat-ens. Plant Physiol. 165: 826–840.
Chen, J., V. Nolte, and C. Schlötterer, 2015a Temperature Stress Mediates Decanalization and Dominance of Gene Expression in
Drosophila melanogaster. PLoS Genet. 11: e1004883.
Chen, J., V. Nolte, and C. Schlötterer, 2015b Temperature-Related Reaction Norms of Gene Expression: Regulatory Ar-chitecture and Functional Implications. Mol. Biol. Evol. 32: 2393–2402.
Cui, X., J. Affourtit, K. R. Shockley, Y. Woo, and G. A. Churchill, 2006 Inheritance patterns of transcript levels in F1 hybrid mice. Genetics 174: 627–637.
Etges, W. J., M. V. Trotter, C. C. de Oliveira, S. Rajpurohit, A. G. Gibbs et al., 2015 Deciphering life history transcriptomes in different environments. Mol. Ecol. 24: 151–179.
Gan, Q., I. Chepelev, G. Wei, L. Tarayrah, K. Cui et al., 2010 Dynamic regulation of alternative splicing and chroma-tin structure in Drosophila gonads revealed by RNA-seq. Cell Res. 20: 763–783.
Gibson, G., R. Riley-Berger, L. Harshman, A. Kopp, S. Vachaet al., 2004 Extensive sex-specific nonadditivity of gene expression
inDrosophila melanogaster. Genetics 167: 1791–1799.
Graveley, B. R., A. N. Brooks, J. W. Carlson, M. O. Duff, J. M. Landolin
et al., 2011 The developmental transcriptome ofDrosophila
melanogaster. Nature 471: 473–479.
Hedgecock, D., J. Z. Lin, S. DeCola, C. D. Haudenschild, E. Meyer
et al., 2007 Transcriptomic analysis of growth heterosis in
lar-val Pacific oysters (Crassostrea gigas). Proc. Natl. Acad. Sci. USA 104: 2313–2318.
Jin, W., R. M. Riley, R. D. Wolfinger, K. P. White, G. Passador-Gurgel et al., 2001 The contributions of sex, genotype and age to transcriptional variance inDrosophila melanogaster. Nat. Genet. 29: 389–395.
Kofler, R., R. V. Pandey, and C. Schlötterer, 2011 PoPoolation2: identifying differentiation between populations using sequenc-ing of pooled DNA samples (Pool-Seq). Bioinformatics 27: 3435–3436.
Kofler, R., and C. Schlötterer, 2012 Gowinda: unbiased analysis of gene set enrichment for genome-wide association studies. Bio-informatics 28: 2084–2085.
Koren, E., G. Lev-Maor, and G. Ast, 2007 The Emergence of Al-ternative 39and 59Splice Site Exons from Constitutive Exons. PLoS Comput. Biol. 3: e95.
Kwon, Y., H. S. Shim, X. Wang, and C. Montell, 2008 Control of thermotactic behavior via coupling of a TRP channel to a phos-pholipase C signaling cascade. Nat. Neurosci. 11: 871–873. Lemos, B., L. O. Araripe, P. Fontanillas, and D. L. Hartl,
2008 Dominance and the evolutionary accumulation of cis
-andtrans-effects on gene expression. Proc. Natl. Acad. Sci. USA
105: 14471–14476.
Leviatan, N., N. Alkan, D. Leshkowitz, and R. Fluhr, 2013 Genome-wide survey of cold stress regulated alternative splicing in
Arab-idopsis thalianawith tiling microarray. PLoS One 8: e66511.
Levine, M. T., M. L. Eckert, and D. J. Begun, 2011 Whole-genome expression plasticity across tropical and temperate Drosophila
melanogaster populations from Eastern Australia. Mol. Biol.
Evol. 28: 249–256.
Long, Y., G. Song, J. Yan, X. He, Q. Liet al., 2013 Transcriptomic characterization of cold acclimation in larval zebrafish. BMC Genomics 14: 612.
Mastrangelo, A. M., D. Marone, G. Laidò, A. M. De Leonardis, and P. De Vita, 2012 Alternative splicing: enhancing ability to cope with stress via transcriptome plasticity. Plant Sci. 185– 186: 40–49.
McManus, C. J., J. D. Coolon, M. O. Duff, J. Eipper-Mains, B. R. Graveleyet al., 2010 Regulatory divergence in Drosophila re-vealed by mRNA-seq. Genome Res. 20: 816–825.
McManus, C. J., J. D. Coolon, J. Eipper-Mains, P. J. Wittkopp, and B. R. Graveley, 2014 Evolution of splicing regulatory networks in Drosophila. Genome Res. 24: 786–796.
Meiklejohn, C. D., J. D. Coolon, D. L. Hartl, and P. J. Wittkopp, 2014 The roles of cis- and trans-regulation in the evolution of regulatory incompatibilities and sexually dimorphic gene ex-pression. Genome Res. 24: 84–95.
Nilsen, T. W., and B. R. Graveley, 2010 Expansion of the eu-karyotic proteome by alternative splicing. Nature 463: 457– 463.
Pan, Q., O. Shai, L. J. Lee, B. J. Frey, and B. J. Blencowe, 2008 Deep surveying of alternative splicing complexity in the human transcriptome by high-throughput sequencing. Nat. Genet. 40: 1413–1415.
Reyes, A., S. Anders, R. J. Weatheritt, T. J. Gibson, L. M. Steinmetz
et al., 2013 Drift and conservation of differential exon usage
across tissues in primate species. Proc. Natl. Acad. Sci. USA 110: 15377–15382.
Richardson, J. B., L. D. Uppendahl, M. K. Traficante, S. F. Levy, and M. L. Siegal, 2013 Histone variant HTZ1 shows extensive epis-tasis with, but does not increase robustness to, new mutations. PLoS Genet. 9: e1003733.
Rutherford, S. L., and S. Lindquist, 1998 Hsp90 as a capacitor for morphological evolution. Nature 396: 336–342.9845070 Shen, W. L., Y. Kwon, A. A. Adegbola, J. Luo, A. Chess et al.,
2011 Function of rhodopsin in temperature discrimination in Drosophila. Science 331: 1333–1336.
Sikkink, K. L., R. M. Reynolds, C. M. Ituarte, W. A. Cresko, and P. C. Phillips, 2014 Rapid evolution of phenotypic plasticity and shifting thresholds of genetic assimilation in the nematode
Cae-norhabditis remanei. G3 (Bethesda) 4: 1103–1112.
Smith, G., Y. Fang, X. Liu, J. Kenny, A. R. Cossins et al., 2013 Transcriptome-wide expression variation associated with environmental plasticity and mating success in cactophilic
Dro-sophila mojavensis. Evolution 67: 1950–1963.
Stupar, R. M., J. M. Gardiner, A. G. Oldre, W. J. Haun, V. L. Chandler
et al., 2008 Gene expression analyses in maize inbreds and
hybrids with varying levels of heterosis. BMC Plant Biol. 8: 33. Suvorov, A., V. Nolte, R. V. Pandey, S. U. Franssen, A. Futschiket al.,
2013 Intra-specific regulatory variation in Drosophila
pseu-doobscura. PLoS One 8: e83547.
Tange, T. Ø., A. Nott, and M. J. Moore, 2004 The ever-increasing complexities of the exon junction complex. Curr. Opin. Cell Biol. 16: 279–284.
Telonis-Scott, M., R. Hallas, S. W. McKechnie, C. W. Wee, and A. A. Hoffmann, 2009 Selection for cold resistance alters gene tran-script levels inDrosophila melanogaster. J. Insect Physiol. 55(6): 549–555.
Telonis-Scott, M., B. van Heerwaarden, T. K. Johnson, A. A. Hoffmann, and C. M. Sgrò, 2013 New levels of transcriptome complexity at upper thermal limits in wild Drosophila revealed by exon expres-sion analysis. Genetics 195: 809–830.
Vitulo, N., C. Forcato, E. C. Carpinelli, A. Telatin, D. Campagna
et al., 2014 A deep survey of alternative splicing in grape
re-veals changes in the splicing machinery related to tissue, stress condition and genotype. BMC Plant Biol. 14: 99.
Vuylsteke, M., F. van Eeuwijk, P. Van Hummelen, M. Kuiper, and M. Zabeau, 2005 Genetic analysis of variation in gene expression
inArabidopsis thaliana. Genetics 171: 1267–1275.
Wang, E. T., R. Sandberg, S. Luo, I. Khrebtukova, L. Zhanget al., 2008 Alternative isoform regulation in human tissue transcrip-tomes. Nature 456: 470–476.
Wang, Z., V. Murigneux, and H. Le Hir, 2014 Transcriptome-wide modulation of splicing by the exon junction complex. Genome Biol. 15: 551.
Wu, T. D., and S. Nacu, 2010 Fast and SNP-tolerant detection of complex variants and splicing in short reads. Bioinformatics 26: 873–881.
Yampolsky, L. Y., G. V. Glazko, and J. D. Fry, 2012 Evolution of gene expression and expression plasticity in long-term experi-mental populations ofDrosophila melanogastermaintained un-der constant and variable ethanol stress. Mol. Ecol. 21: 4287– 4299.
Yampolsky, L. Y., E. Zeng, J. Lopez, P. J. Williams, K. B. Dick
et al., 2014 Functional genomics of acclimation and
adap-tation in response to thermal stress in Daphnia. BMC Geno-mics 15: 859.
Zhao, L., J. Wit, N. Svetec, and D. J. Begun, 2015 Parallel Gene Expression Differences between Low and High Latitude Popula-tions ofDrosophila melanogasterandD. simulans. PLOS Genet. 11: e1005184.
Zhou, S., T. G. Campbell, E. A. Stone, T. F. Mackay, and R. R. Anholt, 2012 Phenotypic plasticity of the Drosophila transcrip-tome. PLoS Genet. 8: e1002593.
GENETICS
Supporting Information
www.genetics.org/lookup/suppl/doi:10.1534/genetics.116.192310/-/DC1
The Interplay of Temperature and Genotype on
Patterns of Alternative Splicing in
Drosophila melanogaster
Ana Marija Jaksic´ and Christian Schlötterer
SUPPORTING METHODS
Fly rearing
Flies were kept in standard cornmeal-molasses-yeast agar medium with
alternating 12h light and 12h dark photoperiods. Oregon-R and Samarkand
strains were inbred for 7 generations by sibling pair mating at 25°C prior to the
experiment. The following crosses were used in this experiment: Oregon-R
female × Oregon-R male (Oregon-R), Samarkand female × Samarkand male
(Samarkand), Oregon-R female × Samarkand male (F1
A), Samarkand female ×
Oregon-R male (F1
B). Around 80 single male and virgin female crosses were set
up in three replicates for each cross combination in parallel for the RNA-seq
analyses. The females laid eggs at 23°C for 2 days. After removal of the adults 20
vials of each cross combination were incubated at one of the four assaying
temperatures (13°C, 18°C, 23°C and 29°C). Virgin female flies were collected
upon eclosure for sequencing. Further details can be found in Chen et al. (2015a).
Library preparation
Library preparation and sequencing are described in Chen et al. (2015a).
RNA-seq read mapping and counting
2
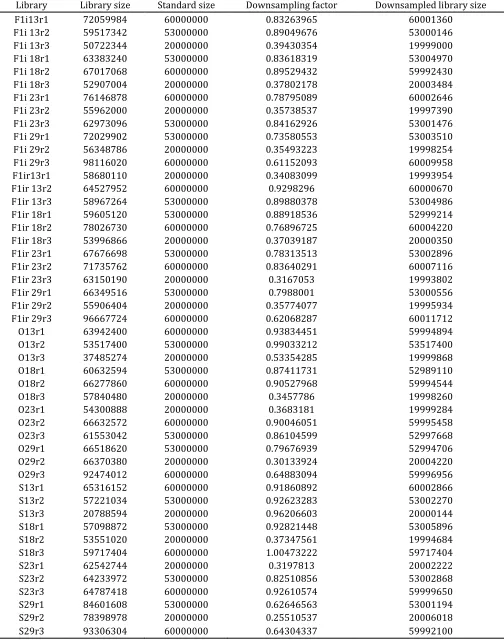
Table A. Library sizes (mapped reads) before and after downsampling to
the same coverage.
Library Library size Standard size Downsampling factor Downsampled library size F1i13r1 72059984 60000000 0.83263965 60001360
4
Differential splicing analysis
We characterized alternative splicing from RNA-seq data using a differential
exon usage approach (Anders et al. 2012). To account for the complexity of
splicing events, annotated exons are sub-divided into sub-exons (“counting
bins”) if used differentially by the corresponding isoforms (Anders et al. 2012).
The mapped reads are counted for each exon. Reads overlapping two
sub-exons are counted once for both of the sub-sub-exons. For clarity we distinguish
exons from sub-exons in the Materials and Methods section, but for simplicity,
we refer to sub-exon as “exons” throughout the rest manuscript and in figures
and tables.
We used the software tool DEXSeq (Anders et al. 2012), which implements this
differential exon usage analysis. We first normalized the read count data using
DESeq normalization (Anders & Huber, 2010) and then we used the normalized
reads to fit two generalized linear models assuming negative-binomial
distribution of count data. We fit the models with count data of each sub-exon (i),
gene (j) and strain or temperature (l). The reduced model is decomposed into 3
factors, overall gene expression effect (G), sub-exon effect (E) and strain (or
temperature) effect (S)
logM
ijl=G
i+E
il+S
ij(1)
3’ gene body coverage bias
6
Figure A. Gene body coverage is similar across samples within replicates of
the same temperature.
Table B. Differential splicing for single exon genes. Exon is divided into three
spurious exons and tested for differential splicing. Less than 4% of spurious
exons were significantly differentially used.
13°C 18°C 23°C 29°C Tested exons 2600 2359 2479 2410 Significant exons 4 5 84 65 Non-significant exons 2596 2354 2395 2345
% significant exons 0.15 0.21 3.38 2.697
and many differences in splicing at extreme temperature remains when
truncated transcripts are analyzed.
The comparison across temperatures is, however, complicated due to the
apparent differences in gene coverage (Figure A). To account for this, we
restricted all analyses between temperatures to 1kb of the 3’ end of the
transcript where the coverage is even (Figure C). The comparison of
environmental and genetic canalization was also restricted to first 1kb of the
3’end of the transcript.
Figure C. Gene body coverage for full length transcripts (red) and
transcripts truncated to 1kb (blue) and 500bp (green) in Oregon-R and
Samarkand samples. Gene body coverage is biased towards the 3’end for full
length transcripts, whereas truncated transcripts show even coverage.
Inference of splice types from differential exon usage patterns
Splice types were defined according to correspondence of the position of
sub-exon relative to the sub-exons in the standard annotation on the same strand.
Exon skipping: sub-exons share both 3’ and 5’ end position with the
corresponding exon in the standard annotation file.
3’ alternative splice site usage: sub-exons share their 5’ end, but not the 3’ end
position with their corresponding exon in standard annotation.
5’ alternative splice site usage: sub-exons share their 3’ end, but not the 5’ end
position with their corresponding exon in standard annotation.
Intron retention: sub-exons share their 5’ end position with the 3’ end position
8
Splice types that could not be assigned to any of the splice types described above
were grouped as “other “splice types.
The different splice types were visually confirmed by using Sashimi plots (intron
retention, Figure D; 5’ alternative splice site usage, Figure E; 3’ alternative splice
site usage, Figure F).
Figure D. Intron retention. Intron from transcript FBtr0300097 (indicated with
yellow frame in the annotation) in gene CG14133 is spliced out in Oregon-R
(red) and retained Samarkand (blue).
Figure E. Alternative 5’ splice site usage. Oregon-R (red) uses different
Figure F. Alternative 3’ splice site usage. Oregon-R (red) uses a shorter
transcript than Samarkand (blue) by splicing the second exon of CG31864 at a
different 3’splice site (indicated with yellow frame in the annotation).
Mode of inheritance
We assigned the mode of inheritance of each gene by comparing the expression
differences of sub-exons between F1 and parental strains.
Conserved Oregon-R inheritance: All sub-exons of a given gene in the F1
offspring do not have significant differences in expression from Oregon-R
(q-value<0.05). Furthermore the log2 fold change may not exceed an absolute value
of 0.32 when compared to Oregon-R.
Conserved Samarkand inheritance: All sub-exons of a given gene in the F1
offspring do not have significant differences in expression from Samarkand
(q-value<0.05). Furthermore the log2 fold change may not exceed an absolute value
of 0.32 when compared to Samarkand.
Conserved inheritance for both parents: The expression of all sub-exons of a
given gene does not differ significantly from both parental strains Oregon-R and
Samarkand.
Additive inheritance: The expression of at least one sub-exon in F1 individuals
is significantly different from that in both of the parents (q-value<0.05).
Furthermore the F1 expression level is intermediate to the one of the two
parents.
Dominant Oregon-R inheritance: The expression of at least one sub-exon is
10
Dominant Samarkand inheritance: The expression of at least one sub-exon is
conserved in the Samarkand - F1 contrast, while being significantly different in
the Oregon-R - Samarkand, and Oregon-R - F1 contrasts.
Underdominant inheritance: The expression of at least one sub-exon in F1
individuals is significantly lower than the one in Oregon-R and Samarkand.
Overdominant inheritance: The expression of at least one sub-exon in F1
individuals is significantly higher than the one in Oregon-R and Samarkand.
GO analysis
Gene expression studies typically do not account for the influence of different
gene lengths. For alternative splicing, however, it is important to correct for the
opportunity for alternative splicing to be somehow linked to gene length. For
example, genes involved in neuronal development are among the longest genes
and also contain the genes with the largest number of isoforms (Barbosa-Morais
et al., 2012).
To account for the differential splicing potential among the different functional
gene categories, we used the Gowinda software tool (Kofler & Schlötterer, 2012).
Rather than SNPs as in the original publication, we used sub-exons as the unit of
observation. We assessed the enrichment of genes by randomly sampling
sub-exons from the set of all sub-sub-exons present in our data set and compare the
randomly sampled sets to the observed set of differentially expressed sub-exons.
By selecting the “gene based” analysis option we avoid erroneous enrichments in
GO categories containing very long genes that have higher number of sub-exons
and therefore a greater chance to have at least one of their sub-exons
differentially expressed. The significance of overrepresentation of spliced genes
in a category is estimated from the empirical null distribution created by
permutation sampling of sub-exons from the total number of sub-exons. Also an
empirical false discovery rate (FDR) is calculated to correct for multiple testing.
The parameter we used are --simulations 1000000 --min-significance 1
--gene-definition gene --threads 20 --mode gene --min-genes 1e used a threshold of
FDR< 0.05 in this analysis.
To assess the overlap between two sets of sub-exons (or GO categories) we used
a modified receiver-operator curve (ROC) analysis where both sets of sub-exons
(or GO categories) are first ranked according to FDR corrected p-values and
binned in increasingly larger bins. When equation 2 is satisfied, it indicates that
the number of sub-exons (or GO categories) shared between the two data sets is
expected by chance.
(2)
with A and B being sub-exon sets contained in the bin i of size n. In the case that
equation 2 is not met and the left side of the equation is larger (smaller) than the
right side, the overlap of sub-exons (or GO categories) is higher (less) than
expected by chance.
A
iÇ
B
in
i=
12
SUPPORTING FIGURES
Figure G. Exon inclusion and exclusion. Density plot of log2 fold change for
Figure H. Overlap between genetically and environmentally induced
differences in splicing is only slightly higher than expected by chance. The
ROC-like curve indicates that the overlap of most significantly differentially
expressed exons (A) and most significantly enriched GO categories (B) is lower
than 20% for both the comparisons between environmentally induced
differential splicing in Oregon-R (13°C vs. 29°C) and genotypically induced
differential splicing (blue at 13°C; magenta at 29°C) and for comparisons
between environmentally induced differential splicing in Samarkand (13°C vs.
29°C) compared to genotypically induced differential splicing (green 13°C;
yellow 29°C). Note that the GO analysis is restricted to transcripts truncated to
1kb. There was only 1 significantly enriched GO category for genotype
differences at 13°C and none for 29°C.
Figure I. Differential splicing and gene expression differences are not
correlated. (A) ROC-like curves show limited overlap between exons that are
14
Figure J. Allelic imbalance for genes with dominant differences in
alternative splicing. The widespread dominance of difference in alternative
SUPPORTING TABLES
Table C. Numbers of genes and exons used in analyses. We restricted our
analyses to multi-exon genes. Only exons with an average of 50 reads across all
samples were included in the analysis.
Between temperature comparisons*
Oregon-R Samarkand Exons Genes Exons Genes 13°C:18°C 18684 5398 17443 5108 13°C:23°C 18741 5411 17980 5263 13°C:29°C 18907 5463 18189 5277 18°C:23°C 16024 4738 16753 4964 18°C:29°C 16259 4818 17179 5040 23°C:29°C 16140 4788 17473 5128
Between genotype comparisons
Exons Genes 13°C 49675 8858 18°C 39839 8021 23°C 41415 8090 29°C 43598 8186
Parent:hybrid comparisons
Oregon-R:F1 Samarkand:F1 Exons Genes Exons Genes
16
Table D. Enriched splicing factors. Expression levels (fold change between
genotypes) of splicing factors enriched among differentially spliced genes and
mean log2FC expression of differentially spliced exons of their target genes.
Splicing factor 13° (log2FC) 29° (log2FC) Enrichment (FDR) FBgn0016978 Expression 0.4588179 -0.9970979 0.0003
Target gene splicing -0.4448631 0.2131981
FBgn0034237 Expression -0.3557789 1.494437 0.0008 Target gene splicing -0.0406573 0.2351111
FBgn0014870 Expression -0.04421718 0.08564842 0.0025 Target gene splicing -0.5431015 0.1904218
FBgn0086895 Expression -0.479691 -0.2391361 0.0032 Target gene splicing -0.1679616 0.1663099
FBgn0052423 Expression -0.2825182 1.046229 0.0039 Target gene splicing -0.3714648 0.1525109
FBgn0043884 Expression 1.053044 0.7595915 0.0040 Target gene splicing 0.2343859 0.2400676
FBgn0004237 Expression 0.6325645 0.7301817 0.0054 Target gene splicing 0.07591968 0.2010865
FBgn0003742 Expression 0.4954141 -0.1337727 0.0054 Target gene splicing 1.568466 0.303582
FBgn0002622 Expression 0.4094199 -0.5025998 0.0064 Target gene splicing -0.1965331 0.1701375
FBgn0003261 Expression 0.1514235 0.4385707 0.0079 Target gene splicing -0.1031118 0.2371531
FBgn0265298 Expression 0.3814688 -1.101479 0.0110 Target gene splicing -0.2191292 0.2000744
FBgn0015778 Expression 0.07093362 0.7919228 0.0110 Target gene splicing -0.4963501 0.138276
FBgn0037707 Expression 0.5810485 -0.957719 0.0131 Target gene splicing -0.3245482 0.1524923
FBgn0037081 Expression -0.6283451 0.398747 0.0254 Target gene splicing -0.0378984 0.2111358
FBgn0033378 Expression 0.1359079 -1.024293 0.0254 Target gene splicing 0.01102423 0.152548
FBgn0024285 Expression -0.2871507 1.52559 0.0254 Target gene splicing 0.2008206 0.2267776
FBgn0004838 Expression 0.3086141 -0.04624664 0.0304 Target gene splicing -0.07199447 0.2308261
FBgn0004587 Expression -0.365944 -0.2019777 0.0304 Target gene splicing -0.1613062 0.1874542