Forest Health Monitoring:
National Status, Trends, and Analysis 2016
Editors
Kevin M. Potter
Barbara L. Conkling
United States Department of Agriculture
Forest Service
July 2017
Southern Research Station
200 W.T. Weaver Blvd.
Asheville, NC 28804
www.srs.fs.usda.gov
Front cover map: Ecoregion provinces and ecoregion sections for the conterminous United States
(Cleland and others 2007), and for Alaska (Nowacki and Brock 1995) and the islands of Hawai‘i.
Back cover map: Forest cover (green) backdrop derived from Moderate Resolution
Imaging Spectroradiometer (MODIS) satellite imagery by the U.S. Forest Service
Remote Sensing Applications Center.
DISCLAIMER
The use of trade or firm names in this publication is for reader information and does not imply
endorsement by the U.S. Department of Agriculture of any product or service.
PESTICIDE PRECAUTIONARY STATEMENT
This publication reports research involving pesticides. It does not contain recommendations for their use,
nor does it imply that the uses discussed here have been registered. All uses of pesticides must be registered
by appropriate State and/or Federal agencies before they can be recommended.
CAUTION
Pesticides can be injurious to humans, domestic animals, desirable plants, and fish or other
wildlife—if they are not handled or applied properly. Use all pesticides selectively and carefully. Follow
Editors
Kevin M. Potter,
Research Associate Professor, North Carolina State
University, Department of Forestry and Environmental Resources,
Raleigh, NC 27695
Barbara L. Conkling,
Research Assistant Professor, North Carolina
State University, Department of Forestry and Environmental
Resources, Raleigh, NC 27695
Forest Health Monitoring:
5
F
orests cover a vast area of the United
States, 304 million ha or approximately
one-third of the Nation’s land area (Smith
and others 2009). These forests possess the
capacity to provide a broad range of goods and
services to current and future generations, to
safeguard biological diversity, and to contribute
to the resilience of ecosystems, societies, and
economies (USDA Forest Service 2011). Their
ecological roles include supplying large and
consistent quantities of clean water, preventing
soil erosion, and providing habitat for a broad
diversity of plant and animal species. Their
socioeconomic benefits include wood products,
nontimber goods, recreational opportunities,
and pleasing natural beauty. Both the ecological
integrity and the continued capacity of these
forests to provide ecological and economic
goods and services are of concern, however,
in the face of a long list of threats, including
insect and disease infestation, fragmentation,
catastrophic fire, invasive species, and the effects
of climate change.
Natural and anthropogenic stresses
vary among biophysical regions and local
environments; they also change over time and
interact with each other. These and other factors
make it challenging to establish baselines of
forest health and to detect important departures
from normal forest ecosystem functioning
(Riitters and Tkacz 2004). Monitoring the health
of forests is a critically important task, however,
reflected within the Criteria and Indicators for
the Conservation and Sustainable Management
of Temperate and Boreal Forests (Montréal
Process Working Group 1995), which the Forest
Service, U.S. Department of Agriculture (USDA),
uses as a forest sustainability assessment
framework (USDA Forest Service 2004, 2011).
The primary objective of such monitoring is to
identify ecological resources whose condition is
deteriorating in subtle ways over large regions
in response to cumulative stresses, a goal that
requires consistent, large-scale, and long-term
monitoring of key indicators of forest health
status, change, and trends (Riitters and Tkacz
2004). This is best accomplished through
the participation of multiple Federal, State,
academic, and private partners.
Although the concept of a healthy forest has
universal appeal, forest ecologists and managers
have struggled with how exactly to define
forest health (Teale and Castello 2011), and
there is no universally accepted definition. Most
definitions of forest health can be categorized as
representing either an ecological or a utilitarian
perspective (Kolb and others 1994). From an
ecological perspective, the current understanding
of ecosystem dynamics suggests that healthy
ecosystems are those that are able to maintain
their organization and autonomy over time
while remaining resilient to stress (Costanza
1992), and that evaluations of forest health
should emphasize factors that affect the inherent
processes and resilience of forests (Edmonds and
others 2011, Kolb and others 1994, Raffa and
others 2009). On the other hand, the utilitarian
perspective holds that a forest is healthy if
management objectives are met, and that a
forest is unhealthy if these objectives are not met
(Kolb and others 1994). Although this definition
may be appropriate when a single, unambiguous
CHAPTER 1.
Introduction
Forest Health Monitoring
6
Chapter 1
management objective exists, such as the
production of wood fiber or the maintenance
of wilderness attributes, it is too narrow when
multiple management objectives are required
(Edmonds and others 2011, Teale and Castello
2011). Teale and Castello (2011) incorporate
both ecological and utilitarian perspectives
into their two-component definition of forest
health: First, a healthy forest must be sustainable
with respect to its size structure, including a
correspondence between baseline and observed
mortality; second, a healthy forest must meet
the landowner’s objectives, provided that these
objectives do not conflict with sustainability.
This national report, the 16th in an annual
series sponsored by the Forest Health Monitoring
(FHM) Program of the Forest Service, U.S.
Department of Agriculture, attempts to quantify
the status of, changes to, and trends in a wide
variety of broadly defined indicators of forest
health. The indicators described in this report
encompass forest insect and disease activity,
wildland fire occurrence, drought, tree mortality,
understory vegetation, and regeneration, among
others. The previous reports in this series are
Ambrose and Conkling (2007, 2009), Conkling
(2011), Conkling and others (2005), Coulston
and others (2005a, 2005b, 2005c), and Potter
and Conkling (2012a, 2012b; 2013a, 2013b;
2014; 2015a, 2015b, 2016).
This report has three specific objectives. The
first is to present information about forest health
from a national perspective, or from a
multi-State regional perspective when appropriate,
using data collected by the Forest Health
Protection (FHP) and Forest Inventory and
Analysis (FIA) programs of the Forest Service,
as well as from other sources available at a wide
extent. The chapters that present analyses at
a national-scale, or multi-State regional scale,
are divided between section 1 and section 2 of
the report. Section 1 presents results from the
analyses of forest health data that are available
on an annual basis. Such repeated analyses
of regularly collected indicator measurements
allow for the detection of trends over time and
help establish a baseline for future comparisons
(Riitters and Tkacz 2004). Section 2 presents
longer-term forest health trends, in addition to
describing new techniques for analyzing forest
health data at national or regional scales (the
second objective of the report). While in-depth
interpretation and analysis of specific geographic
or ecological regions are beyond the scope of
these parts of the report, the chapters in sections
1 and 2 present information that can be used to
identify areas that may require investigation at a
finer scale.
7
mortality predicted by the National Insect
and Disease Risk Map with FIA estimates
of mortality.
The third objective of the report is to present
results of recently completed Evaluation
Monitoring (EM) projects funded through
the FHM national program. These project
summaries, presented in section 3, determine
the extent, severity, and/or cause of forest health
problems (FHM 2016), generally at a finer scale
than that addressed by the analyses in sections
1 and 2. Each of the six chapters in section 3
contains an overview of an EM project, key
results, and contacts for more information.
When appropriate throughout this report,
authors use the USDA Forest Service revised
ecoregions (Cleland and others 2007, Nowacki
and Brock 1995) as a common
ecologically-based spatial framework for their forest health
assessments (fig. 1.1). Specifically, when the
spatial scale of the data and the expectation
of an identifiable pattern in the data are
appropriate, authors use ecoregion sections or
provinces as assessment units for their analyses.
Bailey’s hierarchical system bases the two
broadest ecoregion scales, domains and divisions,
on large ecological climate zones, while each
division is broken into provinces based on
vegetation macro features (Bailey 1995).
Provinces are further divided into sections,
which may be thousands of square kilometers
in area and are expected to encompass regions
similar in their geology, climate, soils, potential
natural vegetation, and potential natural
communities (Cleland and others 1997).
THE FOREST HEALTH
MONITORING PROGRAM
The national FHM Program is designed to
determine the status, changes, and trends in
indicators of forest condition on an annual
basis and covers all forested lands through a
partnership encompassing the Forest Service,
State foresters, and other State and Federal
agencies and academic groups (FHM 2016).
The FHM Program utilizes data from a wide
variety of data sources, both inside and outside
the Forest Service, and develops analytical
approaches for addressing forest health issues
that affect the sustainability of forest ecosystems.
The FHM Program has five major components
(fig. 1.2):
• Detection Monitoring—nationally
standardized aerial and ground surveys to
evaluate status and change in condition
of forest ecosystems (sections 1 and 2 of
this report).
• Evaluation Monitoring—projects to
determine the extent, severity, and causes of
undesirable changes in forest health identified
through Detection Monitoring (section 3 of
this report).
Forest Health Monitoring
8
Chapter 1
321A 251C 331F 322A 251B 223A 232B 315B 231I 332E 231E 322B 332C 331K 331M 232J 342I 221E 255A 315C 315E 313A 231A 231B 222H 341F 341A 342B 331C 313B 332A 331B 222J 223E 251D 331I 332F 331G 315D 342D 232F 222L 342G 341E 341B 212H 251E 331H 223G 331D M313A 255E 342C 223D 331L 212N 223F 212X M332E M231A 232C 331E 231H 222M 234D 251H 221A 255C M221A 262A M331I 222K 315A 342F 211F M341A M261E 232E 321B 315F 255D 313D 332B 255B 251A M332A M242B 232H M221D 222I 221F M211A M242A 221D M331D 313C 221H M332G 232I M261A 222U M331A M332D 232D 234A 212L 232K 232G 251F 231G 231C M313B M333A M331G 342A M242D 411A 332D M221C 231D 212K 212M 341G M262B 212T M341D 315G M221B 342J 232A 221J 342H M242C 211G M333D M262A 331N M211D M331F M331H M341C 331A M261G 341D M333B M332B 232L M341B 211D 211E 263A 242B 331J 212R M333C 212Q 223B M261F M261D 322C 261B 211B M211B 234E 261A 221B M223A 234C 211I M261B M331E 222N 211J 242A M332F 212S M211C 211A 315H M334A 212J 222R 341C 342E M331B 212Z 211C M261C 212Y M331J M125A 125A 129B M135C 121A M139C M139A M131A M129A 139A M131D M135B 131A M131C 131B 213A M131B M139B M213A M129B M244B 129A 213B 135A M244C M271A M244A M213B M245A M245B M135A 271A 245A M271B9
Alaska Mixed Forest (213) Alaska Range Taiga (135) Aleutian Meadow (271) Arctic Tundra (121) Bering Sea Tundra (129) Brooks Range Tundra (125) Pacific Coastal Icefields (244) Pacific Gulf Coast Forest (245) Upper Yukon Taiga (139) Yukon Intermontaine Taiga (131)
Adirondack-New England Mixed Forest—Coniferous Forest—Alpine Meadow (M211) American Semi-Desert and Desert (322)
Arizona-New Mexico Mountains Semi-Desert—Open Woodland—Coniferous Forest—Alpine Meadow (M313) Black Hills Coniferous Forest (M334)
California Coastal Chaparral Forest and Shrub (261)
California Coastal Range Open Woodland—Shrub—Coniferous Forest—Meadow (M262) California Coastal Steppe—Mixed Forest—Redwood Forest (263)
California Dry Steppe (262)
Cascade Mixed Forest—Coniferous Forest—Alpine Meadow (M242) Central Appalachian Broadleaf Forest—Coniferous Forest—Meadow (M221) Central Interior Broadleaf Forest (223)
Chihuahuan Semi-Desert (321) Colorado Plateau Semi-Desert (313) Eastern Broadleaf Forest (221) Everglades (411)
Great Plains—Palouse Dry Steppe (331) Great Plains Steppe (332)
Intermountain Semi-Desert and Desert (341) Intermountain Semi-Desert (342)
Laurentian Mixed Forest (212) Lower Mississippi Riverine Forest (234)
Middle Rocky Mountain Steppe—Coniferous Forest—Alpine Meadow (M332) Midwest Broadleaf Forest (222)
Nevada-Utah Mountains Semi-Desert—Coniferous Forest—Alpine Meadow (M341) Northeastern Mixed Forest (211)
Northern Rocky Mountain Forest-Steppe—Coniferous Forest—Alpine Meadow (M333) Ouachita Mixed Forest—Meadow (M231)
Outer Coastal Plain Mixed Forest (232) Ozark Broadleaf Forest (M223) Pacific Lowland Mixed Forest (242) Prairie Parkland (Subtropical) (255) Prairie Parkland (Temperate) (251)
Sierran Steppe—Mixed Forest—Coniferous Forest—Alpine Meadow (M261) Southeastern Mixed Forest (231)
Southern Rocky Mountain Steppe—Open Woodland—Coniferous Forest—Alpine Meadow (M331) Southwest Plateau and Plains Dry Steppe and Shrub (315)
Alaska Ecoregion Provinces
Forest Health Monitoring
10
Chapter 1
• Research on Monitoring Techniques—work
to develop or improve indicators, monitoring
systems, and analytical techniques,
such as urban and riparian forest health
monitoring, early detection of invasive
species, multivariate analyses of forest health
indicators, and spatial scan statistics (section 2
of this report).
• Analysis and Reporting—synthesis of
information from various data sources within
and external to the Forest Service to produce
issue-driven reports on status and change in
forest health at national, regional, and State
levels (sections 1, 2, and 3 of this report).
The FHM Program, in addition to national
reporting, generates regional and State reports,
often in cooperation with FHM partners, both
11
within the Forest Service and in State forestry
and agricultural departments. For example, the
FHM regions cooperate with their respective
State partners to produce the annual Forest
Health Highlights report series, available on the
FHM Web site at www.fs.fed.us/foresthealth/
fhm. Other examples include Steinman (2004)
and Harris and others (2011).
The FHM Program and its partners also
produce reports and journal articles on
monitoring techniques and analytical methods,
including forest health data (Smith and
Conkling 2004, Potter and others 2016); soils as
an indicator of forest health (O’Neill and others
2005); urban forest health monitoring (Bigsby
and others 2014; Cumming and others 2006,
2007; Lake and others 2006); remote sensing of
forest disturbances (Chastain and others 2015,
Rebbeck and others 2015); health conditions in
national forests (Morin and others 2006); crown
conditions (Morin and others 2015; Randolph
2010a, 2010b, 2013; Randolph and Moser
2009; Schomaker and others 2007); indicators
of regeneration (McWilliams and others 2015);
vegetation diversity and structure (Schulz and
Gray 2013, Schulz and others 2009, Simkin
and others 2016); forest lichen communities
(Jovan and others 2012, Root and others 2014);
downed woody materials in forests (Woodall and
others 2012, 2013); drought (Vose and others
2016); ozone monitoring (Rose and Coulston
2009); patterns of nonnative invasive plant
occurrence (Guo and others 2015; Oswalt and
others 2015; Iannone and others 2015, 2016);
assessments of alien-invasive forest insect and
disease risk (Koch and others 2011, 2014; Krist
and others 2014; Yemshanov and others 2014;
Vogt and Koch 2016); spatial patterns of land
cover (Riitters 2011; Riitters and others 2012,
2016; Riitters and Wickham 2012); broad-scale
assessments of forest biodiversity (Potter and
Koch 2014; Potter and Woodall 2012, 2014);
predictions and indicators of climate change
effects on forests and forest tree species (Potter
and Hargrove 2013, Heath and others 2015);
and the overall forest health indicator program
(Woodall and others 2010).
For more information about the FHM
Program, visit the FHM Web site at www.fs.fed.
us/foresthealth/fhm. Among other things, this
Web site includes links to all past national forest
health reports (www.fs.fed.us/foresthealth/fhm/
pubs), information about funded Evaluation
Monitoring projects (www.fs.fed.us/foresthealth/
fhm/em), and annual State forest health
highlight reports (www.fs.fed.us/foresthealth/
fhm/fhh/fhmusamap.shtml).
DATA SOURCES
Forest Health Monitoring
12
Chapter 1
and forest cover data developed from MODIS
satellite imagery by the U.S. Forest Service
Remote Sensing Applications Center. Other
sources of data include Parameter-elevation
Regression on Independent Slopes Model
(PRISM) climate mapping system data (PRISM
Climate Group 2016), FIA’s publicly available
Environmental Monitoring and Assessment
Program (EMAP) hexagons (Brand and others
2000), and the 2013–2027 National Insect and
Disease Risk Map (Krist and others 2014).
As a major source of data for several FHM
analyses, the FIA Program merits detailed
description. The FIA Program collects forest
inventory information across all forest land
ownerships in the United States, and maintains
a network of more than 130,000 permanent
forested ground plots across the conterminous
United States and southeastern Alaska, with
a sampling intensity of approximately one
plot per 2428 ha. FIA phase 2 encompasses
the annualized inventory measured on plots
at regular intervals, with each plot surveyed
every 5 to 7 years in most Eastern States, but
with plots in the Rocky Mountain and Pacific
Northwest regions surveyed once every 10 years
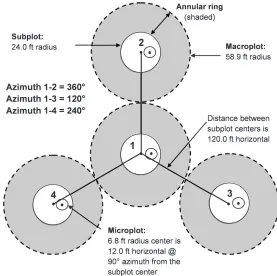
(Reams and others 2005). The standard 0.067- ha
plot (fig. 1.3) consists of four 7.315-m radius
subplots (approximately 168.6 m
2or 1/24th
acre), on which field crews measure trees at
least 12.7 cm in diameter. Within each of these
subplots is nested a 2.073-m radius microplot
(approximately 13.48 m
2or 1/300th acre), on
which crews measure trees smaller than 12.7 cm
in diameter. A core-optional variant of the
standard design includes four “macroplots,” each
with a radius of 17.953 m (or approximately
0.1012 ha) that originates at the center of each
subplot (Woudenberg and others 2010).
FIA phase 3 plots represent a subset of these
phase 2 plots, with one phase 3 plot for every
16 standard FIA phase 2 plots. In addition to
traditional forest inventory measurements, data
for a variety of important ecological indicators
13
can be collected from phase 3 plots, including
tree crown condition, lichen communities, down
woody material, soil condition, and vegetation
structure and diversity, whereas data on ozone
bioindicator plants are collected on a separate
grid of plots (Woodall and others 2010, 2011).
Most of these additional forest health indicators
were measured as part of the FHM Detection
Monitoring ground plot system prior to 2000
1(Palmer and others 1991).
FHM REPORT PRODUCTION
This FHM national report, the 16th in a series
of such annual documents, is produced by forest
health monitoring researchers at the Eastern
Forest Environmental Threat Assessment Center
(EFETAC) in collaboration with North Carolina
State University cooperators. A unit of the
Southern Research Station of the Forest Service,
EFETAC was established under the Healthy
Forests Restoration Act of 2003 to generate
the knowledge and tools needed to anticipate
and respond to environmental threats. For
more information about the research team and
about threats to U.S. forests, please visit www.
forestthreats.org/about.
1 USDA Forest Service. 1998. Forest Health Monitoring
1998 field methods guide. Research Triangle Park, NC: U.S. Department of Agriculture, Forest Service, Forest Health Monitoring Program, 473 p. On file with: Forest Health Monitoring Program, 3041 Cornwallis Rd., Research Triangle Park, NC 27709.
LITERATURE CITED
Ambrose, M.J.; Conkling, B.L., eds. 2007. Forest Health Monitoring 2005 national technical report. Gen. Tech. Rep. SRS-104. Asheville, NC: U.S. Department of Agriculture, Forest Service, Southern Research Station. 76 p.
Ambrose, M.J.; Conkling, B.L., eds. 2009. Forest Health Monitoring 2006 national technical report. Gen. Tech. Rep. SRS-117. Asheville, NC: U.S. Department of Agriculture, Forest Service, Southern Research Station. 118 p.
Bailey, R.G. 1995. Descriptions of the ecoregions of the United States. 2d ed. Miscellaneous Publication No. 1391. Washington, DC: U.S. Department of Agriculture, Forest Service. 108 p. [Map scale 1:7,500,000].
Bechtold, W.A.; Patterson, P.L., eds. 2005. The enhanced Forest Inventory and Analysis program—national sampling design and estimation procedures. Gen. Tech. Rep. SRS-80. Asheville, NC: U.S. Department of Agriculture, Forest Service, Southern Research Station. 85 p.
Bigsby, K.M.; Ambrose, M.J.; Tobin, P.C.; Sills, E.O. 2014. The cost of gypsy moth sex in the city. Urban Forestry & Urban Greening. 13(3): 459–468.
Brand, G.J.; Nelson, M.D.; Wendt, D.G.; Nimerfro, K.K. 2000. The hexagon/panel system for selecting FIA plots under an annual inventory. In: McRoberts, R.E.; Reams, G.A.; Van Deusen, P.C., eds. Proceedings of the first annual Forest Inventory and Analysis symposium. Gen. Tech. Rep. NC-213. St. Paul, MN: U.S. Department of Agriculture, Forest Service, North Central Research Station: 8–13.
Chastain, R.A.; Fisk, H.; Ellenwood, J.R. [and others]. 2015. Near-real time delivery of MODIS-based information on forest disturbances. In: Lippitt, C.D.; Stow, D.A.; Coulter, L.L., eds. Time sensitive remote sensing. New York, NY: Springer: 147–164.
Forest Health Monitoring
14
Chapter 1
Cleland, D.T.; Freeouf, J.A.; Keys, J.E. [and others]. 2007. Ecological subregions: sections and subsections for the conterminous United States. Gen. Tech. Report WO-76D [Map; Sloan, A.M., cartographer; presentation scale 1:3,500,000; colored]. Washington, DC: U.S. Department of Agriculture, Forest Service. Also on CD-ROM as a GIS coverage in ArcINFO format or at http://data.fs.usda.gov/ geodata/edw/datasets.php. [Date accessed: July 20, 2015]. Conkling, B.L., ed. 2011. Forest Health Monitoring 2007
national technical report. Gen. Tech. Rep. SRS-147. Asheville, NC: U.S. Department of Agriculture, Forest Service, Southern Research Station. 159 p.
Conkling, B.L.; Coulston, J.W.; Ambrose, M.J., eds. 2005. Forest Health Monitoring 2001 national technical report. Gen. Tech. Rep. SRS-81. Asheville, NC: U.S. Department of Agriculture, Forest Service, Southern Research Station. 204 p.
Costanza, R. 1992. Toward an operational definition of ecosystem health. In: Costanza, R.; Norton, B.G.; Haskell, B.D., eds. Ecosystem health: new goals for environmental management. Washington, DC: Island Press: 239–256. Coulston, J.W.; Riitters, K.H.; Conkling, B.L., eds. 2005a.
Forest Health Monitoring 2002 national technical report. Gen. Tech. Rep. SRS-84. Asheville, NC: U.S. Department of Agriculture, Forest Service, Southern Research Station. 97 p.
Coulston, J.W.; Ambrose, M.J.; Riitters, K.H. [and others], eds. 2005b. Forest Health Monitoring 2003 national technical report. Gen. Tech. Rep. SRS-85. Asheville, NC: U.S. Department of Agriculture, Forest Service, Southern Research Station. 97 p.
Coulston, J.W.; Ambrose, M.J.; Riitters, K.H.; Conkling, B.L., eds. 2005c. Forest Health Monitoring 2004 national technical report. Gen. Tech. Rep. SRS-90. Asheville, NC: U.S. Department of Agriculture, Forest Service, Southern Research Station. 81 p.
Cumming, A.B.; Nowak, D.J.; Twardus, D.B. [and others]. 2007. Urban forests of Wisconsin: pilot monitoring project 2002. NA-FR-05-07. Newtown Square, PA: U.S. Department of Agriculture, Forest Service, Northeastern Area State and Private Forestry. 33 p. Low resolution: http://www.na.fs.fed.us/pubs/fhm/pilot/pilot_study_ wisconsin_02_lr.pdf. High resolution: http://www.na.fs. fed.us/pubs/fhm/pilot/pilot_study_wisconsin2_02_hr.pdf. [Date accessed: October 19, 2007].
Cumming, A.B.; Twardus, D.B.; Smith, W.D. 2006. National Forest Health Monitoring Program, Maryland and Massachusetts street tree monitoring pilot projects. NA- FR-01-06. Newtown Square, PA: U.S. Department of Agriculture, Forest Service, Northeastern Area, State and Private Forestry. 23 p.
Edmonds, R.L.; Agee, J.K.; Gara, R.I. 2011. Forest health and protection. Long Grove, IL: Waveland Press, Inc. 667 p. Forest Health Monitoring (FHM). 2003. Forest Health
Monitoring: a national strategic plan. http://fhm.fs.fed. us/annc/strategic_plan03.pdf. 7 p. [Date accessed: June 28, 2013].
Forest Health Monitoring (FHM). 2016. Program description. Forest Health Monitoring Fact Sheet Series. http://www. fhm.fs.fed.us/fact/. [Date accessed: September 8, 2016]. Forest Health Protection (FHP). 2014. Insect and Disease
Detection Survey Database (IDS) [database on the Internet]. Fort Collins, CO: U.S. Department of Agriculture, Forest Service, Forest Health Technology Enterprise Team. http://foresthealth.fs.usda.gov/ids. [Date accessed: September 8, 2016].
Guo, G.; Fei, S.; Dukes, J.S. [and others]. 2015. A unified approach to quantify invisibility and degree of invasion. Ecology. 95(10): 2613-2621.
Harris, J.L., comp.; Region 2 Forest Health Protection staff. 2011. Forest health conditions, 2009–2010: Rocky Mountain Region (R2). R2-11-RO-31. Golden, CO: U.S. Department of Agriculture, Forest Service, Renewable Resources, Forest Health Protection, Rocky Mountain Region. 108 p.
Heath, L.S.; Anderson, S.; Emery, M.R. [and others]. 2015. Indicators for climate change impacts for forests: national climate assessment indicators. Gen. Tech. Rep. NRS-155. Newtown Square, PA: U.S. Department of Agriculture, Forest Service, Northern Research Station. 143 p. Iannone, B.V.; Oswalt, C.M.; Liebhold, A.M. [and others].
2015. Region-specific patterns and drivers of macroscale forest plant invasions. Diversity and Distributions. 21: 1181-1192.
15
Jovan, S.; Riddell, J.; Padgett, P.E.; Nash, T.H., III. 2012. Eutrophic lichens respond to multiple forms of N: implications for critical levels and critical loads research. Ecological Applications. 22(7): 1910–1922.
Koch, F.H.; Yemshanov, D.; Colunga-Garcia, M. [and others]. 2011. Potential establishment of alien-invasive forest insect species in the United States: where and how many? Biological Invasions. 13: 969–985.
Koch, F.H.; Yemshanov, D.; Haack, R.A.; Magarey, R.D. 2014. Using a network model to assess risk of forest pest spread via recreational travel. PLoS ONE 9(7): e102105. Kolb, T.E.; Wagner, M.R.; Covington, W.W. 1994. Concepts
of forest health: utilitarian and ecosystem perspectives. Journal of Forestry. 92: 10–15.
Krist, F.J., Jr.; Ellenwood, J.R.; Woods, M.E. [and others]. 2014. 2012–2027 national insect and disease forest risk assessment. FHTET-14-01. U.S. Department of Agriculture, Forest Service, Forest Health Technology Enterprise Team. 199 p. http://www.fs.fed.us/foresthealth/technology/ pdfs/2012_RiskMap_Report_web.pdf. [Date accessed: July 24, 2014].
Lake, M.; Marshall, P.; Mielke, M. [and others]. 2006. National Forest Health Monitoring Program monitoring urban forests in Indiana: pilot study 2002, part 1. Analysis of field methods and data collection. Gen. Tech Rep. NA FR-06-06. Newtown Square, PA: U.S. Department of Agriculture, Forest Service, Northeastern Area. http://www.fhm.fs.fed.us/pubs/ufhm/indianaforests02/ indianaforests02.html. [Date accessed: November 6, 2007]. McWilliams, W.H.; Westfall, J.A.; Brose, P.H. [and others]
2015. A regeneration indicator for Forest Inventory and Analysis: history, sampling, estimation, analytics, and potential use in the Midwest and Northeast United States. Gen. Tech. Rep. NRS-148. Newtown Square, PA: U.S. Department of Agriculture, Forest Service, Northern Research Station. 74 p.
Montréal Process Working Group. 1995. Criteria and indicators for the conservation and sustainable
management of temperate and boreal forests. http://www. montrealprocess.org/. [Date accessed: March 4, 2015].
Morin, R.S.; Liebhold, A.M.; Gottschalk, K.W. [and others]. 2006. Analysis of Forest Health Monitoring surveys on the Allegheny National Forest (1998–2001). Gen. Tech. Rep. NE-339. Newtown Square, PA: U.S. Department of Agriculture, Forest Service, Northeastern Research Station. 102 p. http://www.fs.fed.us/ne/newtown_square/ publications. [Date accessed: November 6, 2007]. Morin, R.S.; Randolph, K.C.; Steinman, J. 2015. Mortality
rates associated with crown health for eastern forest tree species. Environmental Monitoring and Assessment. 187(3): 87.
Nowacki, G.; Brock, T. 1995. Ecoregions and subregions of Alaska [EcoMap]. Version 2.0. Juneau, AK: U.S. Department of Agriculture, Forest Service, Alaska Region. [Map, presentation scale 1:5,000,000; colored].
O’Neill, K.P.; Amacher, M.C.; Perry, C.H. 2005. Soils as an indicator of forest health: a guide to the collection, analysis, and interpretation of soil indicator data in the Forest Inventory and Analysis Program. Gen. Tech. Rep. NC-258. St. Paul, MN: U.S. Department of Agriculture, Forest Service, North Central Research Station. 53 p. Oswalt, C.M.; Fei, S.; Guo, G. [and others]. 2015. A
subcontinental view of forest plant invasions. NeoBiota. 24: 49–54.
Palmer, C.J.; Riitters, K.H.; Strickland, T. [and others]. 1991. Monitoring and research strategy for forests— Environmental Monitoring and Assessment Program (EMAP). EPA/600/4-91/012. Washington, DC: U.S. Environmental Protection Agency. 189 p. Potter, K.M.; Conkling, B.L., eds. 2012a. Forest Health
Monitoring 2008 national technical report. Gen. Tech. Rep. SRS-158. Asheville, NC: U.S. Department of Agriculture, Forest Service, Southern Research Station. 179 p.
Potter, K.M.; Conkling, B.L., eds. 2012b. Forest Health Monitoring 2009 national technical report. Gen. Tech. Rep. SRS-167. Asheville, NC: U.S. Department of Agriculture, Forest Service, Southern Research Station. 252 p.
Forest Health Monitoring
16
Chapter 1
Potter, K.M.; Conkling, B.L., eds. 2013b. Forest Health Monitoring: national status, trends, and analysis 2011. Gen. Tech. Rep. SRS-185. Asheville, NC: U.S. Department of Agriculture, Forest Service, Southern Research Station. 149 p.
Potter, K.M.; Conkling, B.L., eds. 2014. Forest Health Monitoring: national status, trends, and analysis 2012. Gen. Tech. Rep. SRS-198. Asheville, NC: U.S. Department of Agriculture, Forest Service, Southern Research Station. 192 p.
Potter, K.M.; Conkling, B.L., eds. 2015a. Forest Health Monitoring: national status, trends, and analysis, 2013. Gen. Tech. Rep. SRS-207. Asheville, NC: U.S. Department of Agriculture, Forest Service, Southern Research Station. 199 p.
Potter, K.M.; Conkling, B.L., eds. 2015b. Forest Health Monitoring: national status, trends, and analysis, 2014. Gen. Tech. Rep. SRS-209. Asheville, NC: U.S. Department of Agriculture, Forest Service, Southern Research Station. 190 p.
Potter, K.M.; Conkling, B.L., eds. 2016. Forest Health Monitoring: national status, trends, and analysis, 2015. Gen. Tech. Rep. SRS-213. Asheville, NC: U.S. Department of Agriculture, Forest Service, Southern Research Station. 199 p.
Potter, K.M; Hargrove, W.W. 2013. Quantitative metrics for assessing predicted climate change pressure on North American tree species. Mathematical and Computational Forestry and Natural Resources Sciences. 5(2): 151–169. Potter, K.M.; Koch, F.H. 2014. Phylogenetic community
structure of forests across the conterminous United States: regional ecological patterns and forest health implications. Forest Science. 60(5): 851–861.
Potter, K.M.; Koch, F.H.; Oswalt, C.M.; Iannone, B.V. 2016. Data, data everywhere: detecting spatial patterns in fine-scale ecological information collected across a continent. Landscape Ecology. 31: 67–84.
Potter, K.M.; Woodall, C.W. 2012. Trends over time in tree and seedling phylogenetic diversity indicate regional differences in forest biodiversity change. Ecological Applications. 22(2): 517–531.
Potter, K.M.; Woodall, C.W. 2014. Does biodiversity make a difference? Relationships between species richness, evolutionary diversity, and aboveground live tree biomass across U.S. forests. Forest Ecology and Management. 321: 117–129.
PRISM Climate Group. 2016. 2.5-arcmin (4 km) gridded monthly climate data. http://www.prism.oregonstate.edu. [Date accessed: June 30, 2016].
Raffa, K.F.; Aukema, B.; Bentz, B.J. [and others]. 2009. A literal use of “forest health” safeguards against misuse and misapplication. Journal of Forestry. 107: 276–277. Randolph, K.C. 2010a. Equations relating compacted and
uncompacted live crown ratio for common tree species in the South. Southern Journal of Applied Forestry. 34(3): 118–123.
Randolph, K.C. 2010b. Comparison of the arithmetic and geometric means in estimating crown diameter and crown cross-sectional area. Southern Journal of Applied Forestry. 34(4): 186–189.
Randolph, K.C. 2013. Development history and bibliography of the U.S. Forest Service crown-condition indicator for forest health monitoring. Environmental Monitoring and Assessment. 185(6): 4977–4993.
Randolph, K.C.; Moser, W.K. 2009. Tree crown condition in Missouri, 2000–2003. Gen. Tech. Rep. SRS–113. Asheville, NC: U.S. Department of Agriculture, Forest Service, Southern Research Station. 11 p.
Reams, G.A.; Smith, W.D.; Hansen, M.H. [and others]. 2005. The Forest Inventory and Analysis sampling frame. In: Bechtold, W.A.; Patterson, P.L., eds. The enhanced Forest Inventory and Analysis Program—national sampling design and estimation procedures. Asheville, NC: U.S. Department of Agriculture, Forest Service, Southern Research Station: 11–26.
Rebbeck, J.; Kloss, A.; Bowden, M. [and others]. 2015. Aerial detection of seed-bearing female Ailanthus altissima: a cost-effective method to map an invasive tree in forested landscapes. Forest Science. 61: 1068–1078.
17
Riitters, K.H.; Coulston, J.W.; Wickham, J.D. 2012. Fragmentation of forest communities in the Eastern United States. Forest Ecology and Management. 263: 85– 93.
Riitters, K.H.; Tkacz, B. 2004. The U.S. Forest Health Monitoring Program. In: Wiersma, G.B., ed.
Environmental monitoring. Boca Raton, FL: CRC Press: 669–683.
Riitters, K.H.; Wickham, J.D. 2012. Decline of forest interior conditions in the conterminous United States. Scientific Reports. 2: 653. 4 p. DOI: 10.1038.srep00653. [Published online: September 13, 2012].
Riitters, K.H.; Wickham, J.D.; Costanza, J.K.; Vogt, P. 2016. A global evaluation of forest interior area dynamics using tree cover data from 2000 to 2012. Landscape Ecology. 31: 137–148.
Root, H.T.; McCune, B.; Jovan, S. 2014. Lichen communities and species indicate climate thresholds in southeast and south-central Alaska, USA. The Bryologist. 117(3): 241– 252.
Rose, A.K.; Coulston, J.W. 2009. Ozone injury across the Southern United States, 2002–06. Gen. Tech. Rep. SRS- 118. Asheville, NC: U.S. Department of Agriculture, Forest Service, Southern Research Station. 25 p. Schomaker, M.E.; Zarnoch, S.J.; Bechtold, W.A. [and
others]. 2007. Crown-condition classification: a guide to data collection and analysis. Gen. Tech. Rep. SRS-102. Asheville, NC: U.S. Department of Agriculture, Forest Service, Southern Research Station. 78 p.
Schulz, B.K.; Bechtold, W.A.; Zarnoch, S.J. 2009. Sampling and estimation procedures for the vegetation diversity and structure indicator. Gen. Tech. Rep. PNW-781. Portland, OR: U.S. Department of Agriculture, Forest Service, Pacific Northwest Research Station. 53 p.
Schulz, B.K.; Gray, A.N. 2013. The new flora of northeastern USA: quantifying introduced plant species occupancy in forest ecosystems. Environmental Monitoring and Assessment. 185: 3931–3957.
Simkin, S.M.; Allen, E.B.; Bowman, W.D. [and others]. 2016. Conditional vulnerability of plant diversity to atmospheric nitrogen deposition across the United States. Proceedings of the National Academy of Sciences of the United States of America. 113: 4086–4091.
Smith, W.D.; Conkling, B.L. 2004. Analyzing forest health data. Gen. Tech. Rep. SRS-077. Asheville, NC: U.S. Department of Agriculture, Forest Service, Southern Research Station, 33 p. http://www.srs.fs.usda.gov/pubs/ gtr/gtr_srs077.pdf. [Date accessed: November 6, 2007]. Smith, W.B.; Miles, P.D.; Perry, C.H.; Pugh, S.A. 2009. Forest
resources of the United States, 2007. Gen. Tech. Rep. WO- 78. St. Paul, MN: U.S. Department of Agriculture, Forest Service, Washington Office. 336 p.
Steinman, J. 2004. Forest Health Monitoring in the Northeastern United States: disturbances and conditions during 1993-2002. NA-Technical Paper 01-04. Newtown Square, PA: U.S. Department of Agriculture, Forest Service, Northeastern Area State and Private Forestry. 46 p. http://fhm.fs.fed.us/pubs/tp/dist_cond/dc.shtml. [Date accessed: December 8, 2009].
Teale, S.A.; Castello, J.D. 2011. The past as key to the future: A new perspective on forest health. In: Castello, J.D.; Teale, S.A., eds. Forest health: an integrated perspective. New York: Cambridge University Press: 3–16.
U.S. Department of Agriculture (USDA) Forest Service. 2004. National report on sustainable forests—2003. FS-766. Washington, DC: U.S. Department of Agriculture, Forest Service. 139 p.
U.S. Department of Agriculture (USDA) Forest Service. 2011. National report on sustainable forests—2010. Report FS- 979. Washington, DC: U.S. Department of Agriculture, Forest Service. 134 p.
U.S. Department of Agriculture (USDA) Forest Service. 2016. MODIS active fire mapping program: fire detection GIS data. http://activefiremaps.fs.fed.us/gisdata.php. [Date accessed: March 11, 2016].
U.S. Geological Survey. 2014a. NLCD 2001 Land Cover (2011 edition). Sioux Falls, SD: U.S. Geological Survey. U.S. Geological Survey. 2014b. NLCD 2006 Land Cover
(2011 edition). Sioux Falls, SD: U.S. Geological Survey. U.S. Geological Survey. 2014c. NLCD 2011 Land Cover (2011
edition). Sioux Falls, SD: U.S. Geological Survey. Vogt, J.T.; Koch, F.H. 2016. The evolving role of Forest
Forest Health Monitoring
18
Chapter 1
Vose, J.M.; Clark, J.S.; Luce, C.H.; Patel-Weynand, T., eds. 2016. Effects of drought on forests and rangelands in the United States: a comprehensive science synthesis. Gen. Tech. Rep. WO-93b. Washington, DC: U.S. Department of Agriculture, Forest Service, Washington Office. 289 p. Woodall, C.W.; Conkling, B.L.; Amacher, M.C. [and others].
2010. The Forest Inventory and Analysis database version 4.0: database description and users manual for phase 3. Gen. Tech. Rep. NRS-61. Newtown Square, PA: U.S. Department of Agriculture, Forest Service, Northern Research Station. 180 p.
Woodall, C.W.; Amacher, M.C.; Bechtold, W.A. [and others]. 2011. Status and future of the forest health indicators program of the USA. Environmental Monitoring and Assessment. 177: 419–436.
Woodall, C.W.; Walters, B.F.; Westfall, J.A. 2012. Tracking downed dead wood in forests over time: development of a piece matching algorithm for line intercept sampling. Forest Ecology and Management. 277: 196–204.
Woodall, C.W.; Walters, B.F.; Oswalt, S.N. [and others]. 2013. Biomass and carbon attributes of downed woody materials in forests of the United States. Forest Ecology and Management. 305: 48–59.
Woudenberg, S.W.; Conkling, B.L.; O’Connell, B.M. [and others]. 2010. The Forest Inventory and Analysis database: database description and users manual version 4.0 for phase 2. Gen. Tech. Rep. RMRS-245. Fort Collins, CO: U.S. Department of Agriculture, Forest Service, Rocky Mountain Research Station. 336 p.