Fragility of a Structure, System, or Component for Seismic Performance
Mahendra Shah1)
1) U. S. Nuclear Regulatory Commission, Rockville, MD ABSTRACT
Structural engineers, researchers, code committees, and regulatory bodies have become increasingly interested in performance-based design of structures, systems, and components (SSCs) in the past few years. This has been demonstrated by the publication of codes for the performance-based design of traditional buildings, and by publication of a consensus standard for evaluating the seismic performance of nuclear facilities. Performance-based design is an engineering approach, where the design process is structured to achieve performance requirements (limit states) specified by the owners for asset protection, and/or to meet a risk level, specified in regulations, to ensure adequate protection of public health and safety. The probability of unacceptable performance of an SSC, or of exceeding a given limit state, is determined by convolving the seismic hazard curve for the site of the proposed facility with the fragility curve of the SSC, defined as a conditional limit-state probability of occurrence, expressed in terms of a given earthquake ground motion demand quantity (e.g., spectral acceleration, spectral velocity). This paper examines a Monte-Carlo method of analysis to develop a fragility curve for a low-rise concrete shear-wall component of a building structure, using empirical equations based on tests, and theoretical equations based on the truss and arch mechanisms for shear failure. Results of the analyses are compared with the analytical results available in the literature, and the capacity based on the consensus building code standard, to gain insight into the potential safety margins.
INTRODUCTION
Structural engineers, researchers, code committees, and regulatory bodies have become increasingly interested in performance-based design of structures, systems, and components (SSCs) in the past few years. This has been demonstrated by the publication of codes for the performance-based design of traditional buildings [1], and by publication of a consensus standard for evaluating the seismic performance of nuclear facilities [2]. Performance-based design is an engineering approach, where the design process is structured to achieve performance requirements (limit states) specified by the owners for asset protection, and/or to meet a risk level, specified in regulations, to ensure adequate protection of public health and safety.
Performance of an SSC is its ability to perform its function, within tolerable limits of damage, for specified-magnitudes loads resulting from man-made and natural events. Functional requirements of an SSC may be specified in terms of structural stability, life safety, protection of property, and building system or component function. Loads can be considered as a range of magnitude of events or loads for various performance levels [1], or as events varying in magnitudes at different values of probability of occurrence (e.g., seismic hazard curve) [2]. A seismic hazard curve is defined as a graph of the ground motion parameter of interest, such as peak ground acceleration, peak ground velocity, or spectral acceleration at a given frequency, plotted as a function of its annual probability of exceedance. Probability of unacceptable performance of an SSC, or exceeding a given limit state, during a seismic event, is determined by convolving the seismic hazard curve for the site of the proposed facility with the fragility curve of the SSC, defined as a conditional limit-state probability of occurrence, expressed in terms of a given earthquake ground motion demand quantity (e.g., spectral acceleration, spectral velocity). Thus, the probability of unacceptable performance of an SSC during a seismic event would depend on the seismic hazard curve and the fragility curve of the SSC. This paper examines a Monte-Carlo method of analysis to develop a fragility curve for a low-rise concrete shear-wall component of a building structure, using empirical equations based on tests [3], and theoretical equations based on the truss and arch mechanisms for shear failure [4]. Results of the analyses are compared with the analytical results available in the literature [5], and the capacity based on the consensus building code standard [6], to gain insight into potential safety margins from a probabilistic perspective against the unacceptable performance of a concrete shear-wall during a seismic event. Effects of various parameters on the probability of unacceptable performance of an SSC, considering the seismic hazard curve and the fragility curve, have been examined in a separate paper [7].
DEVELOPMENT OF A FRAGILITY CURVE
Fragility curves for the low-rise concrete shear-wall component of a building structure were developed using the methodology described below:
Methodology
1. The only source of uncertainty considered in this example is the stochastic variation in the material properties of reinforced concrete (i.e., concrete and reinforcing bars). No uncertainties in the loading of the wall were considered.
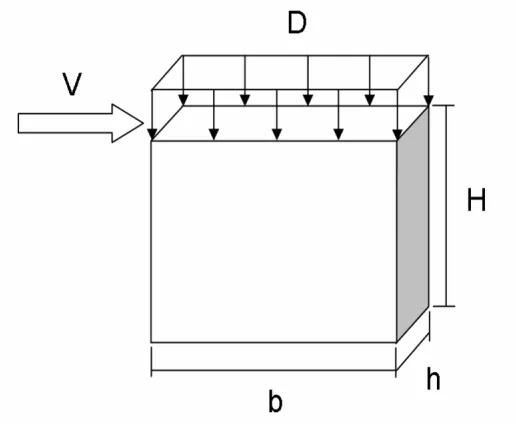
2. The shear-wall is assumed to be subjected to static loading under an in-plane lateral load, V, applied at the top of the wall, and a uniformly distributed axial compressive load, D, as shown in Figure 1. The dimensions are defined by the wall thickness, h, width, b, and height, H. Figure 1 is a simplified representation of the shear-wall sample problem considered in section 7.2 of Reference 5.
3. The ultimate shear strength of the wall, based on empirical equations [3] or theoretical equations [4], is selected as the failure criterion.
4. The model parameters used in the example for the concrete shear-wall are based on the example in NUREG/CR– 6715 [5]. The parameters include assumed values for the dimensions, axial loading, and steel reinforcement ratios, ρh and ρv (i.e., ratios of the reinforcing bar areas in the horizontal and vertical directions to the gross concrete area, respectively). See Table 1 for the example shear-wall parameters.
5. For the shear-wall model in Figure 1, a fixed-base boundary condition is assumed.
6. Monte Carlo analysis is performed to develop the fragility curve for the concrete shear-wall capacity, using the statistical variation of concrete strengths and yield strength of reinforcing bars, as given in NUREG/CR–6715 [5]. These values are shown in Table 2.
7. In a probabilistic analysis, the variations in the ultimate shear strength of the concrete, Vc, would be artificially reduced because the strength equations of Barda, et al. [3] include the square root of the compressive strength of concrete. To avoid this, it is assumed that the tensile (splitting) shear strength of concrete, ft, is related to the compressive strength through the equation ft = 6(fc’)
½
. Hence, for fragility analysis purposes, the term (fc’) ½
is substituted by ft/6 [5].
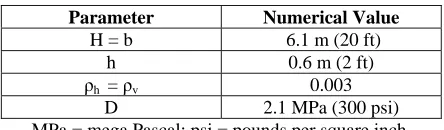
Table 1: Example Shear Wall Parameters
Parameter Numerical Value
H = b 6.1 m (20 ft)
h 0.6 m (2 ft)
ρh = ρv 0.003
D 2.1 MPa (300 psi)
MPa = mega Pascal; psi = pounds per square inch.
Table 2: Material Properties of Concrete and Steel Reinforcement (Ref. 1)
Material Property Mean
MPa [psi]
Coefficient of Variation
Distribution Type
28-day Compressive Strength of Concrete, fc’ 30.3 [4400] 0.16 Normal
Tensile Strength of Concrete, ft 3.3 [475] 0.18 Normal
Yield Strength of Steel Reinforcement, fy 489.5 [71000] 0.10 Lognormal MPa = mega Pascal; psi = pounds per square inch.
RESULTS
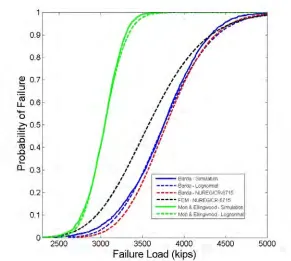
The fragility curves, as shown in Figure 2, were obtained using 2000 samples of ft and fy, generated with a Latin Hypercube Sampling (LHS) technique in the Monte Carlo analysis. The methodology was implemented in the MATLAB [9] software environment, following the approach described in Section 4 of Electric Power Research Institute, TR–103959 [8]. Figure 2 also shows the fragility curve from NUREG/CR-6715 [section 7.3 of Ref. 5], based on the finite-element analyses of the example shear wall. Parameters of the fragility curves (median capacity and logarithmic standard deviation), are shown in Table 3.
Figure 2: Fragility Curves for the Example Concrete Shear Wall
Table 3: Fragility Curves Parameters
Fragility Curve Basis Median Capacity MN [kips]
Logarithmic Standard Deviation
Empirical Equations [3] 16.7 [3,756] 0.12 Theoretical Equations [4] 13.6 [3,048] 0.07 Finite Element Analysis [5] 16.3 [3,655] 0.16
MN = Mega Newton.
Based on the review of Figure 2, it can be observed that the fragility curves based on Barda’s equations and the finite-element analysis appear to be reasonably close. The fragility curves based on the theoretical equations in Reference 4 yield lower shear-wall capacity significantly lower than the capacity predicted by Barda’s equations and the finite-element analysis results.
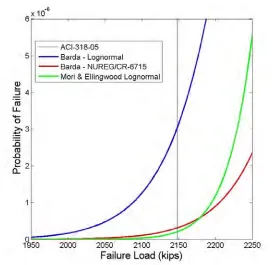
Figure 3: Probability of Failure vs. Load
Based on Figure 3, it can be observed that, for the example shear-wall considered in this paper, the probability of failure of a concrete shear wall is approximately less than 3E-6.
CONCLUSIONS
The example presented in this paper illustrates a methodology for developing a fragility curve, for a concrete shear-wall, using the Monte Carlo method of analysis for statistical variations of concrete and steel material properties. Results of the study provide insights on potential safety margins from probabilistic perspective against the unacceptable performance of a concrete shear-wall during a seismic event.
POTENTIAL AREAS OF FUTURE WORK
It is recognized that the study of the example concrete shear-wall, discussed in this paper, was limited. Potential work in the following areas would provide further insight into safety margins against unacceptable performance of a concrete shear-wall during a seismic event.
1. Investigate the basis of the theoretical equations used in Reference 4, to understand the reasons for the differences in the capacity predicted by these equations, and References 3 and 5.
2. Perform sensitivity analyses to understand the effects of concrete strength, ratios of horizontal and vertical reinforcement, wall dimensions, and axial load, on the fragility curve.
3. Evaluate other methods, such as the conservative-deterministic-failure-margin approach, and the finite-element analysis, to develop a fragility curve for a concrete shear wall, and other SSCs.
REFERENCES
1. International Code Council, ICC Performance Code for Buildings and Facilities, 2006.
2. American Society of Civil Engineers (ASCE)/Structural Engineering Institute (SEI), Seismic Design Criteria for Structures, Systems, and Components in Nuclear Facilities, ASCE/SEI 43-05, 2005.
3. Barda, F., Hanson J. M., and Corley, W. G., Shear Strength of Low-rise Walls with Boundary Elements, Symposium on Reinforced Concrete Structures in Seismic Zones, American Concrete Institute, Detroit, MI, 1976.
4. Mori, Y., Ellingwood, B. R., “Reliability Assessment of Reinforced Concrete Walls Degraded by Aggressive Operating Environments,” Computer-Aided Civil and Infrastructure Engineering, Vol. 21, 2006, pp. 157-170.
5. U.S. Nuclear Regulatory Commission, Probability-Based Evaluation of Degraded Reinforced Concrete Components in Nuclear Power Plants, NUREG/CR-6715, April 2001.
6. American Concrete Institute (ACI), Building Code Requirements for Structural Concrete, ACI 318-05, 2005. 7. Dasgupta, B., Shah, M. J., Chowdhury, A., “Sensitivity of Parameters Affecting Seismic Risk,” Proc. of the 19th
International Conference in Structural Mechanics and Reactor Technology, Toronto, Canada, August 2007. 8. Electric Power Research Institute, Methodology for Developing Seismic Fragilities, EPRI TR–103959, June 1994. 9. The Mathworks, MATLAB software, Version 7.4, Natic, MA, 2007.
ACKNOWLEDGMENTS
The author would like to thank Dr. Fernando Ferrante of the Center for Nuclear Waste Regulatory Analyses, San Antonio, TX, for his contribution to this paper.
DISCLAIMER NOTICE